Featured
Could the stock market face another meltdown like the March one
Our “chart of the week” looks at the relationship between gold and the rise in the Fed’s balance sheet. This past week was the September FOMC. The next one won’t be until November 4-5 right after the election. No surprise as Fed is prepared to leave interest rates unchanged into 2023. But the Fed also disappointed with no further stimulus announcements. Stocks sold off and gold faltered.

The COVID-19 pandemic has done quite a number on the global economy. There is little doubt about that. A detailed report on the devastation has been recently released, co-written by the World Bank (www.worldbank.org) and the World Health Organization (WHO) (www.who.int), titled A World in Disorder (https://apps.who.int/gpmb/assets/annual_report/GPMB_AR_2020_EN.pdf). In a nutshell, the report outlines that the world’s response to the pandemic was ill-prepared, with inadequate consideration for priorities. The result was, it showed the fragility of an interconnected economic, social, and environmental world order and has opened up and exacerbated fissures in societies and even between nations.
While the COVID-19 has resulted in over 30 million cases recorded and now upwards of one million deaths, we are not remotely in the same league like the Spanish Flu (1918–1920), the Plague of Justinian (541–549 AD), or the Black Death (1346–1353). While those plagues were devastating in terms of deaths and they definitely had a negative economic impact, the world was just not as interconnected economically, socially, or environmentally as it is today. Nor did those worlds have the population of today. For the record, during the time of Justinian, the world population was estimated at 200 million, during the Black Death 350 million, and at the time of the Spanish Flu 1.7 billion. Today, the world population is 7.8 billion. As well, back in those periods, most of the population was rurally situated. Today, the concentration is urban.
Our problem is the highly interconnected world. And when the world is hit with something like this, the response varies from country to country and the fissures that divide society open wider. Exacerbating the problem has been the rise of global inequality in terms of income and wealth. The world’s 2,825 billionaires have more wealth than 4.6 billion of the world’s population. There is an estimate of only about 47 million millionaires globally. One of the last figures we saw was that the world’s wealth is estimated at $360 trillion. The approximately 47 million millionaires control at least 44% of the wealth. The bottom half of wealth holders accounts for less than 1% of total global wealth. The good news, if any, is that the share of the bottom 90% now has 18% of the wealth vs. only 11% in 2000. However, these figures are pre-pandemic. It is estimated that the pandemic alone has pushed upwards of 500 million back into poverty. At the other end, it is telling when we read that Canada’s billionaires have seen their wealth increase some $37 billion during the pandemic. And at the other end of the spectrum, more than 2 million workers in Canada remain out of work—primarily low wage workers, as support services such as CERB are coming to an end with uncertainty as to what will replace it. Homelessness is also rising. Inequality grows and with it will eventually come more social unrest.
But global wealth inequality is merely one of the problems. Environmental problems have escalated on an unsustainable course. Overfishing, destruction of rain and boreal forests, destruction of barrier reefs, wetlands, farming land, water resources, overpopulation, and more have sparked a collapse in bio-diversity, resulting in negative impacts on the global population in terms of health, industry, water, and air pollution. All of it has been negatively impacted by global warming that has resulted in devastating wildfires (and not just in California), hurricanes, tornadoes, heavy precipitation in some parts of the world (snow and rain), and drought in others and destruction of species. If the world faced unprecedented volcanic eruptions, we could witness the return of mini ice-ages and the devastation that would cause, with disease and famine resulting in a high number of deaths globally. Periods of heavy volcanic eruptions were seen during the Plague of Justinian and the Black Death and into the 17th century during a period known as the mini ice-age which also saw a sharp rise in the bubonic plague.
All of this weighs heavily on the social fabric of countries and their population. The conflict between countries rises and conflict within countries also rises. We see that in the ongoing collapse of the world order as global institutions such as the UN, WHO, FAO, the World Bank, the WTO, the OECD, the G20, the IMF, and even NATO are under attack. Rising tensions between countries result in increased trade wars and sanctions along with military tensions. Within countries, there has been a sharp rise in nationalism and populism that could lead to civil war or revolutions. We are already seeing all of that daily, particularly as we watch the world’s largest economy, the U.S., deteriorate with deep divisions as it enters the November election. But that is also being played out in other countries to a lesser or even greater extent. However, if the U.S. were to degenerate into civil war, it could have highly negative economic repercussions for the entire world.
It is difficult to get a complete handle on the costs of the pandemic. Lowball estimates are around $11 trillion. Estimates of how many people were thrown out of work because of the pandemic are at least 200 million across the globe. Some industries such as tourism and airlines have been devastated. Many may never recover. It is estimated that the negative effects of the pandemic could linger for more than a few decades. While many essential workers have no choice but to stay on the job, millions of others were sent to work at home. That has left thousands of high-rise office towers as ghost towns. A small proportion of workers have returned to the offices. But there are now lingering questions as to what is going to happen to all of this real estate if the pandemic persists and those who can, continue to work at home. Many suggest this situation will persist well into 2021.
Governments have already spent trillions combatting the pandemic. Add in the costs of fighting extreme weather events and one has to wonder whether even Western governments could go bankrupt. Or the other extreme is that, with all of the money being printed, does it unleash hyperinflation? With hyperinflation think Weimer Republic, Germany after World War I or, more recently, Zimbabwe 2007–2009. Get out the wheelbarrows.
Budget deficits as a percentage of GDP have soared. U.S. – 15.9% or the equivalent of $3.1 trillion, Canada – 11% or $200 billion, U.K. – 18.2% or $515 billion, Germany – 7.2% or $290 billion, Japan – 11.3% or $562 billion, France – 11.3% or $315 billion, China – 6.3% or $850 billion, India – 7.9% or $215 billion. (Note: all figures are in U.S. dollars). And one should realize that is only part of what is being spent to combat the negative effects of the pandemic. Actions by central banks, primarily through bond purchases rather than going into the economy, have largely found their way into financial institutions, then into the stock markets. Central bank balance sheets – up; debt – up; money supply – up; stock market – up; gold – up; unemployment – up; personal savings – up; the velocity of money – down; GDP – down; the balance of trade – down; government budget deficit – up.
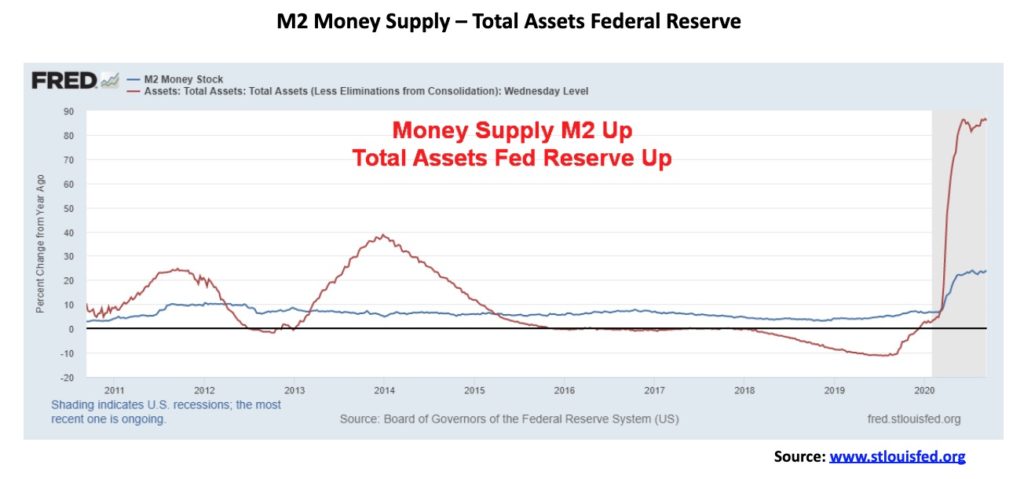
Both money supply (M2) and the total assets on the Fed’s balance sheet have soared since the beginning of the year. M2 is up $3.2 trillion or 21% while the Fed’s balance sheet has exploded upwards by $2.9 trillion or 69%. This tells us that a lot of money is getting into the financial system. But the question is, what good is it doing? Apparently, not much.
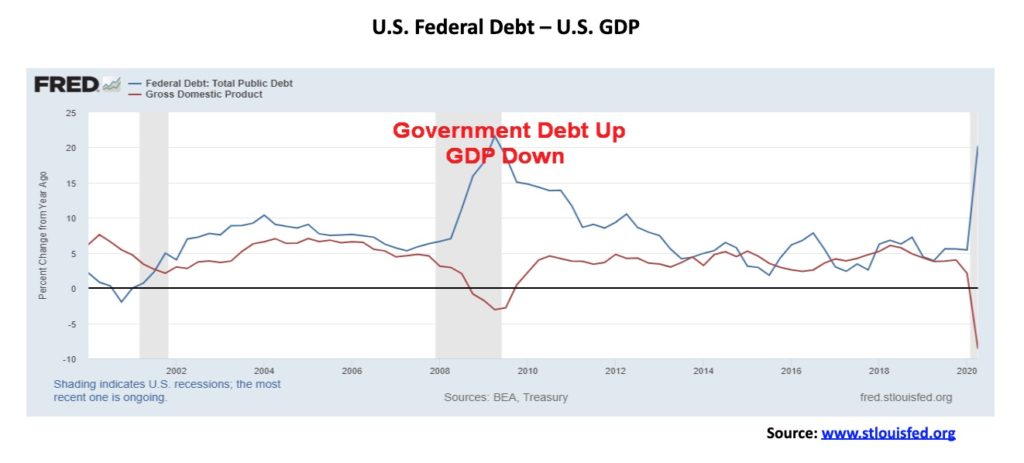
U.S. Federal Government debt has also exploded, up $3.3 trillion since Q4 or 12%, but GDP has gone the opposite way, having fallen almost $2.3 trillion or almost 10% from Q4 2019 to Q2 2020.
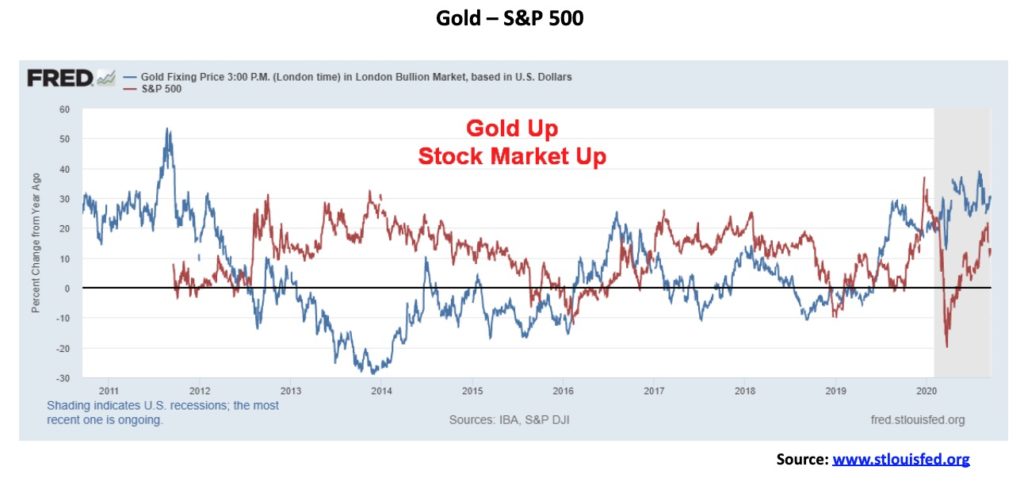
With all that money sloshing around, it is probably no surprise that both gold and stocks are up. Gold has gained almost 30% thus far in 2020, while the stock market (S&P 500) is up roughly 2.7%. Gold has been the main beneficiary, but when you isolate the six big tech stocks that have dominated the market (FAANGs + Microsoft) you discover that they have gained on average almost 35% to date. They make up some 25% of the S&P 500. Some two-thirds of S&P 500 stocks are actually down on the year.
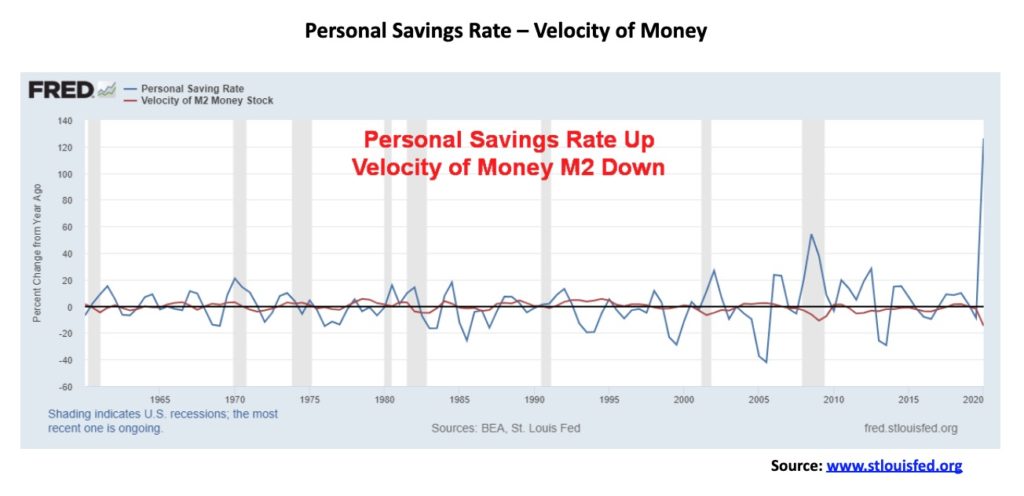
So, what’s happening to the money? Well, two things: it is going into the stock market and gold and it is being saved, as witnessed by the rise in the personal savings rate that has gone from 7.2% in December 2019 to 17.8% today with a recent peak of 33.7% in April. That suggests to us that money is being hoarded and it has also been used to pay down debt. The velocity of money (M2), a measurement of how fast money is turning over in the economy, just keeps on falling from a rate of 1.427 back in Q4 2019 to a rate of 1.102 in Q2 2020. We wouldn’t be surprised to see that ratio fall further. Fewer and fewer transactions are occurring in the economy.
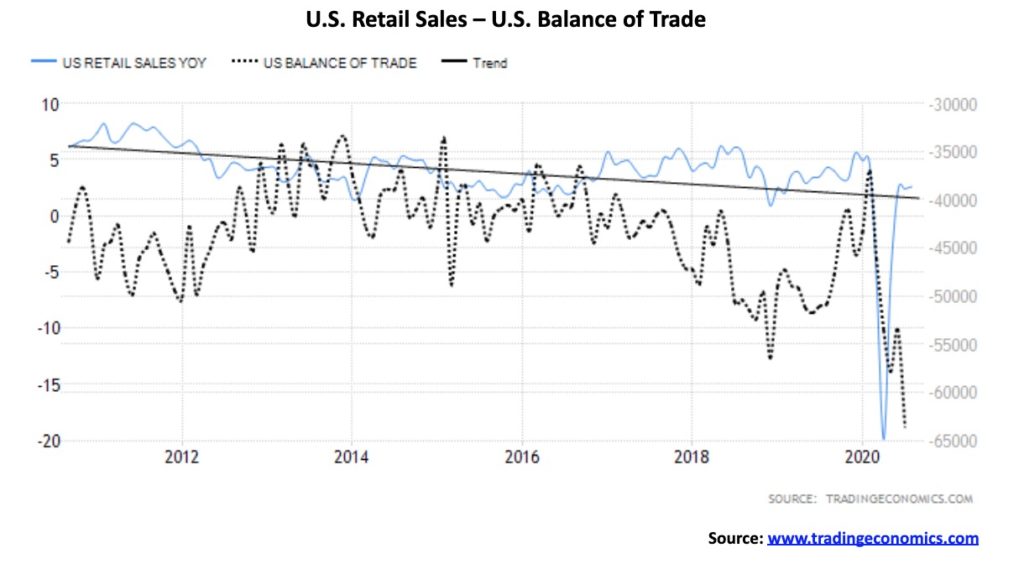
With the velocity of money falling, it is no surprise to find that retail sales have fallen. On a year-over-year basis, retail sales are up 2.6% but in April they had plunged almost 20% on a year-over-year basis. What is a surprise is that the balance of trade has fallen to the lowest level in years at $63.6 billion in July 2020. Considering all the trade wars/sanctions, etc., one would think the trade deficit would improve. Instead, it has steepened. And it can’t all be blamed on China. Both exports and imports have plunged, but exports have plunged a lot faster than imports.
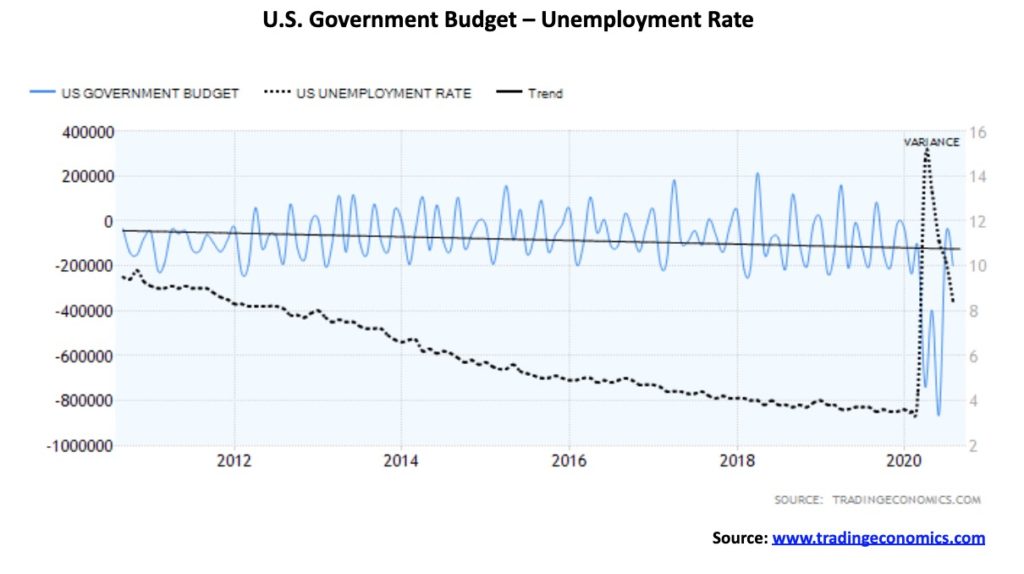
Both the U.S. government budget deficit and unemployment have soared. The budget deficit, conservatively now to be estimated at 15.9% of GDP, is the highest seen since the war years 1943–1945. If the COVID-19 continues in 2021, then the deficit as a percentage of GDP could again be higher than at almost anytime over the past 100 years. Total federal debt has increased some $6.8 trillion in the past four years. However, it is not the highest percentage increase seen under a president. That honour still belongs to President Franklin Roosevelt coping with the Great Depression and World War II.
As to the unemployment rate, it is the highest since the Great Depression even if it is down from the peak seen in April at 14.7% vs. the current rate of 8.4%. But that is just the core unemployment rate known as U3. When one includes discouraged workers unemployed less than one year, the BLS’s U6 unemployment rate is 14.2%. As we report monthly, Shadow Stats adds back in discouraged workers for more than one year and the unemployment rate is 28%. Thus, the importance of the stimulus packages which are currently tied up in Congress. Rising and high unemployment leads to more homelessness and social unrest as well as widening inequality.
So, what is the most important thing to watch for going forward? Most likely it is the upcoming election, a mere 43 days away. For investors, the question is, will the outcome of the election impact the markets, or as some say, their pocketbook? The answer is probably yes. What we don’t know is how. What we do know is, generally speaking, Wall Street and the corporations are indifferent as to who becomes president on November 3, even if the reasons for either one of them vary. A reminder that the stock markets rose to records under Trump/Pence and under Obama/Biden. As well, interest rates were held at or near zero for most of the Obama/Biden presidency and more recently under the Trump/Pence presidency. Gold also rose under both presidencies.
However, given this election is probably the most contentious one in U.S. history, the potential for chaos looms. Given Trump’s constant harping on potential fraud because of mail-in voting during the COVID-19, there is a real risk no winner will be declared on November 3. And, given the high number of potential mail-in ballots plus absentee ballots, counting could go on for days and even weeks. Initially Trump may appear as the winner, but as the mail-in vote gets counted the tide could shift. Couple that with potential lawsuits, particularly in closely fought states, and the “hanging chad” controversy in Florida in 2000 might look like a walk in the park by comparison.
Numerous analysts have been looking at potential outcomes and comments and opinions have appeared in a number of media publications. A landslide by one candidate or the other might have the other concede. But all other scenarios looked at ended in chaos and violence and a constitutional crisis. There are many on both sides who will not, under any circumstances, accept the other candidate. The political and cultural divide in the U.S. is that entrenched. There are many now talking openly about the potential for civil war. Not between armies but between many different groups on both sides that results in bombings, kidnappings, assassinations, ambushes, and more. Police may even choose sides. The U.S. has one of the most heavily armed civilian populations in the world. All that points to chaos. All the other problems such as climate change and tensions between nations may fade by comparison.
All of this could result in an extremely volatile stock market and a rush to safe havens such as gold and the U.S dollar. But if a loss of confidence in the U.S. political system develops than only gold (precious metals) might benefit. To quote the famous line said by Bette Davis in the film All About Eve, “Fasten your seatbelts, it’s going to be a bumpy night”.
Market and Trends
Is there a relationship between gold prices and the rise in the Fed’s balance sheet? This was a hypothesis recently of Tom McClellan of The McClellan Market Report (www.mcoscillator.com). We looked at it ourselves and draw the same conclusions. Yes, there is a relationship but it doesn’t always work.
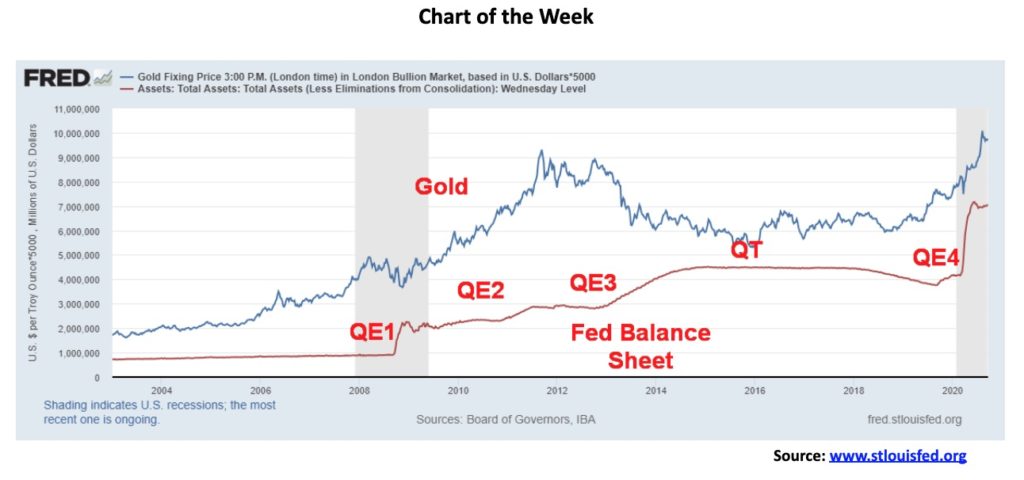
As the repo program got underway in September 2019 and QE4 went into overdrive in 2020, coinciding with the COVID-19 collapse in March, gold prices certainly rose. Since September 2019, the Fed’s balance sheet has exploded upward by $3.3 trillion. Since the onset of the COVID-19 at the end of February 2020, the Fed’s balance sheet has leaped $2.9 trillion, accounting for the bulk of the rise since September. Gold has gone up $407 since the beginning of September 2019 and is up $301 since the end of February. And that includes the shakedown in March 2020 when gold fell $209. The Fed’s balance sheet is up roughly $54 in the past week while gold is effectively flat. We can’t help but notice that the upward rise in the Fed’s balance sheet began to pause in June 2020, but gold did not make its most recent high until the first week of August. With the Fed seemingly starting to ramp up its balance sheet again, will gold follow?
Gold started a good rise in 2008 when the Fed brought in QE1. QE1 was underway in late September and gold bottomed in October 2008. Gold quickly rose to back over $1,000 at the time. Under QE2 gold rose even further eventually peaking at $1923 in September 2011. The Fed started QE3 in September 2012 but, oddly, that coincided with a top for gold. Possibly in anticipation of the coming Fed “taper”, gold collapsed in April 2013. In June 2013 the Fed announced the taper program which continued through 2014. When the Fed announced a rate hike in December 2015 that coincided with gold’s low at $1,045, gold began to rise again. During the period of 2018 through 2019 the Fed was also trying to reduce its balance sheet and gold faltered during that period.
So, the correlation wasn’t perfect. But, generally speaking, QE is good for gold. As long as we see the Fed expanding its balance sheet and the money supply growing along with the U.S. debt, gold prices seem to have only one way to go and that is up. But, beware: whenever they pause QE or the money supply stops growing, gold tends to falter. So far, we see few signs of that happening but there will be periods where they do pause.
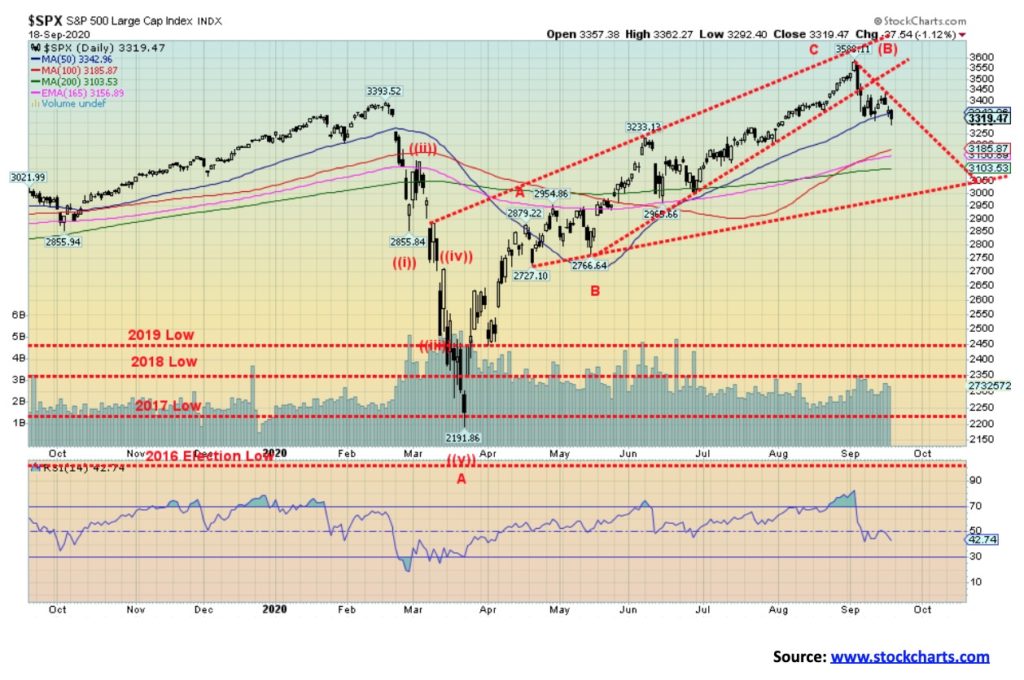
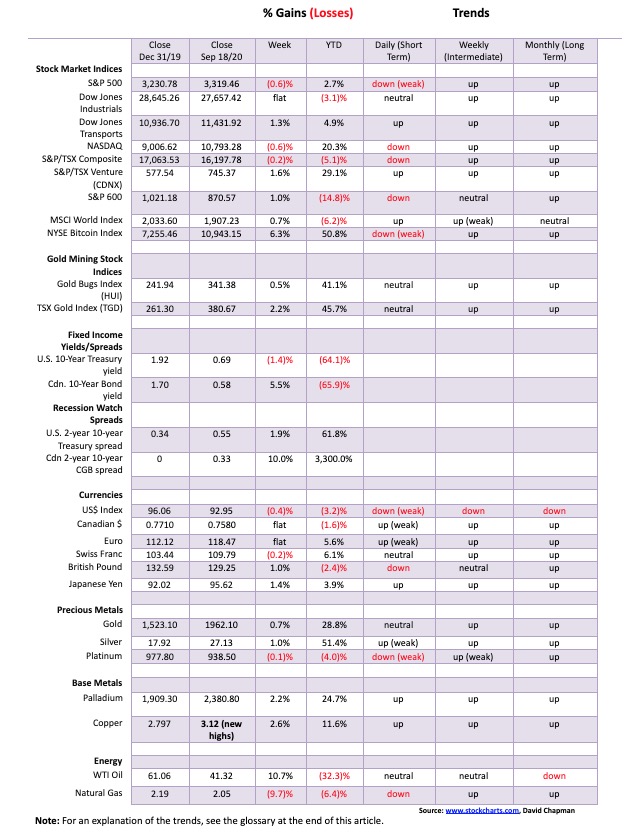
Despite attempts to rise this past week, the S&P 500 and the stock indices succumbed to selling and the S&P 500 dropped 0.6% on the week after falling 1.1% on Friday. The trigger was disappointment from the Fed that they didn’t provide further stimulus. Sure, the Fed, as expected, left rates unchanged and even said they won’t be touching them until at least 2023, but that was about it and the market was disappointed. There were also some weaker than expected economic numbers such as retail sales, weekly jobless claims, and housing starts, while better than expected consumer sentiment failed to offset the other numbers. Elsewhere, the Dow Jones Industrials (DJI) didn’t quite keep pace as it was largely unchanged on the week, the NASDAQ lost 0.6% while the Dow Jones Transportations (DJT) was a surprise, gaining 1.3%. The small-cap S&P 600 was also a surprise, up 1.0%.
Elsewhere, the TSX Composite was off about 0.2% but the TSX Venture Exchange (CDNX) gained 1.6%. The MSCI World Index was up 0.7% while Bitcoin gained 6.3%. Overseas in the EU, the London FTSE lost 0.6%, the Paris CAC 40 was down 1.1%, while the German DAX fell 0.7%. In Asia, China’s Shanghai Index (SSEC) was a gainer, up 2.4% but the Tokyo Nikkei Dow (TKN) lost 0.6%.
The S&P 500 is still up on the year by 2.7% but is down 7.5% from the recent top. With the close below the 50-day MA the focus shifts to the next levels of support. Key is the 200-day MA near 3,100, only about 200 points away. Major support remains at 3,000 and a firm break of that level could spark a mini-panic.
Other things negative for the market include the failure of Congress to agree with the Senate on another stimulus package, while the continuing divisiveness in the country leading up to the election is beginning to get noticed and investors are becoming wary. Of course, the plug could be pulled by the big players at any time and that in turn could spark a mini-panic. We just passed the quadruple witching hour on Friday and the fall solstice is on Tuesday. That period often sparks volatility in markets so we would not be surprised to see an uptick in that. And if there is an uptick in volatility it is more likely to be to the downside then the upside. Caution going forward is advised and maybe some puts. We note that the put/call ratio was still favouring calls, but that could change quickly.
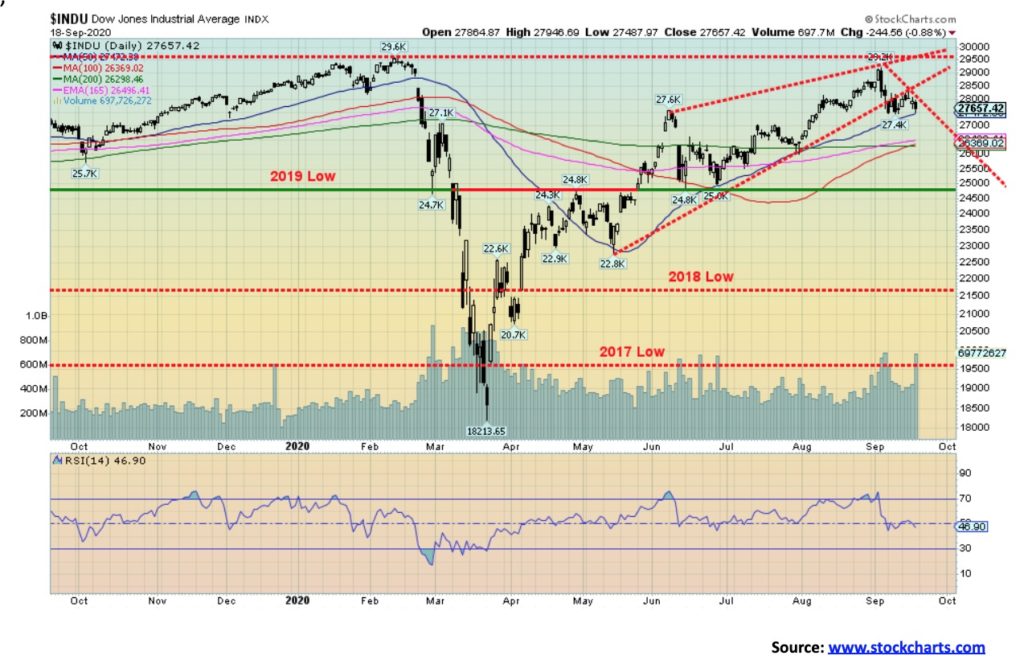
Unlike the S&P 500 and the NASDAQ, the DJI did not close under the 50-day MA and did not see new lows for the move down this past week. Overall, the DJI was effectively flat on the week, off a mere 0.03%. The DJI closed near its 50-day MA. In another divergence, the DJT actually gained on the week. So, these divergences give some hope to the bulls that the market could quickly recover. While the DJI hung in, most of the DJI stocks actually fell on the week. On Friday, only four closed the day higher while 26 fell. Regaining above 28,200 would be positive and suggest further gains. A firm break under 27,400 would see the DJI fall further towards significant support around 26,300. A break and close under 26,000 could trigger a sharper sell-off. We are still in September, the weakest month that often sees sell-offs into October/November. Just because the DJI diverged with the other indices doesn’t tell us that we are about to rally. We are more likely to fall than to rise.
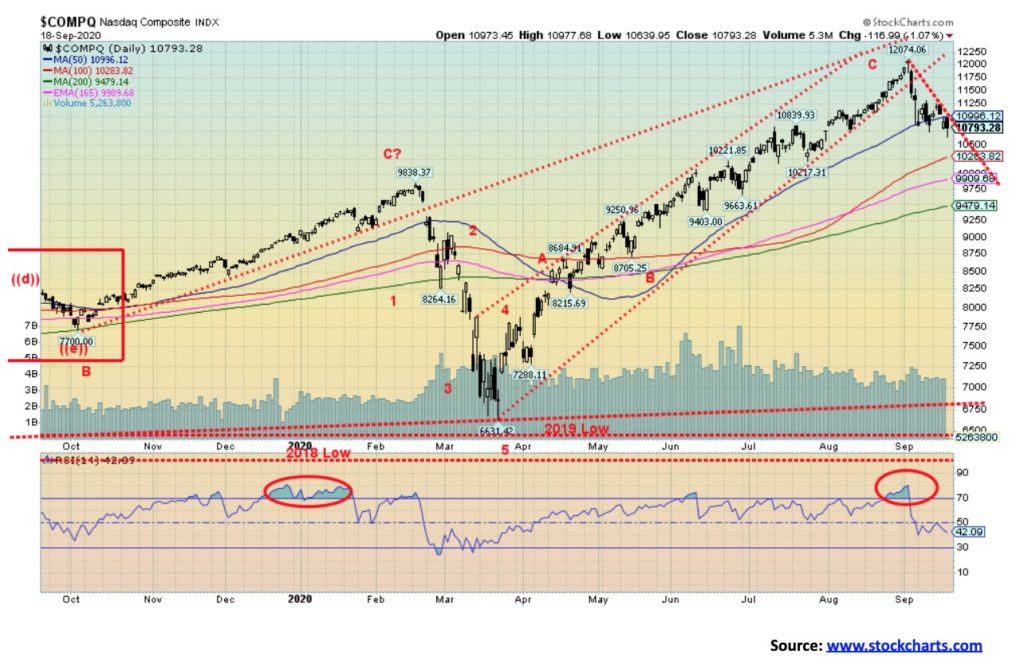
The NASDAQ dipped to a new low this past week for the current down move, falling and closing below the 50-day MA. This is a negative development. The NASDAQ lost 0.6% on the week. The big high-tech stocks that dominate the NASDAQ all fell this past week. Leading the downward march was Facebook, off 5.3%. Amazon dropped 5.2%, Apple 4.6%, Google 4.0%, Netflix 2.5%, and Microsoft 1.8%. Tesla surprised to the upside, gaining 18.6%. Buffet’s Berkshire Hathaway showed up the high-tech stocks, gaining a small 0.2%. With the NASDAQ breaking the 50-day MA it is potentially set up now to test all the way down to the 200-day MA. That’s down near 9,500, another 12% away. The NASDAQ is down so far 10.6%, so a drop to the 200-day MA would qualify as an official bear market given that, combined, it would be over 20%. There would be interim support near 10,000 and 10,500. Regaining above 11,500 might help prevent a drop. Above 11,700 a test of the highs and even new highs is possible.
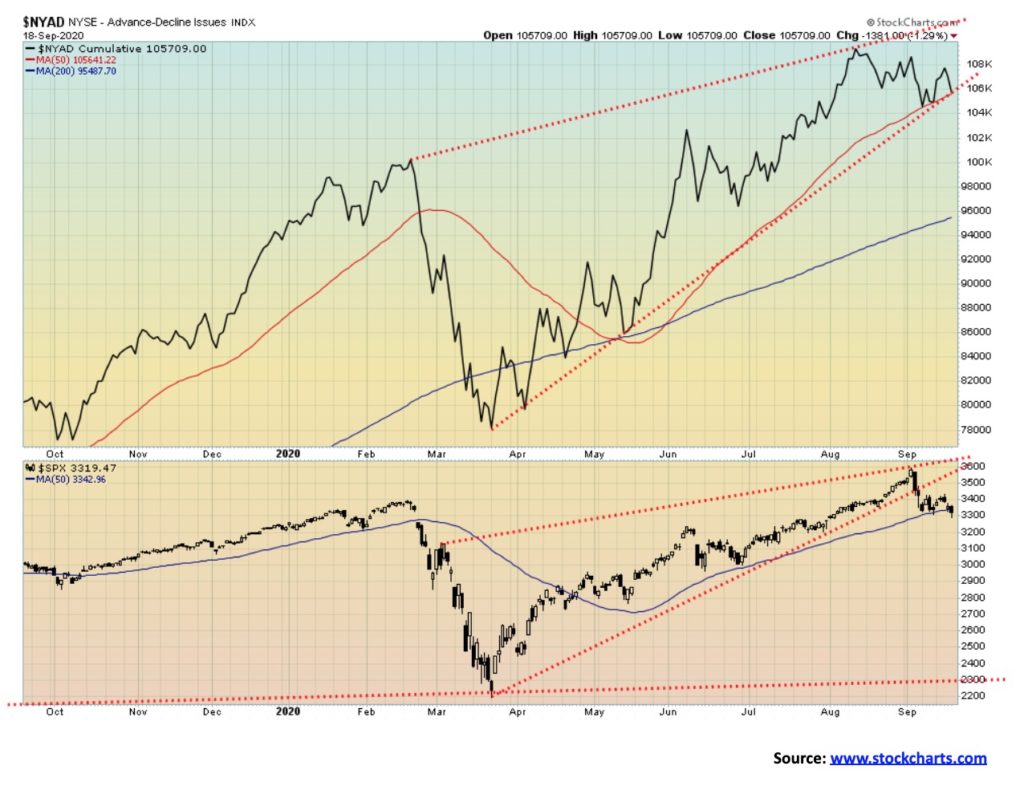
It was no surprise that breadth was negative this week in keeping with the decline in the market. The S&P 500 made new lows for the move but the advance/decline line was just short of new lows. The direction, though, is down and we expect that to continue. The AD line is hugging the 50-day MA, but the S&P 500 broke its 50-day MA. Once the AD line breaks its 50-day MA, the decline could accelerate.
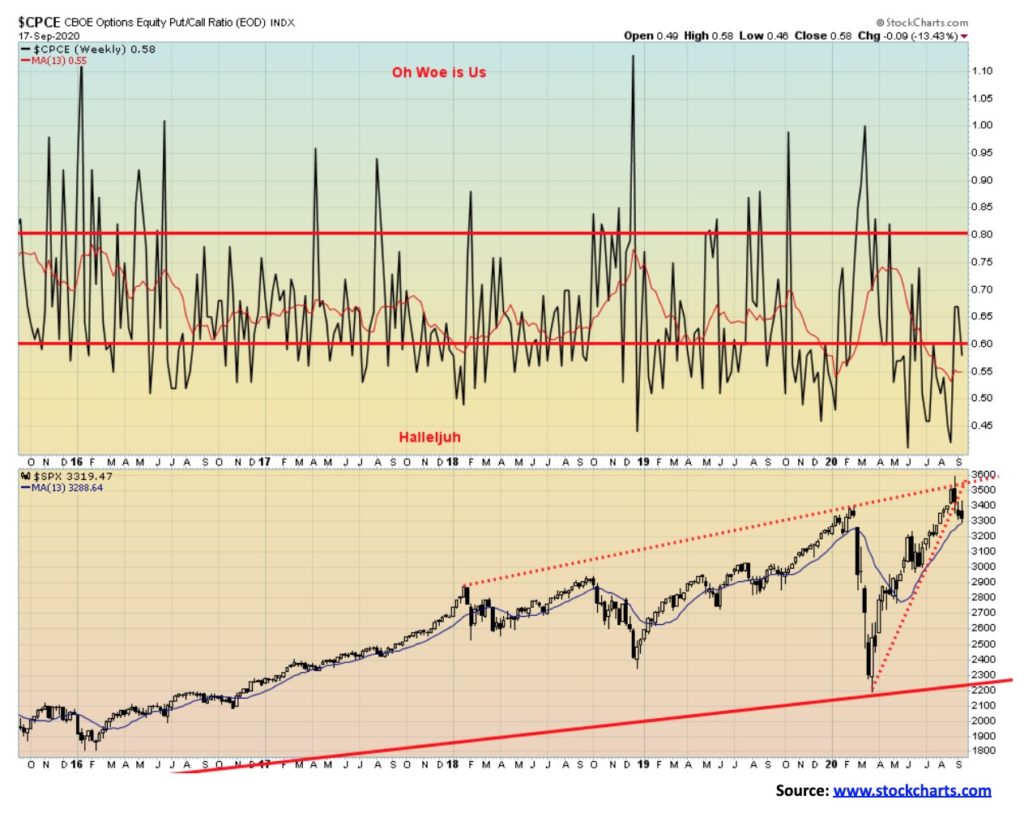
We were surprised to see the put/call ratio still favouring calls, even as the market fell this past week. Yes, it is only slightly into bull territory, but still. It is definitely not in bear territory. So this complacency, as measured by the put/call ratio, still dominates as the market is nowhere near bearish enough to suggest a low might be in.
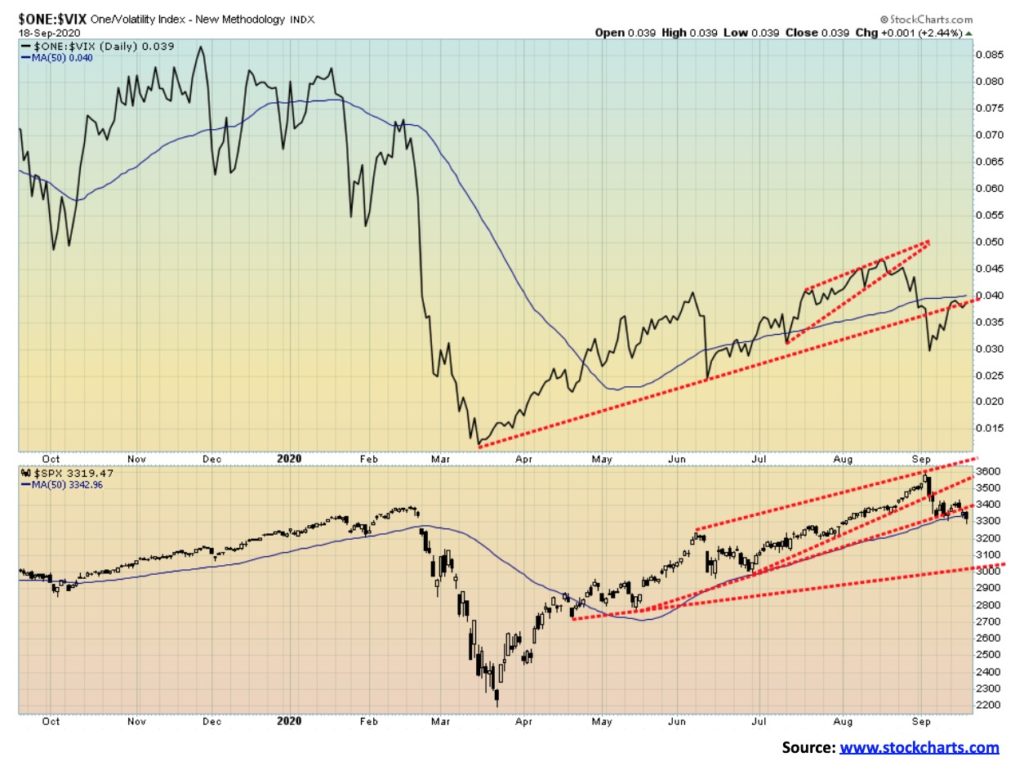
Are we seeing a bit of a divergence between the VIX volatility indicator and the S&P 500? The S&P 500 broke under its 50-day MA this past week, losing 0.6% on the week. But the VIX actually rose very marginally. The VIX cracked its 50-day MA sometime ago, but this week it was testing it. We expect it to fail but we can’t help but note that, while the S&P 500 made new lows for the move down, the VIX did not—a divergence. The bulls might jump on this as a sign that the sell-off is nearing an end. Maybe it is. But, as we note under our S&P 500 commentary, we need to regain 3,500 to suggest another test of the highs.
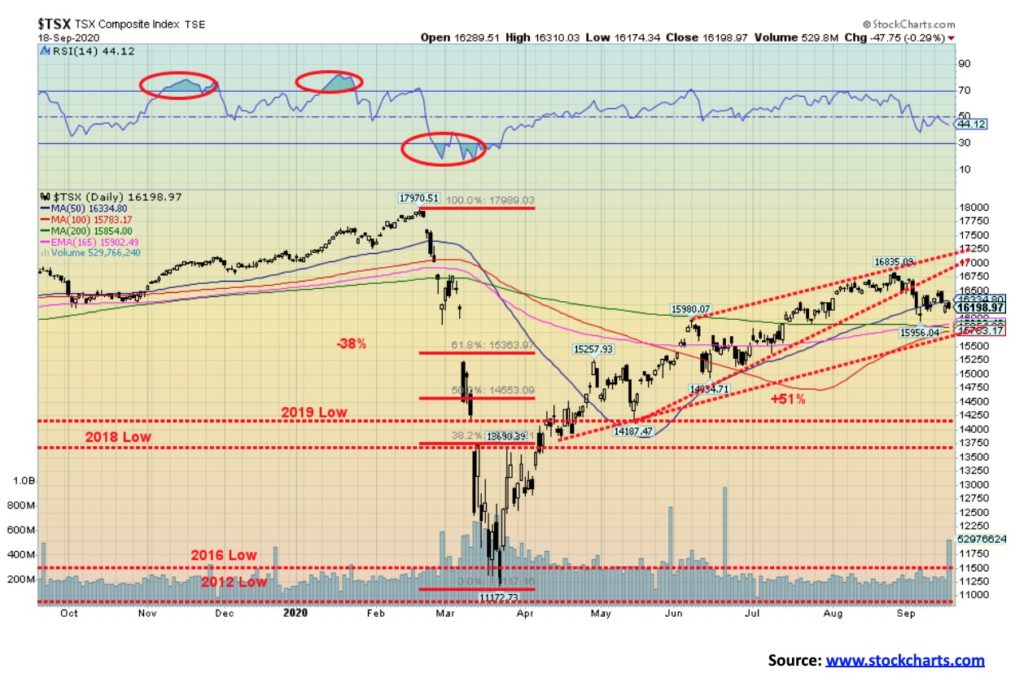
The TSX Composite fell about 0.2% this past week. The TSX Venture Exchange (CDNX) rose 1.6%, making it one of the better performing indices this past week. Seven of the fourteen sub-indices gained on the week, one was flat, and six fell. Leading the way to the upside was Health Care (THC), up 4.4%. Income Trusts (TCM) fared well, gaining 3.6%. Real Estate (TRE) was up 2.0%. Leading the downside was Telecommunications (TTS), losing 1.7%. Information Technology (TKK) lost 1.4% and Golds (TGD) fell 1.1%. Like some of the U.S. indices the TSX Composite fell under its 50-day MA this past week. Looming below are the 100- and 200-day MAs, currently near 15,800. A firm breakdown under 15,650 could, in theory, trigger a mini-crash. The decline thus far is indicating that further losses should be expected. Only regaining back above 16,750 might change this growing negative scenario. Golds, Metals, and Materials continue to be the best-looking sectors to be in.
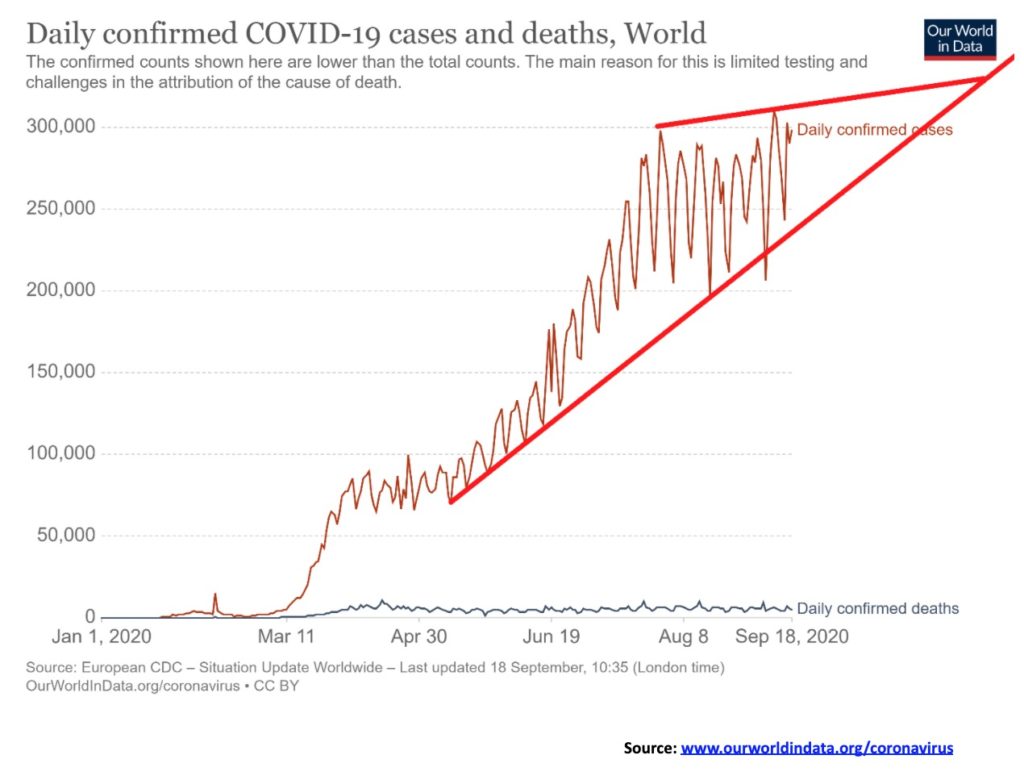
The number of cases of COVID-19 keeps on creeping higher. We are now starting to see over 300,000 cases daily and roughly 5,500 dead every day. At current rates, we could see another 31 million cases by year end and another 600,000 dead. The U.S. continues to lead the way, but India is now rapidly gaining with over 5.2 million cases. The U.S. leads the dead with over 200 thousand. Brazil is well behind with around 135 thousand. Despite the high cases in India, deaths so far (at least official deaths) are around 84 thousand. That still makes them third in deaths. A surprise number 4 is Mexico with over 70 thousand deaths so far. Mexico is only number 7 in cases. Globally, the death rate ratio remains at around 3.1%, but that can vary from country to country. The U.S. is at 2.9% but Canada, surprisingly, is at 6.4%. However, for Canada the bulk of those took place early on at long term care homes. That has fallen sharply now. In looking at the chart above, the encouraging news is that it could be forming an ascending wedge triangle. That’s potentially bullish, but we’d have to start printing under 250 thousand or fewer new cases daily to confirm that. We could also argue that a rising triangle is forming and that’s bearish for the number of cases.
September 20, 2020 12:27 GMT
Number of cases: 31,035,726
Number of deaths: 962,188
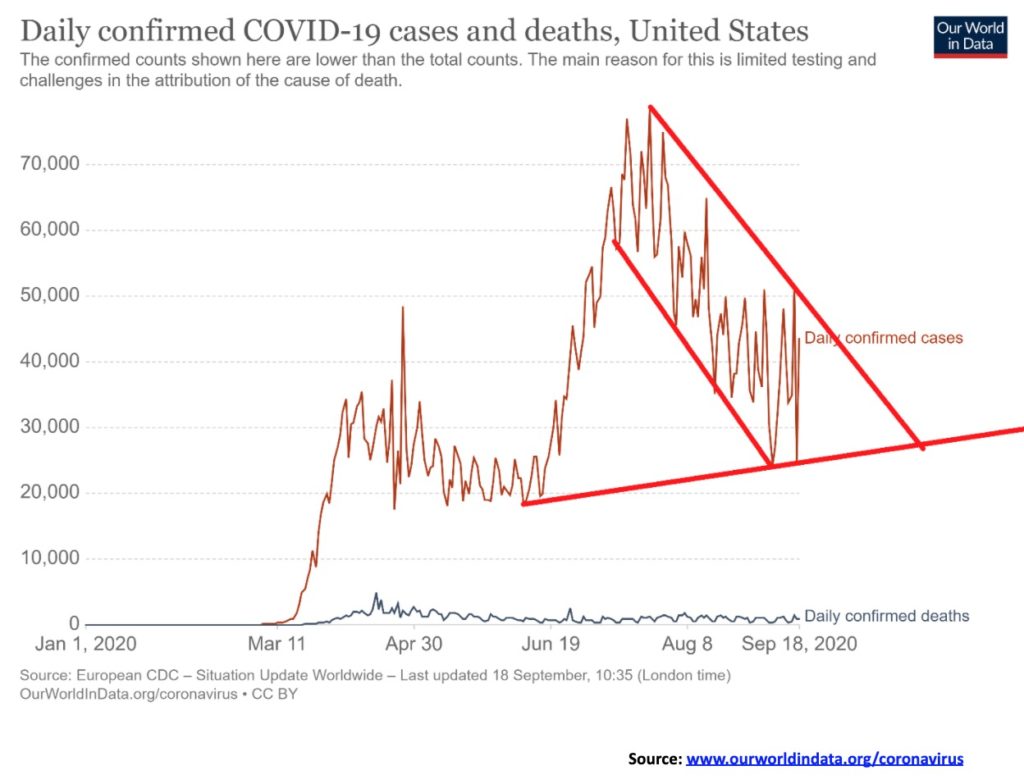
The U.S. continues to lead the world in cases and deaths. The number of cases is now bouncing around between 30,000 and 50,000. That is, thankfully, down from the 50,000 to 75,000 that prevailed earlier. That’s daily by the way. California leads the way, but Texas and Florida are not that far behind. In terms of deaths, New York remains well in front but most of them occurred earlier in the cycle. New Jersey and Texas are just behind and Florida is gaining. The U.S. is still getting roughly 1,000 deaths every day, give or take. Quite tellingly, the U.S. has now reported over 200 thousand dead and is rapidly approaching 7 million cases. Both are number one in the world. At current rates, the U.S. could see another 4 million plus cases by year end and over 100 thousand additional deaths.
September 20, 2020 12:27 GMT
Number of cases: 6,969,917
Number of deaths: 203,851
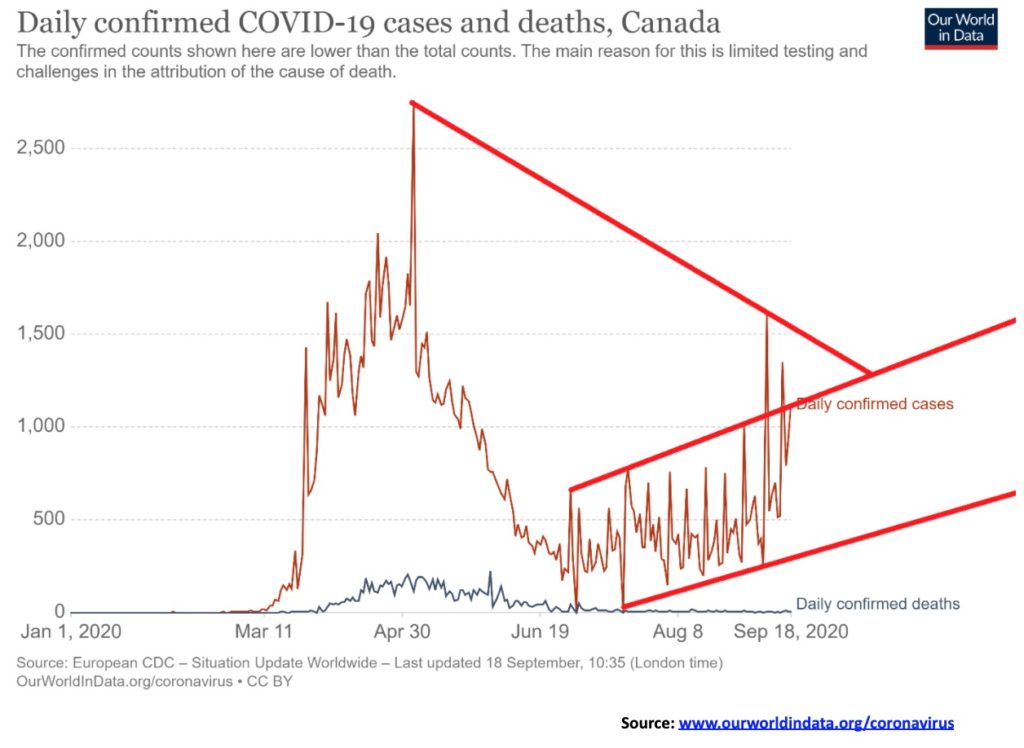
Canadian cases of the COVID-19 are on a slow rise. That is prompting provinces to once again announce restrictions. If things deteriorate further, could another lockdown be far behind? Given the economic devastation that has already occurred, we don’t expect another lockdown to be greeted by balloons and streamers, but instead by shouting and screaming. Canada is drifting back towards upwards of 1,000 cases daily. That’s the bad news. The good news is that deaths are remaining low. Recall last time that the bulk of deaths (upwards of 80%?) were occurring in long term care homes. That seems to be a bit under control and this time the number of cases is rising with younger people. But, given better health, the survival rate is also higher. So, cases up, but deaths flatlining. Canada ranks 26th globally in cases but number 20 in deaths. To demonstrate the deadliness of COVID-19, Erin O’Toole, the leader of the opposition Conservative Party, and Yves Blanchett, the leader of the Bloc Québécois, have tested positive for COVID-19.
September 20, 2020 12:27 GMT
Number of cases: 142,774
Number of deaths: 9,211
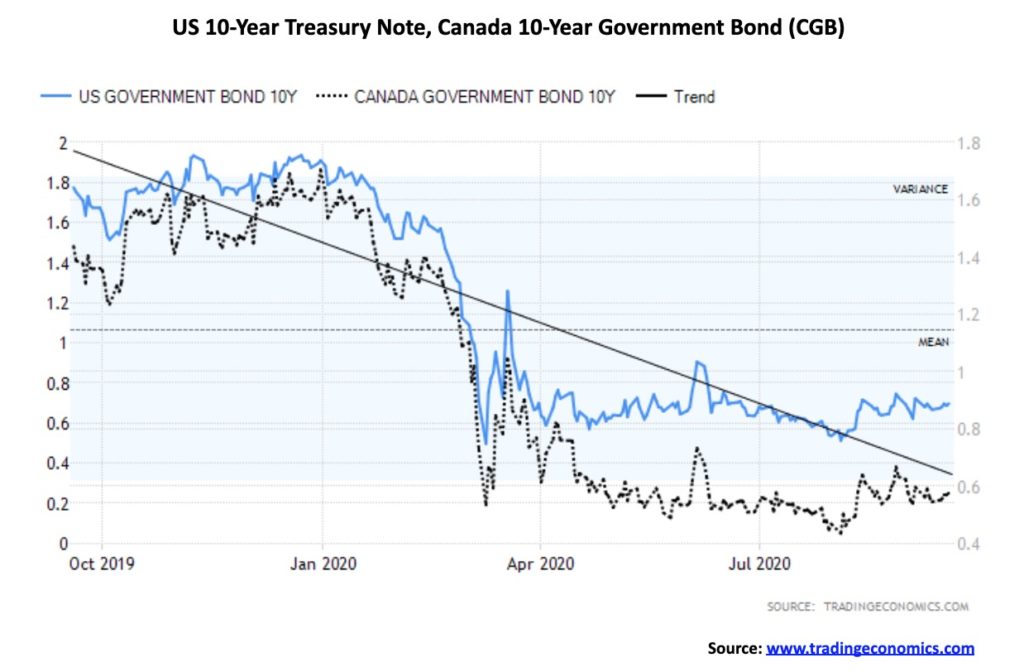
Interest rates continue to do nothing much. The Fed did as we expected and announced that ZIRP interest rates are with us until at least 2023. The U.S. 10-year treasury note was at 0.69% vs. 0.70% while the 10-year Government of Canada bond (CGB) was at 0.58% vs. 0.55%. The narrow range is such that recent U.S. treasury issues saw very narrow spreads. Low volatility is also a characteristic of the current bond market, reflecting investor uncertainty as to what is going on and also complacency that not much is about to change. All we can say is that complacency has a way of coming back to haunt us as low volatility suddenly gives way to high volatility in unexpected ways. Of the economic numbers this past week, retail sales surprised to the downside. The market had expected a 1% rise but instead got only a 0.6% rise. Year over year they show a gain of 2.6% which is effectively flat when one strips out inflation and population growth. Housing starts for August were 1.416 million, but they expected 1.478 million. July was at 1.492 million. Month over month housing starts were down 5.1% while building permits fell 0.9%. Initial jobless claims came in at 860 thousand, but that was above the expected 850 thousand. Still, it was down from the previous week’s 893 thousand. Continuing jobless claims were 12,628 thousand vs. 13,544 thousand. In Canada, August retail sales came in at +0.6%, but when you strip out autos it actually fell 0.4%. The U.S. current account balance was a deficit of $170.5 billion vs. an expectation of $157.9 billion. A weaker current account balance should weigh on GDP. The Michigan Consumer Sentiment Index preliminary for September was 78.9 vs. an expectation of 75. Hard to believe that the consumer expectations are improving.
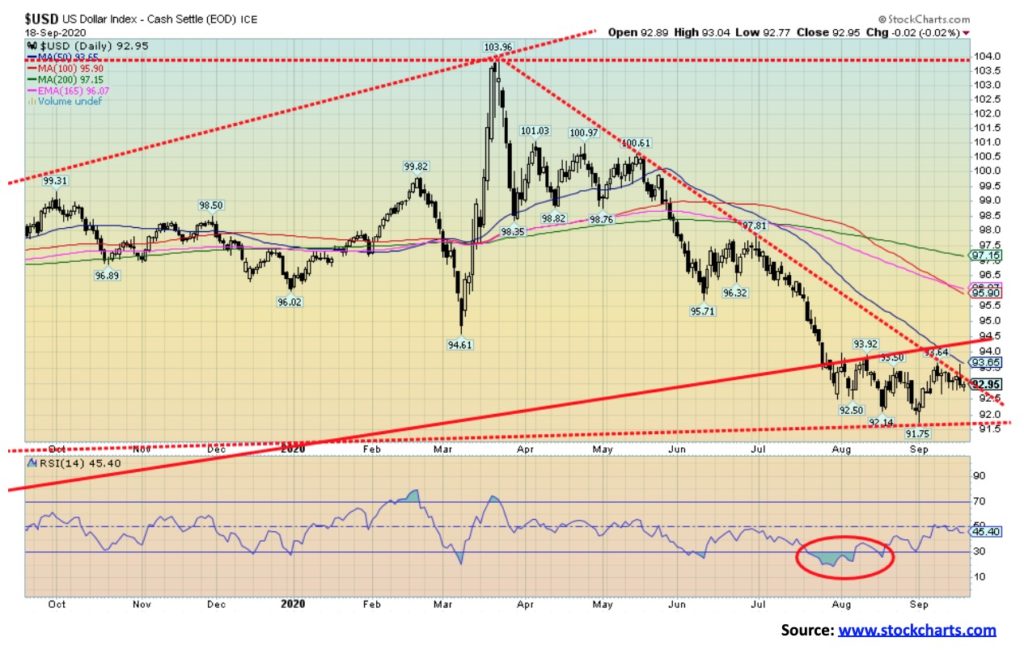
It was a pretty quiet week for the currencies with little in the way of movement. The US$ Index fell 0.4%, the euro was effectively flat on the week with a miniscule 0.04% rise, the pound sterling bounced back from last week’s debacle, gaining 1.0%, while the Swiss franc lost a small 0.2%. The best performer on the week was the Japanese yen as it gained 1.4%. Surprisingly, Japan is beginning to be seen as a safe haven. The Cdn$ was absolutely flat on the week. The U.S. dollar softened following the higher than expected weekly jobless claims. The U.S. dollar also was responding to signs of economic weakness and coronavirus numbers creeping higher. The ongoing deep divisions in the U.S. leading into the election are not helping. The US$ Index challenged the breakout line to the upside but failed. High on the week was at 93.63, just shy of the 93.64 level seen on September 9. That’s two failures at that level. Still, the upside breakout level remains at 93.65 while the downside breakdown level is at 91.75. A downside break could see the US$ Index fall to 88 while an upside break could send the US$ Index up to 96. We continue favour a downside break. However, the pattern could be interpreted as a forming head and shoulders bottom. So, we can’t ignore the upside.
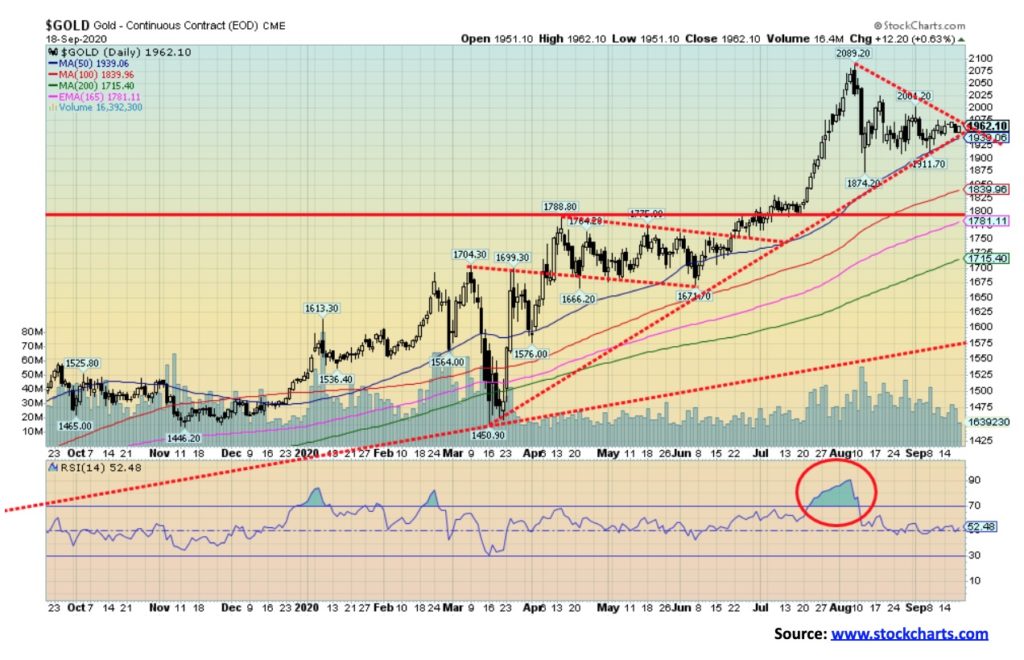
It was a decidedly mixed week for the precious metals. Gold did manage to gain 0.7% while silver was up 1.0%. Platinum, however, fell 0.1%. Of the metals with some precious metal’s characteristics, palladium gained 2.1% while copper was up 2.6% and made new 52-week highs. Gold was pleased that the Fed will keep interest rates low to nil for the next few years, but gold, like the market, wanted more stimulus from the Fed and that wasn’t forthcoming. Gold managed to gain as the U.S. dollar was softer on the week and the coronavirus continues to ravage with threats of more lockdowns. The somewhat higher jobless claims also helped a bit. But, overall, the week was kind of flat and the triangle that has been forming continued. But we should soon be seeing some sort of conclusion. The triangle appears poised to break out to the upside. However, we still need to see a move over first $2,000 then over $2,040 to suggest new highs above $2089. Potential targets are up to $2,200 with some potential to rise to $2,300. The downside break comes at around $1,940 with confirmation below $1,910. We could see gold fall to $1,725. Given everything that is going on, we highly doubt that scenario but it should be noted. Canadian Maple Leaf 1-ounce coins trade at roughly $180 over spot Cdn$. We didn’t receive our usual COT report this week but we went on to the CFTC’s website and picked up the numbers. We just find their reports a little harder to read than the one we usually show. Commercials showed a rise of 8,770 long contracts and a rise of 18,107 short contracts. The large speculators (managed futures, hedge funds, etc.) showed a rise of 13,611 long contracts and a rise of 4,421 short contracts. Total open interest rose 33,866 contracts which is positive, given that gold prices rose on the week. Overall, we remain bullish on gold but we need to soon see a conclusion to the triangle that has been forming. We believe the breakout should be to the upside.
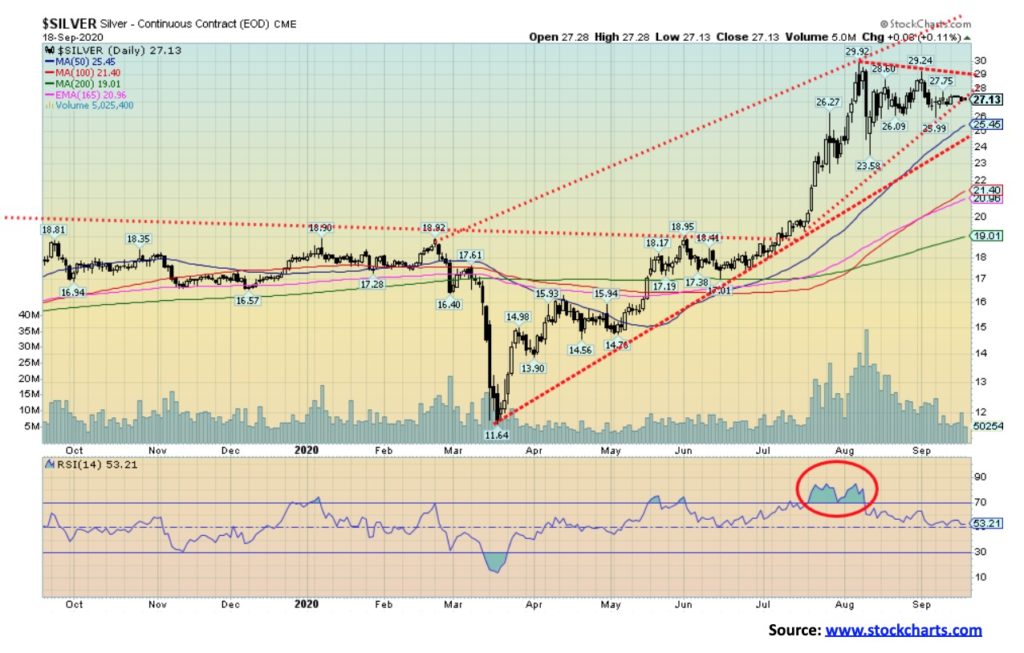
Silver managed to gain 1.0% this past week. It was a difficult week in some respects so a gain is nothing to be sneezed at. Silver, like gold, continues to make what appears to be an expanding consolidation triangle. Our breakout level is at $29, although a move above $30 would confirm the breakout. Potential targets are up to $35, possibly $36. A downside break is possible, but really all it seems to be doing is potentially expanding the triangle. We’d be concerned, however, if silver were to break down under $24.50/$25. That could imply that new lows below $23.58 could be seen. Potential downside targets could then become $18.50. We doubt that scenario but we should be aware of it. Sales of silver at the top mints (U.S. Mint, Royal Canadian Mint, Perth Mint) saw 58 million ounces sold in the first half of the year. The Royal Canadian Mint led the way. Silver Eagles, Canadian Maples, and Kookaburras and Koalas were the most popular. Canadian 2020 Maple Leafs trade at an almost $9 premium to spot. As we noted with gold, the COT report, which is usually updated weekly, was not updated, but we did see the CFTC numbers. We note commercials long positions fell by 2,285 contracts this past week while shorts rose 4,665 contracts. For the large speculators, longs rose by 4,109 contracts while shorts fell 593 contracts. Total open interest rose 4,029 contracts on a week that silver prices were up.
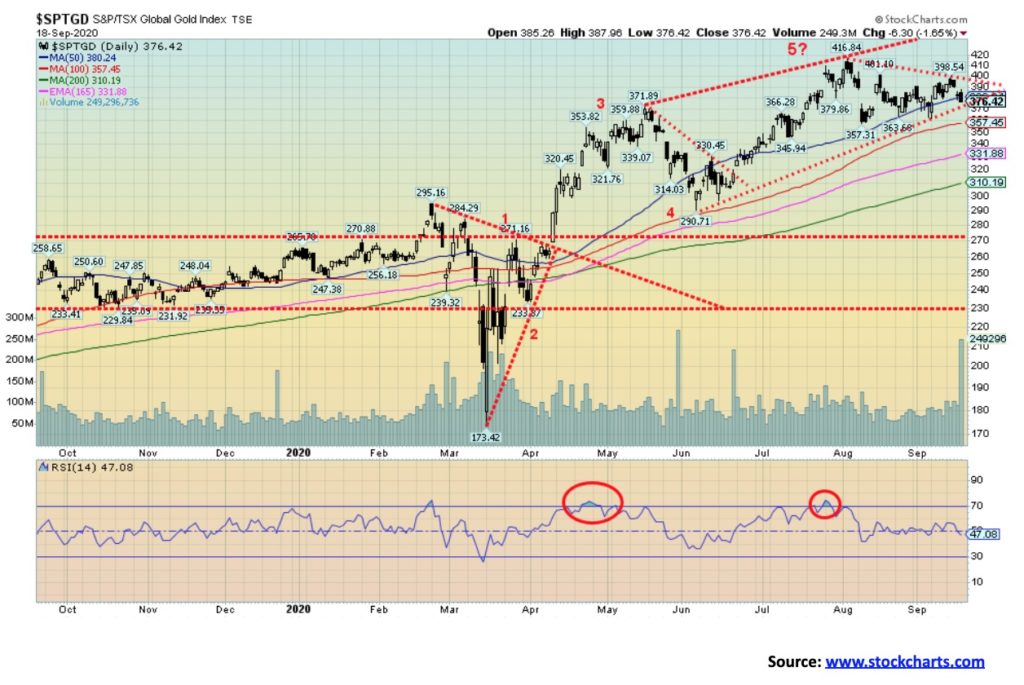
It was a decidedly mixed week for the precious metal stocks. The Gold Bugs Index (HUI) rose 0.4% but the TSX Gold Index (TGD) fell 1.1%. So, it wasn’t really a bad week—it was just a “marking time” week. The TGD remains poised to either break down from current levels or rise. The TGD breaks out above 400 and could project up to 460. The breakdown is just below at 370 and it could see the TGD fall to 310. That, coincidently, is the current 200-day MA. Rising to 460 would bring the TGD back to the 2011 highs (455). It has taken nine years, but the TGD may be prepared to go full circle. From 2011 to 2015 the TGD fell 75%. Since that low in 2015 the TGD is up 230%. More importantly, the TGD is up 117% from the March 2020 low. Gold stocks have been one of the top performers since the pandemic meltdown. The Gold Miners Bullish Percent Index is currently just under 83. That’s high but it is not yet extreme. It is definitely in super-bullish territory, so that is a concern. If the market gets too bullish it sets itself for a pullback, sometimes a sharp one. Generally, the gold stocks, as measured by the Gold/HUI ratio and the TGD/TSX ratio, are in somewhat neutral territory—not extremely undervalued nor extremely overvalued in relation to gold. Still, they lean towards undervalued. That implies that the gold stocks could continue to outperform gold and silver, or they could fail colossally here. We lean towards the former. The pattern forming on the TGD still appears to be an expanding consolidation triangle that should break to the upside. When the break comes, it should be on volume. But until it does and makes new highs above 417, one has to be aware of the potential for a downside break instead.
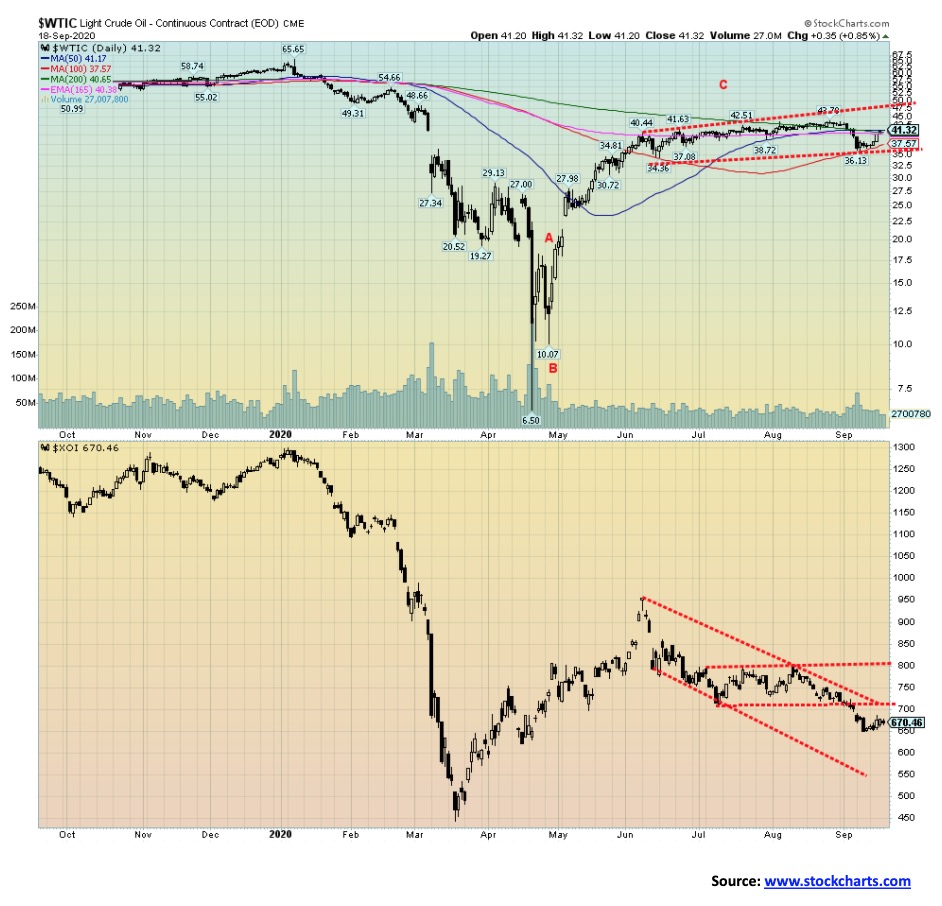
Just when we thought that oil prices might suddenly collapse, they rebounded. So, what happened? Hurricane Sally helped as offshore platforms shut down. So did an unexpected drawdown in storage. But then OPEC helped as well, showing a level of cooperation on cuts that belies their usual testy relationships.
It didn’t help natural gas (NG), though, as NG prices fell 9.7% this past week even as oil prices rose 10.7%. So where did that leave the energy stocks? Well, the TSX Energy Index (TEN) was flat on the week but the ARCA Oil & Gas Index (XOI) rose 2.3%. Both were underwhelming and the bearish position of the energy stocks remains.
So which way now? Instead of breaking down, WTI oil might just be trying to expand its trading range to $36 to $43. That leaves the question as to which way it will break—up or down? Goldman Sachs thinks “up” as they are calling for a price of $49 by year end for Brent Oil (currently $43.68). That would put WTI Oil around $47. A firm breakout to new highs above $43.78, the most recent high, potentially projects up to $49/$51. But the lackadaisical trading for the energy stocks suggests that any gains might be minimal at best. The energy stocks are sending the signal that they don’t expect much in the way of any rise in oil prices nor in NG prices, either. Weak seasonals carry into November before one might start to see a rise in prices.
Overall, the sector remains uninspiring and one for investors to avoid.
—
(Featured image by Jason Briscoe via Unsplash)
DISCLAIMER: This article was written by a third party contributor and does not reflect the opinion of Born2Invest, its management, staff or its associates. Please review our disclaimer for more information.
This article may include forward-looking statements. These forward-looking statements generally are identified by the words “believe,” “project,” “estimate,” “become,” “plan,” “will,” and similar expressions. These forward-looking statements involve known and unknown risks as well as uncertainties, including those discussed in the following cautionary statements and elsewhere in this article and on this site. Although the Company may believe that its expectations are based on reasonable assumptions, the actual results that the Company may achieve may differ materially from any forward-looking statements, which reflect the opinions of the management of the Company only as of the date hereof. Additionally, please make sure to read these important disclosures.


The TopRanked.io Guide to 2026’s Biggest and Best Affiliate Opportunities
Want to earn affiliate commissions on literal billions of dollars worth of revenue? Then this week, we've got something special...


Eni Advances Energy Transition with Major Investment and Emissions Cuts
Eni showcased its “Just Transition” report in Rome, highlighting stakeholder collaboration and progress toward decarbonization goals. The company invested over...


The German Fintech Market Shows Resilience and Strong Investment Growth in 2026
Germany’s fintech sector remained resilient in 2026 despite economic crisis and rising insolvencies. Investments reached €14.2 billion, showing strong investor...


Cannabis Legalization in Germany: A Mixed Interim Assessment
Germany’s cannabis legalization has reduced criminal cases and eased pressure on the justice system, while the black market is slowly...


Sustainable Restoration of the Haus Hövener Garden in Brilon
The Brilon Construction Workers Association is restoring the Haus Hövener garden into a cultural community space, funded through a €10,000...
 |
|
 |  |
 |
|
-

 Cannabis1 week ago
Amsterdam Keeps Coffeeshops Open to Tourists While Raising Europe’s Highest Tourist Tax
-

 Fintech5 days ago
German Fintech Investment Slumps as AI Becomes Key Focus
-

 Cannabis2 weeks ago
CBD Vending Machines Face Ban Under New French Restrictions
-
 Crowdfunding2 days ago
Sustainable Restoration of the Haus Hövener Garden in Brilon