Featured
Stock market: Are these indicators for a bubble in late 2019?
There are some indicators that the stock market could head to a larger bubble next year compared to the two market crashes before.

The broader stock market via the S&P 500 finally broke to new highs in August while they drifted insignificantly lower on Wednesday.
And as Adam O’Dell recently commented, that typically means substantially higher highs ahead… like 13 percent plus.
What does this mean for my great crash forecast?
Well, my favored scenario right now, with the strong tax cuts Trump handed us, is that the great bubble peak comes in late 2019, not now.
There are also many indicators to support this, including my new 90-year “Great Reset and Bubble Buster Cycle,” which Andrew Pancholi, my co-author on Zero Hour, first suggested to me. I have since found more reasons to get serious about its importance.
It’s a cycle that brought us the two greatest resets since the Industrial Revolution: the first in 1873 to 1843, the second from 1929 to 1933.
But there are some indicators that suggest the possibility that markets don’t go a lot higher before they peak. The more trusted indicators of the past may not work that well now that massive government intervention has turned everything upside down. Markets are “not so free” anymore!
In the September Boom & Bust issue, I discuss both scenarios and talk about the potential of a surprise crash just ahead. Let’s explore that a little now.
Bigger than before, but not imminent
The Smart Money Flow Index strongly suggests that we’re heading toward a larger crash than the prior two, but it’s not necessarily imminent. They have not been buying into the rally of 2018!
Goldman Sachs has a Bull/Bear Sentiment indicator that is now at an extreme 75 percent bullish reading. It hit a 70 percent-bullish level near the 2007 top and 72 percent-bullish level near the 2000 greater bubble top.
Both of these indicators warn of a major top coming, not a minor one.
But I’ve been warning this for years now, so this is nothing new!
Really, the question is: WHEN?!
There is a nearer-term indicator warning of at least a minor correction ahead, even though most stock indices have made new highs. This could just be another correction on the way up… but also, if it continues to build, it could be another warning of the larger crash ahead.
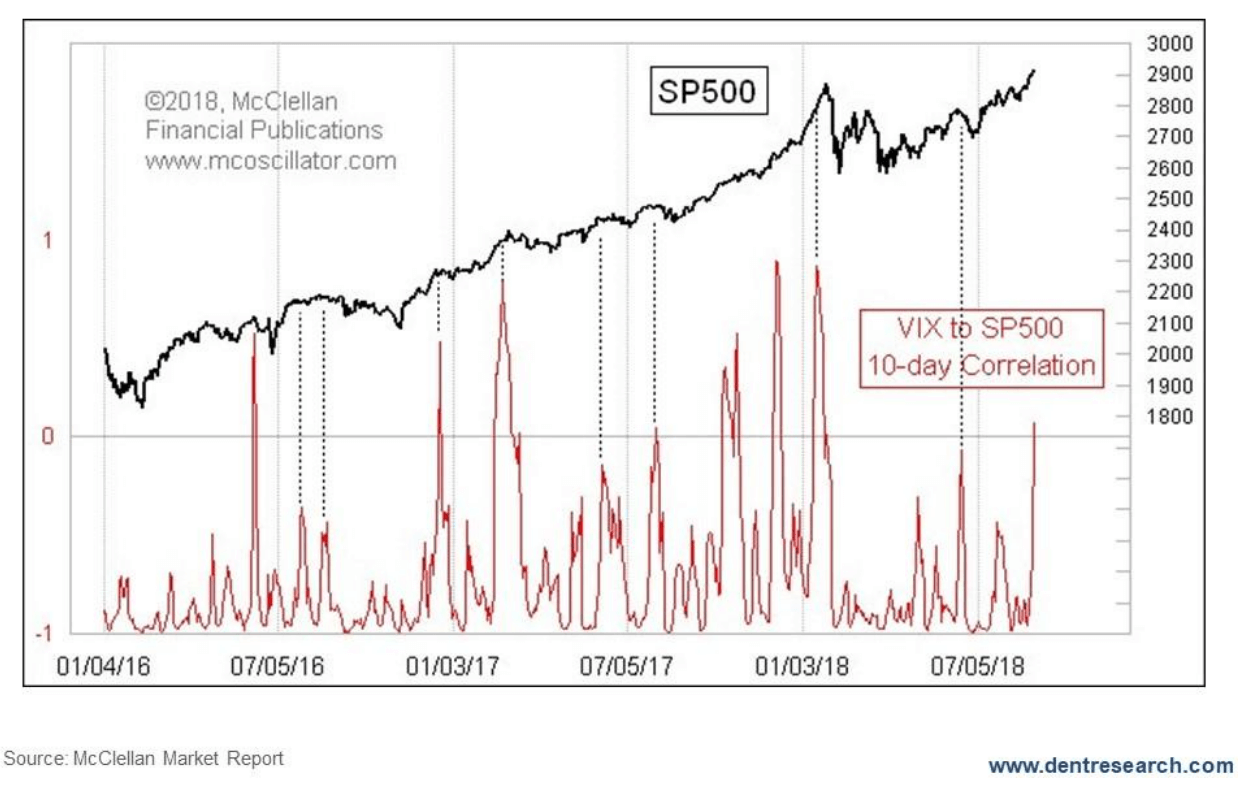
When stocks make new highs, the volatility indicator (VIX) tends to make new lows. When new lows in the VIX don’t confirm new highs in stocks, that is a divergence that suggests some level of correction is coming.
We’re seeing this divergence “starting” to form now, as the chart shows.
© Harry Dent
Most analysts typically look at periods when this happens, but Tom McClellan of the highly respected McClellan Oscillator indicator, has come up with a better way to measure this divergence (and how it builds) more directly and obviously.
When his 10-day Correlation Indicator spikes up, it means lower volatility in the smart-trader options market is NOT confirming higher stock prices.
But, as you can see in the chart, such a counter market trend tends to build typically over three, or even four surges before it peaks, and stocks finally correct.
We’re only in the second surge right now. That’s why I emphasized “starting” to form before.
Possible triggers
My overall reading of these indicators (and more) is that we have at least a minor setback just ahead. But my more bullish scenario still favors Adam’s historical analysis of a near 15 percent rally ahead, well into 2019, a rally that could see the Dow hit as high as 30,000!
But we can’t ignore Trump’s political meltdown and legal storm or the trade wars. They’ll impact the markets… and maybe now, much sooner than later.
In this manipulated, un-free market, it’s going to take a few more months to get clearer indications on likely outcomes—especially after the mid-term elections. That’s why this is the theme of my presentation at this year’s Irrational Economic Summit in Austin, Texas (October 25-27).
It’s also why I discuss this in my September issue of Boom & Bust.
And it’s why I also focus more deeply on that 90-year great reset cycle in my upcoming issue of The Leading Edge, where I look more in depth at the most important issue facing investors: Are we about to peak near term in the final phase of the greatest stock bubble in history… or do we have a more minor correction in the next two to five months and then see the final peak on our now most powerful 90-year cycle around late 2019 (which would create a nearly identical event to the late 1929 to 1932 crash 90 years ago)?
That’s the trillion-dollar question for the U.S. and global economy!
It’s the million-dollar question for your family, investments, and business.
We’re going to be on this like a fly on… and when we see or hear anything that brings more clarity to this, we’ll let you know immediately.
(Featured image by DepositPhotos)
—
DISCLAIMER: This article expresses my own ideas and opinions. Any information I have shared are from sources that I believe to be reliable and accurate. I did not receive any financial compensation for writing this post, nor do I own any shares in any company I’ve mentioned. I encourage any reader to do their own diligent research first before making any investment decisions.


Mollie Expands Across EEA With €350M Investment to Strengthen European Payments Network
Fintech company Mollie has expanded into Croatia and Iceland, achieving full coverage of the European Economic Area. It has committed...


Trulieve NYSE Listing Signals New Era for Global Cannabis Industry
Trulieve’s NYSE listing marks a milestone for the cannabis industry, giving a major US producer access to institutional capital after...


Moroccan Bond Market Shows Mixed Signals as Primary Eases and Secondary Pressures Persist
The bond market shows a mixed trend, with cautious easing in the primary market as the Treasury raises limited funds...


Markets Diverge as Oil Falls, Rates Hold, and Inflation Persists
Markets reacted to a U.S.–Iran MOU and unchanged Fed rates, with oil plunging while energy stocks showed divergence. Equities fluctuated...


Cocoa Market Faces Mixed Trends Amid Rising Supply and Weak Demand
New York cocoa prices edged lower Thursday while London closed higher, with mixed but improving daily trends. West Africa’s main...
 |
|
 |  |
 |
|
-

 Impact Investing2 weeks ago
EU Approves €23B Italian Renewable Energy Plan to Boost Climate Goals
-
 Business10 hours ago
Markets Diverge as Oil Falls, Rates Hold, and Inflation Persists
-

 Biotech1 week ago
Advances in Biomarkers and Targeted Therapies Transform Kidney Care in Autoimmune Disease
-

 Fintech5 days ago
Trade Republic Brings Back Human Support and Launches Customer Council
You must be logged in to post a comment Login