Featured
Stock markets fell for the fourth-consecutive week
Our opening essay takes a short look at the emerging FinCEN scandal that investigates how dirty money is being laundered through the world’s largest banks including Canadian banks. The “chart of the week” focuses on a recent Economist that examines the rise of green energy. It is noteworthy that green energy stocks are up sharply in 2020 while old fossil fuel stocks are down 50% plus.
As if there were not already enough problems. The second wave of COVID-19 appears to be underway as numbers are rising again in Europe and Canada in particular. Numbers are already elevated in India and Latin America and have shown little signs of abating. In the U.S., over 200 thousand are dead and the country is locked in an extremely contentious election where many analysts are suggesting chaos could ensue—and we have an incumbent who is suggesting he may not leave office even if it shows he has lost. The pandemic is threatening to lock down the economy once again. If that happens, then it is bad economic news everywhere with the resultant rising unemployment and bankruptcies. And, following rising unemployment and bankruptcies comes homelessness, social unrest, suicides, and domestic violence, all set against the backdrop of deeply divided societies both culturally and politically.
It is against this backdrop that we learn about the FinCEN files on how $2 trillion of transactions involving dirty money were laundered through some of the world’s biggest banks. The string of leaks over a period of five years describes secret deals, money laundering, and financial crimes. The stories we discover appear to be underreported in the West but are well covered out of Europe. And—no surprise—the stories were leaked through an alternative news site called Buzzfeed News (www.buzzfeednews.com), a news site immediately attacked as being leftist trash news. That the news is being taken seriously and now being reported in mainstream financial journals including the BBC, Financial Times, Bloomberg, and Forbes amongst others belies that assessment. Furthermore, the report was originally released by the International Consortium of Investigative Journalists (ICIJ – www.icij.org).
Who is FinCEN? FinCEN stands for U.S. Financial Crimes Enforcement Network. It is an arm of the U.S. Treasury. A comparable organization here in Canada is Fintrac (www.fintrac-canafe.gc.ca) under the Department of Finance. Implicated are some of the largest banks in the world including HSBC, JP Morgan Chase, Barclays, Standard Chartered, and Deutsche Bank. Even Canadian banks have been implicated including CIBC, TD, RBC, BMO, UBS Canada, and HSBC Canada. Altogether, some 90 banks have been named. The bulk of the country locations for the transactions are in the U.S., followed by Russia, the U.K., China, and Germany. Canada is listed as seventh behind the United Arab Emirates and just ahead of Ukraine. Stories can be found at (https://www.bbc.com/news/uk-54226107) amongst many others.
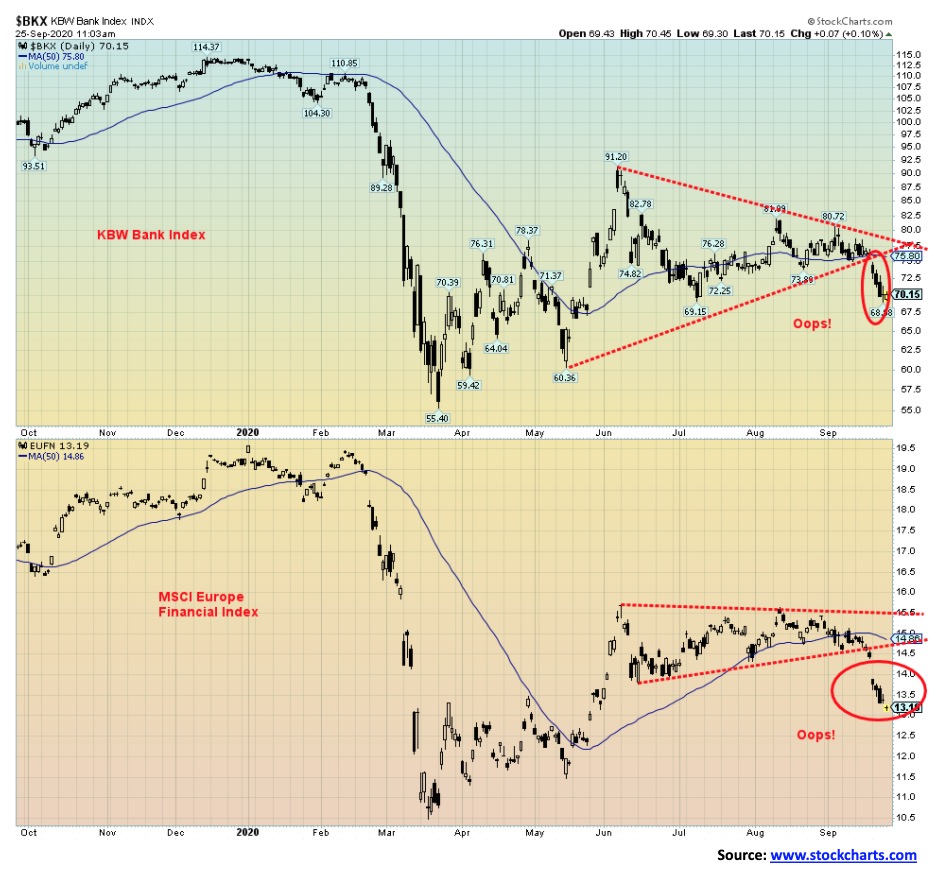
The reaction to the story was pretty quick. Down went the banks. The European bank index gapped down. HSBC Holdings is down almost 50% so far in 2020 and gapped down further after this story broke. Deutsche Bank has fallen 12% in the past three days. JP Morgan Chase is hanging in, down only 7%. The story itself, however, can be quite interesting: see https://www.icij.org/investigations/fincen-files/global-banks-defy-u-s-crackdowns-by-serving-oligarchs-criminals-and-terrorists/ and https://www.bloomberg.com/news/articles/2020-09-21/highlights-from-the-fincen-files-on-banks-suspect-transactions?sref=5lk0w2FC.
It is interesting to note that JP Morgan Chase is close to paying a $1 billion fine to resolve government investigations into the alleged manipulation of metal and Treasury markets. The deal involved probes from the Justice Department, the CFTC, and the SEC. The fine would be a record. JP Morgan may have to admit wrongdoing; however, it is not expected to impact them in any other way. If the FinCEN files go as so many other investigations of this kind have gone over the years, the firms involved may wind up paying large fines and then life goes on. Possibly some lower level people could be charged or outside people as was the case with the former Trump campaign manager Paul Manafort. Manafort’s name has been raised prominently in the FinCEN files.
One point the FinCEN raises even if it doesn’t actually say it is how the banking system has been effectively turned into a giant gambling casino. Banks were at one time in the business of lending. Yes, they still lend but the bulk of their business now comes from capital market operations and trading desks. With the Fed effectively holding interest rates at negative levels almost 95% of the time since 2000 and the Fed expanding its balance sheet through bond purchases, all this money sloshing around has to go somewhere. That “somewhere” is speculation.
It took the Fed 95 years to bring its balance sheet to about $900 billion. That’s where the Fed’s balance sheet was on the eve of the 2008 financial meltdown. Today it stands at over $7 trillion. In its recent statements, the Fed has indicated that not only will interest rates remain at or near zero until at least 2023/2024 but the Fed will also continue with its bond-buying program (QE) of roughly $120 billion/month. That adds up to $1.4 trillion annually. It will take just over two years to reach a $10 trillion balance sheet.
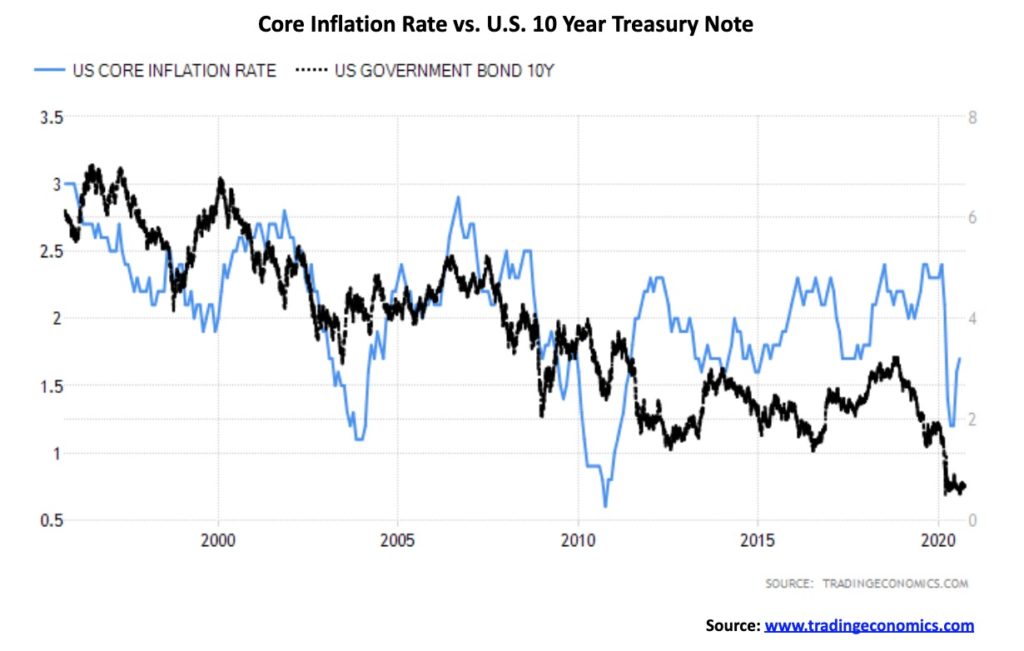
To put that in perspective, personal debt (i.e., mortgages, lines of credit, credit cards, student loans, etc.) has gone up only $3.6 trillion or 21% since 2008 and the financial crisis. The Fed balance sheet is up $6.1 trillion or over 600%. The U.S. federal debt has gone up $16.1 trillion or over 150%. The massive growth in the Fed balance sheet, coupled with negative real interest rates, has failed to reach Main Street but has helped Wall Street to manage their stock and bond portfolios by effectively arbitraging the Fed’s money into speculative assets. Note the latest CPI (core ex food and energy) was up 1.7% in the past year. Effective Fed Funds is 0.9% and the U.S. 10-year treasury note is at 0.68%. As we say—negative real interest rates.
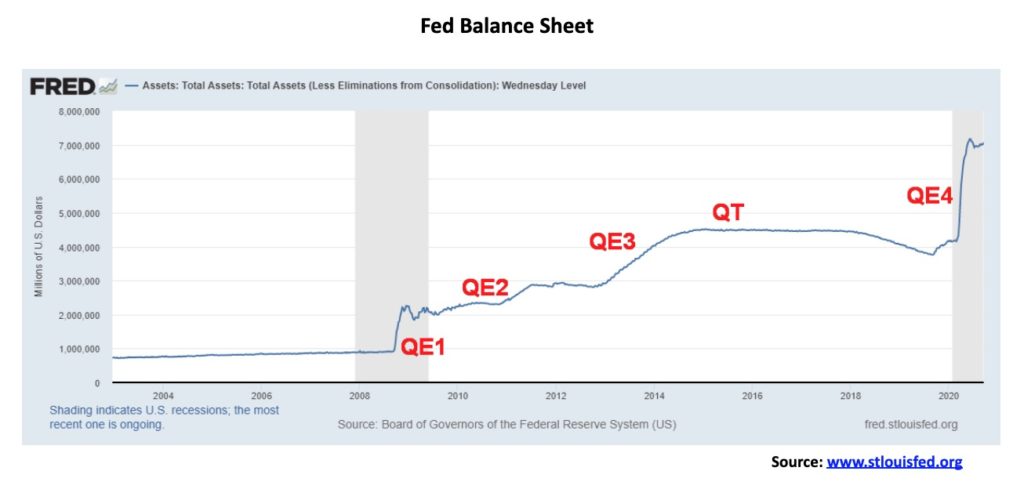
Some call all of this a huge Ponzi scheme waiting to blow up. Others say it is not anything to get too worried about. There will be a vaccine eventually, but maybe not until sometime next year. The Fed is still buying assets but, as the chart indicates, it appears to have slowed somewhat lately even if the Fed hasn’t said anything officially. The battle continues in the U.S. over a stimulus package, but the hoped-for solution is that the economy rebounds. The question is, how many cases and deaths are we okay with while awaiting the economy to rebound? Despite all of the issues for potential chaos out of the election, there are also many who believe the U.S. system will prevail and it will be less problematic than many are predicting. Events like the FinCEN files create a lot of noise but are, ultimately, largely ignored. So, yes, a correction is in the offing and underway but if the election is decided with a relatively peaceful transition, no matter who wins then the markets are likely to explode to the upside rather than fall.
Market and Trends
The battle over green energy and brown energy appears to be no contest. That would bring considerable argument from the defenders of fossil fuels and the naysayers who are arguing that a green world agenda is being imposed on all of us. Energy is, to put it mildly, at the center of both global geopolitics and domestic politics. The battle is fierce, even violent. But, despite the efforts of the naysayers and the defenders of fossil fuels, the battle is most likely already over. Fossil fuels are dying; their world is probably already over. But they won’t admit it. And no, fossil fuels will not disappear completely. There are still those who drive a horse and buggy. Despite everything, there will still be a need for fossil fuels going forward, but their role should eventually become subservient to the emerging green economy.
“Power in the 21st century” is the headline title of this past week’s The Economist (September 19th to 25th, 2020) and their green front page captures the essence of what is going on. Argue with it or not, The Economist has it right and the defenders of fossil fuels and the naysayers of green energy have it wrong. No one, however, said that the transition was going to be easy nor has anyone said that it wouldn’t come without conflict, even severe violent conflict. The defenders and naysayers may even go down gasping their last breath with a sword through their heart but still defending their old world.
Oil has been around for millenniums, but it was only in the past two centuries that oil became the driver of our modern world. And it has been at the heart of driving our economies. But, like empires, eventually they fall, and fall it has. The COVID-19 pandemic has done an extreme number on oil prices. Demand has fallen sharply and prices have collapsed. The Saudis need $70–80 a barrel to balance their budgets. Shale producers and Alberta need at least the same. We needn’t worry about peak oil. The worry is peak oil demand.
Wars have been fought over oil. Coups have taken place because the wrong party came to power in a Middle East oil producer and they wanted to nationalize the oil industry at the expense of the largely British and American oil companies. The West always found a justification for its coups and wars. Would they bother now? Sadly, it still happens or is already happening. There remains the threat of war in the Middle East involving the Middle East oil producers particularly Iran.
A reminder that two-thirds of the world’s oil still goes through four key choke points: The Strait of Hormuz, the Strait of Malacca, the Suez Canal, and the Strait of Bab el-Mandeb (Horn of Africa). There are also contentious pipelines (including gas pipelines): Keystone, Transmountain, Nord Stream, and the unbuilt pipelines from Iran to Europe or Qatar to Europe through Syria. The U.S. may now be the largest producer of oil and is even exporting again, but it still imports as well. As for gas, the world’s largest producer and reserves are Russia and Iran. Both are also major oil producers and hold major reserves. So, what drives all the global geopolitical conflicts?
Yes, fossil fuels still provide 85% of our energy needs. But bringing down emissions is becoming more important. And the cost of green energy is coming down sharply, making it more competitive. As The Economist article notes, brown energy is dirty, accounting for two-thirds of greenhouse gas emissions, and the pollution kills four million a year, mostly in the world’s mega-cities in emerging economies. It creates political instability— Saudi Arabia, Iran, Iraq, Venezuela, and Syria. Many, including Alberta in our own backyard, have failed to restructure their economies or they argue to continue the old world and blame others for their problems. Many Western leaders who are naysayers have tried to tie the emerging green energy industry up in knots or eliminate it so as to continue to curry favour with the oil producers.
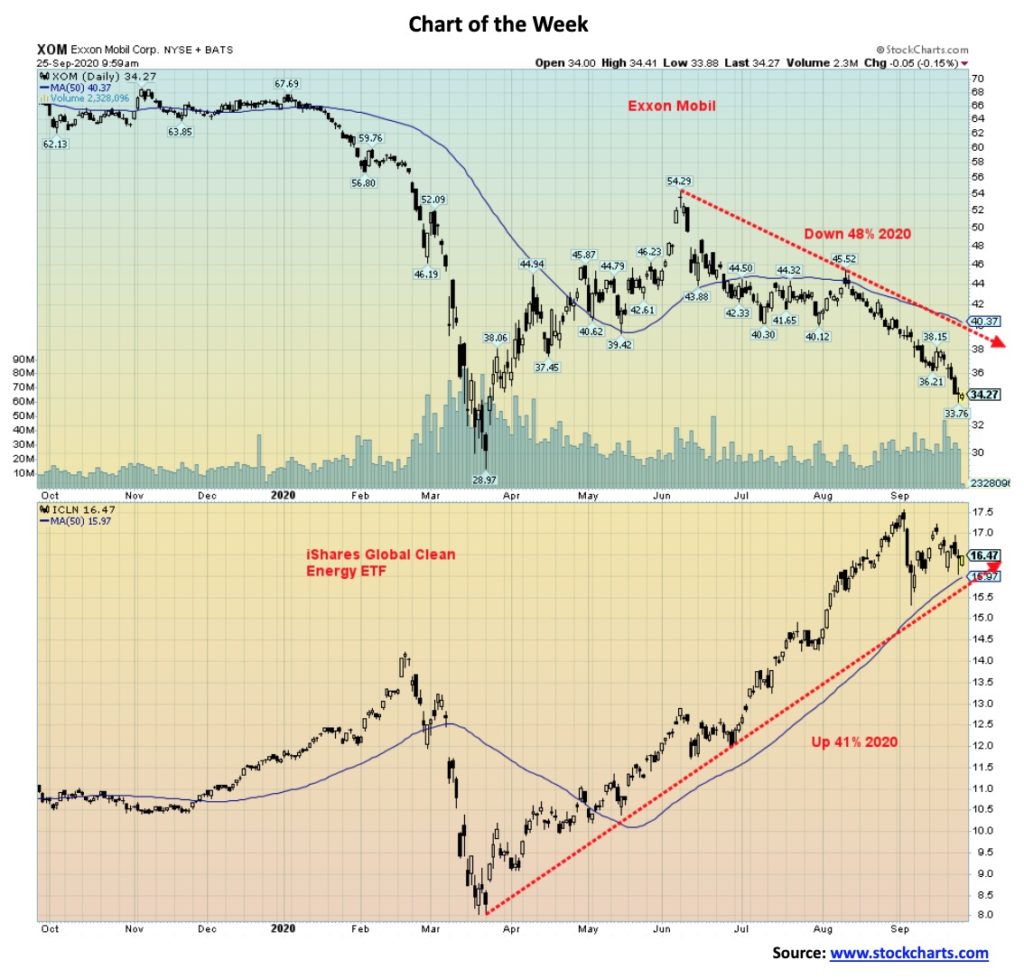
Exxon Mobil (XOM), once the world’s largest company was recently booted from the Dow Jones Industrials (DJI). Exxon was a mainstay since 1928. At some point, a green energy company may replace it. Exxon is down 48% in 2020. The Global Clean Energy ETF (ICLN) is up 41%. Many individual green companies are up over 40% in 2020 while the energy indices are down over 45% and the broader market is also down. While the West dithers, argues, and fights, China is emerging as a leader in green energy. They produce 72% of solar modules, 69% of lithium-ion batteries, and 45% of wind turbines. Europe has huge developers of solar and wind farms.
The Economist concludes, “The move to a new energy order is vital, but it will be messy.”
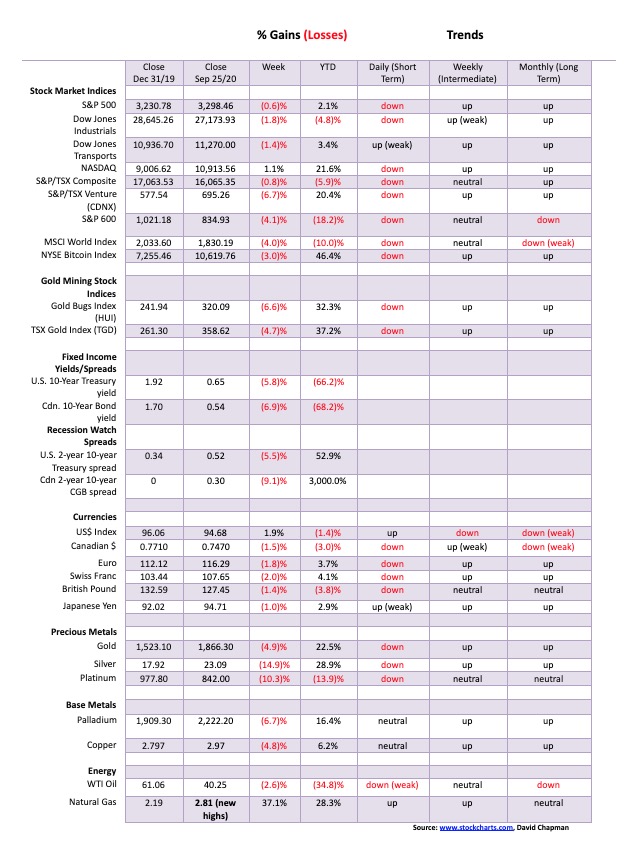
For the fourth consecutive week stock markets fell. The daily short-term trends have now officially turned down. However, while weakened, the weekly and monthly trends remain to the upside. This past week the S&P 500 fell 0.6% but is holding to the plus side on the year, up 2.1%. Not so for the Dow Jones Industrials (DJI) that fell 1.8% and is now down 4.8% on the year. The Dow Jones Transportations (DJT) fell 1.4% but is diverging with the DJI and is actually up 3.4%. The NASDAQ remains up 21.6% so far in 2020, thanks to the FAANGs and some other big high-tech stocks and it bucked the trend this past week, gaining 1.1%. The small cap S&P 600 fell 4.1% and is down 18.2% on the year. The underperformance of the small cap market underscores how dangerous this market remains. Bitcoin also fell, losing about 3.0%, but remains sharply up on the year by 46.4%. The MSCI World Index lost 4.0% and is down 10.0% in 2020.
Elsewhere, the TSX Composite fell 0.8%, while the TSX Venture Exchange (CDNX) was off 6.7% but remains up 20.4% on the year. In the EU, the London FTSE was down 2.6%, the Paris CAC 40 dropped 5.0%, and the German DAX was down 4.9%. Europe is suffering from a resurgence of the coronavirus and restrictions are once again being seen. That has stock markets falling and funds fleeing to safety, primarily in U.S. treasuries. In Asia, China’s Shanghai Index (SSEC) dropped 3.6% and the Tokyo Nikkei Dow (TKN) was down a small 0.2%. Japan’s stock markets are generally holding in better than others despite being down 1.9% on the year. China’s main stock market is up 5.6% so far in 2020 as the coronavirus numbers remain under control in Asia.
It seems that dip buyers were out in force on Friday as the week ended with a gain. But that wasn’t enough to offset losses from earlier in the week. The big six (FAANGs + Microsoft) still dominate the market as all except Google were up on the week. That helped drag the NASDAQ into positive territory for the week.
The U.S. is seeing a resurgence of the coronavirus, particularly in the U.S. heartland (see comments under our charts on the COVID-19 cases and deaths). That is weighing on the market, particularly with the threat of further restrictions as is the case in Europe. As well, there is continued disappointment that no stimulus package is forthcoming. However, we’d be surprised if there were one before the election. But then maybe the logjam will break to try and save Republican Senate seats. A brutal battle is sure to ensue over the appointment of a new Supreme Court judge to replace Ginsburg but the reality is, unless there are at least 4–6 defections from the Republicans, they have the numbers to confirm whoever Trump nominates. Controversy continues to swirl around the upcoming election with Trump refusing to acknowledge he’d leave office if he lost and possible voter mail-in fraud coming through a gutted post office. As well, there have been reports of blockages and intimidation as long lines form for early voting. The election continues to be the most contentious, potentially violent one ever and the outcome is unknown. Calls are for the Fed to provide the stimulus but the reality is that’s not the Fed’s job. The Fed continues its bond buying, although recently it appears to have slowed and that too is weighing on the stock market.
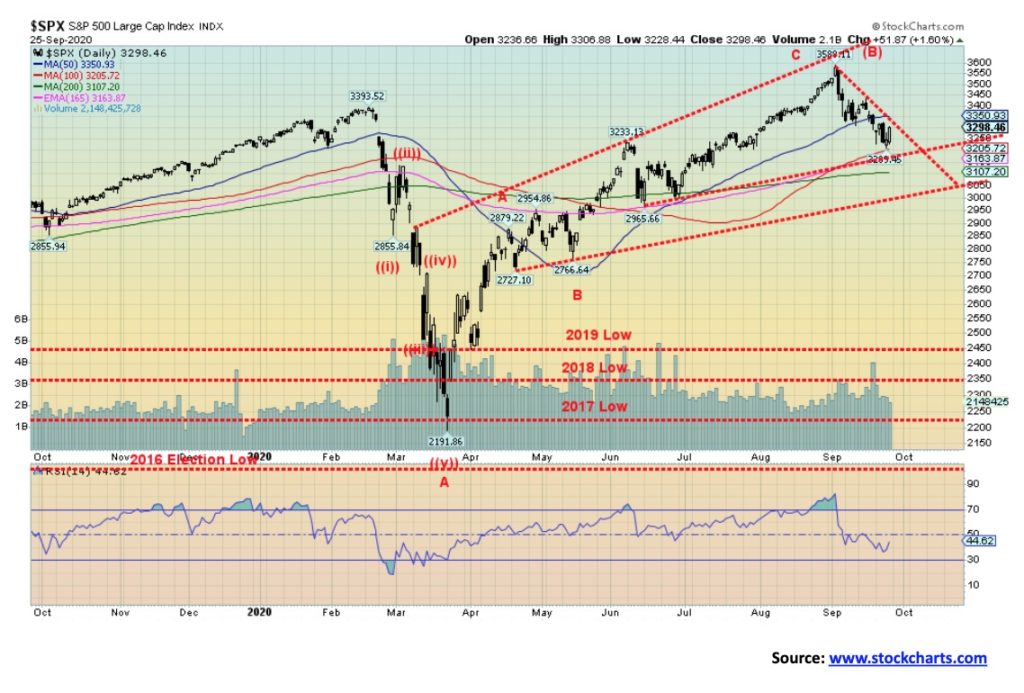
The S&P 500 broke down under the 50-day MA and the 13-week MA this past week, signaling a potential drop to the 100-day MA (currently at 3,205) and the 40-week MA (currently at 3,103). There is considerable support down to between 3,000–3,100. That level appears to be the minimum target for this drop. The real danger gets underway if the market starts breaking down under 2,950/3,000. The market is not sufficiently oversold as yet to signal a potential bottom nor is sentiment sufficiently low enough to signal a potential low. But a rebound could continue into the coming week. Resistance would come in at 3,350 with an outside shot at reaching 3,400. Only above 3,500 could we signal that the decline is over and potential new highs lie ahead.
We sit perfectly in the September/October swoon period with potential lows coming in October but, given the election, a low in November is more likely. If the election is basically decided with one side conceding, the stock markets are liable to stage a strong rally regardless of who wins. It is unknown what might happen if neither side concedes and we embark on law suits. Some have suggested this is why it is so important for Trump’s Supreme Court nominee to be confirmed as, like 2000, the election could wind up at the Supreme Court. Based on everything we have seen, however, neither side appears prepared to accept a victory from the other side, leaving it in the hands of the candidates themselves to do the right thing and concede as has happened for over 200 years of presidential elections.
Follow-through on this week’s rebound on Friday could target up to 3,400 if the S&P 500 can break above 3,350. But downside targets remain at 3,100 and 3,000. Only below 3,000 does the market become more dangerous, setting up the potential for a mini-crash.
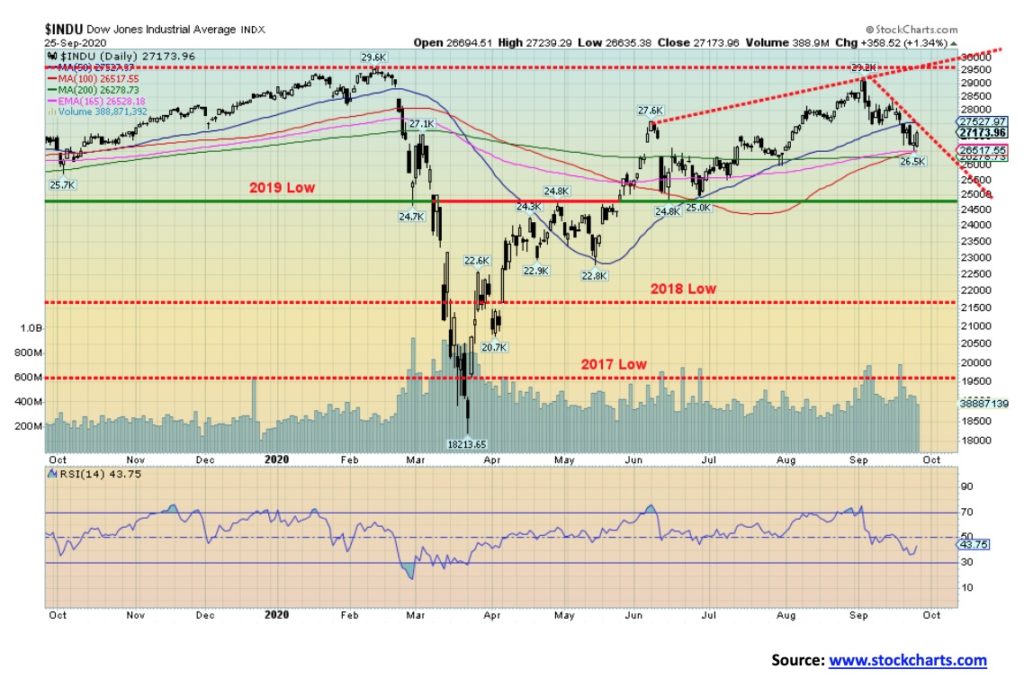
The DJI rebounded this week off the 100-day MA and the 165-day EMA. This was after falling below the 50-day MA earlier in the week. The DJI suffered a 1.8% drop this week, underperforming other markets. The low so far for the DJI Is 26,537. We have potential targets down to 24,500–25,000. A breakdown under 24,500 would be dangerous and could signal the start of mini-crash. There is resistance up 27,500 but above that level we could reach 28,000. Only above 28,400 could the DJI start an assault on the all-time high of 29,163. Like the S&P 500, we could see Friday’s rebound carry into the coming week.
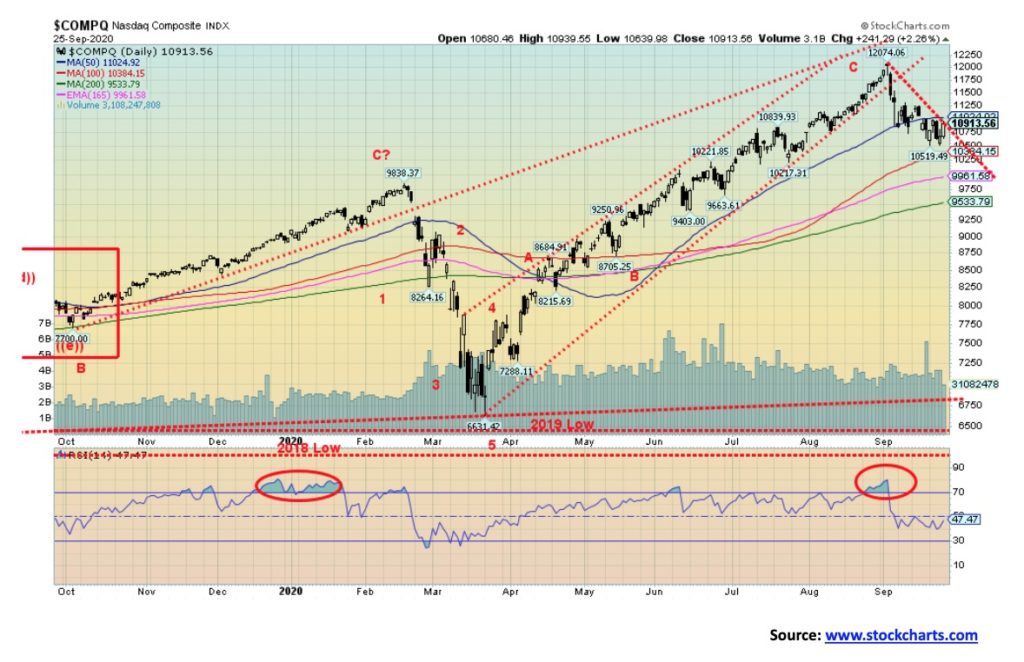
Thanks to the FAANGs plus Microsoft, the NASDAQ gained 1.1% this past week. Facebook was up 0.9%, Apple jumped 5.1%, Amazon was up 4.8%, Netflix 2.8% (who cares about the cancellations because of Cuties), and Microsoft gained 3.7%. Google fell 1.0% while Tesla suffered a big setback, off 7.9%. Despite the gain on the week, the NASDAQ still managed to break under the 50-day MA but fell short of testing the 100-day MA (10,384). A test of the 200-day MA would still not be a surprise (9,500) with a range between 9,500 and 10,000. The NASDAQ is nowhere near being oversold, giving it further room to move lower. The NASDAQ only becomes more dangerous if it were to break down under 9,500. The key remains the big six. If they can continue to hold up, the market is not about to fall. But if they falter, they will take everybody else down with them.
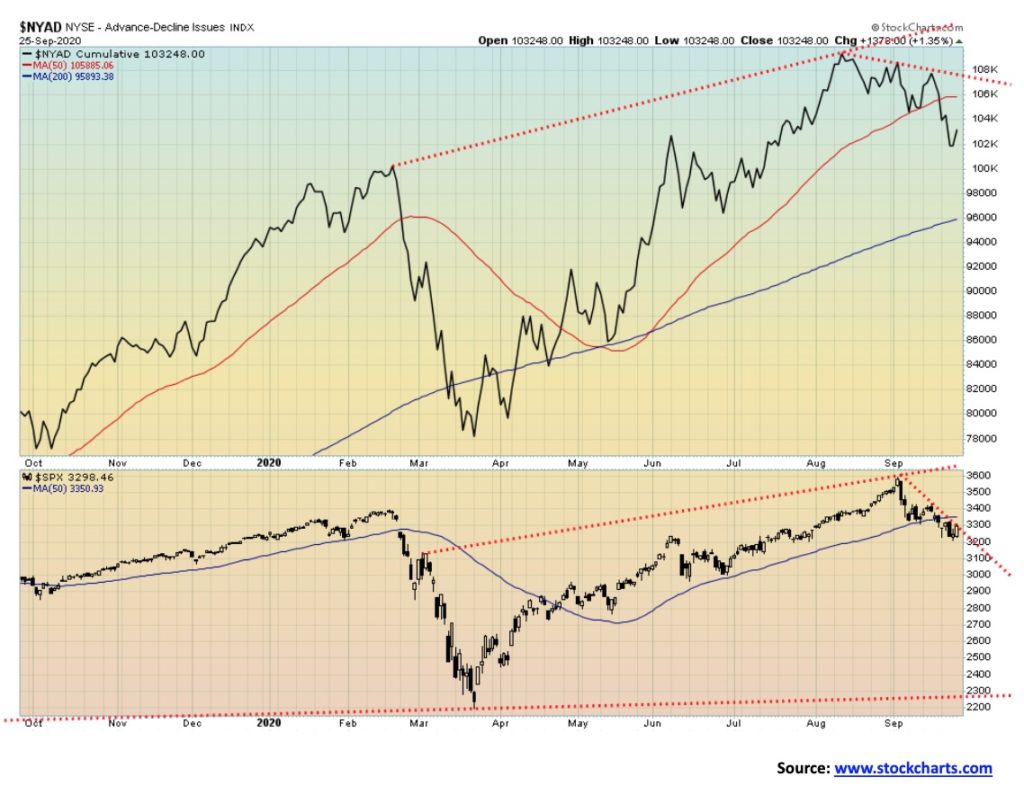
We don’t see any clues here with the NYSE advance-decline line. The AD line is falling along with the S&P 500 and both are below the 50-day MA. We await divergences for clues to a potential bottom.
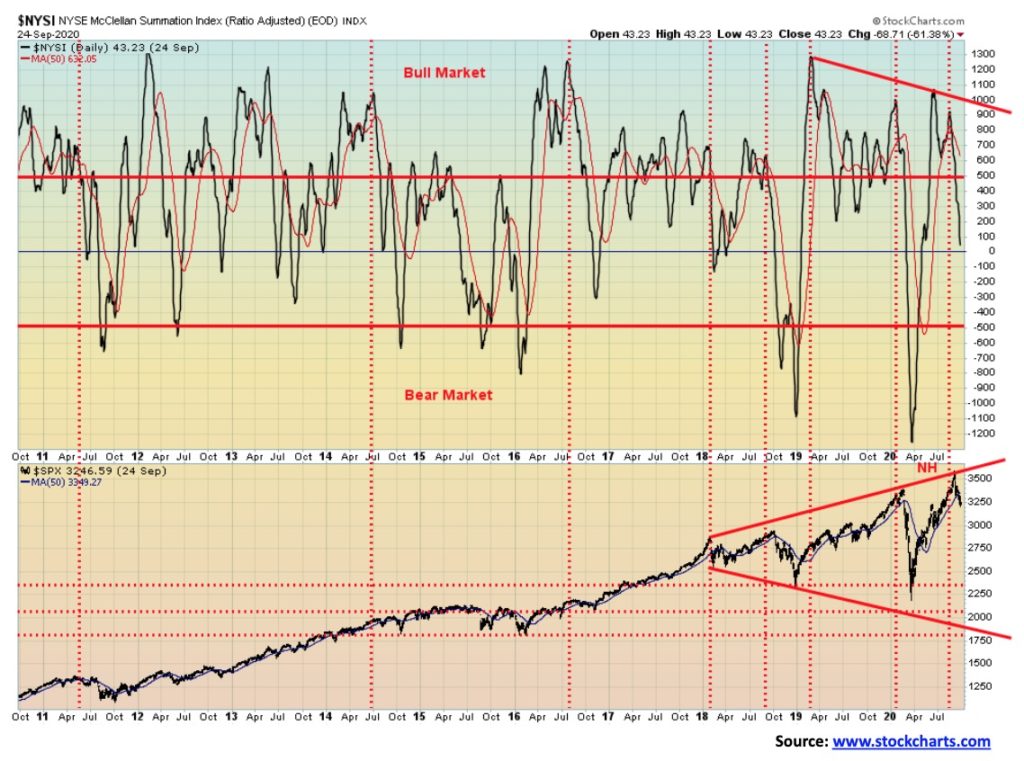
The McClellan Summation Index (ratio-adjusted), known as the RASI, has fallen to just below 100 but remains above 0. This is pretty neutral territory. We do note that the RASI was continually making lower highs even as the S&P 500 kept rising to new all-time highs. That was a clue the market was out of line and a potential top and fall was in the offing. We note as well that the put/call ratio remains in neutral territory. We’ll show it again when puts grossly outnumber calls. That is currently not the case.
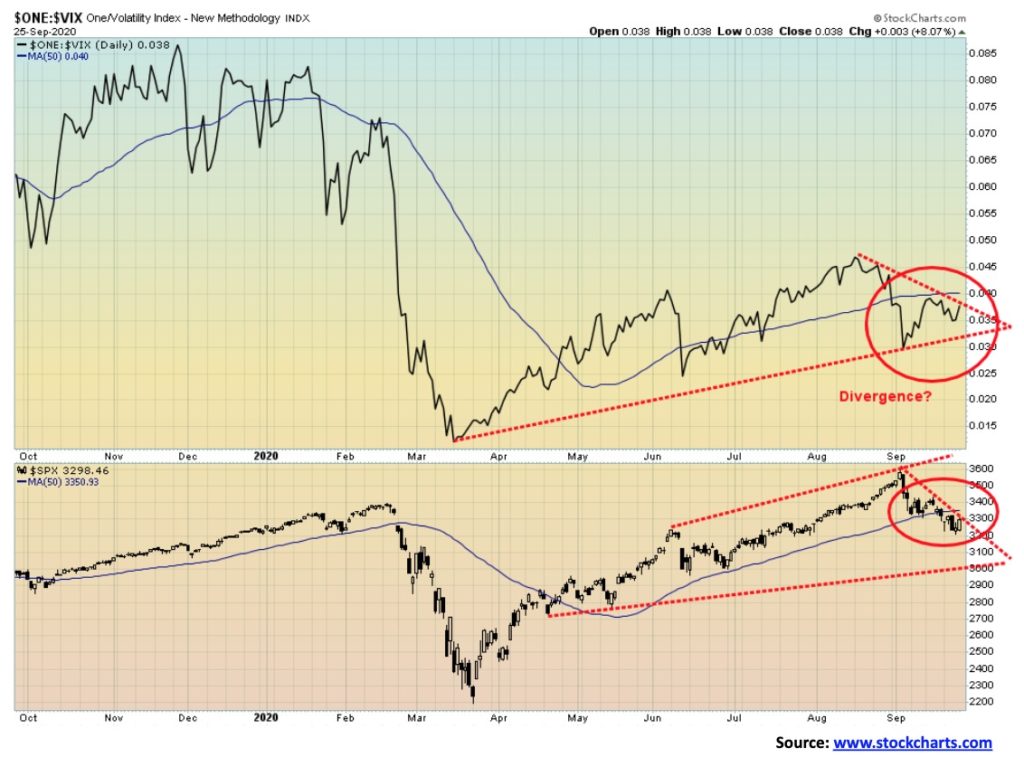
We have a divergence here between the VIX volatility indicator and the S&P 500. Note the S&P 500 was making new lows but the VIX was not. This is the only real divergence we have seen. But it could still correct itself with the VIX making new lows with the S&P 500. However, it should be noted.
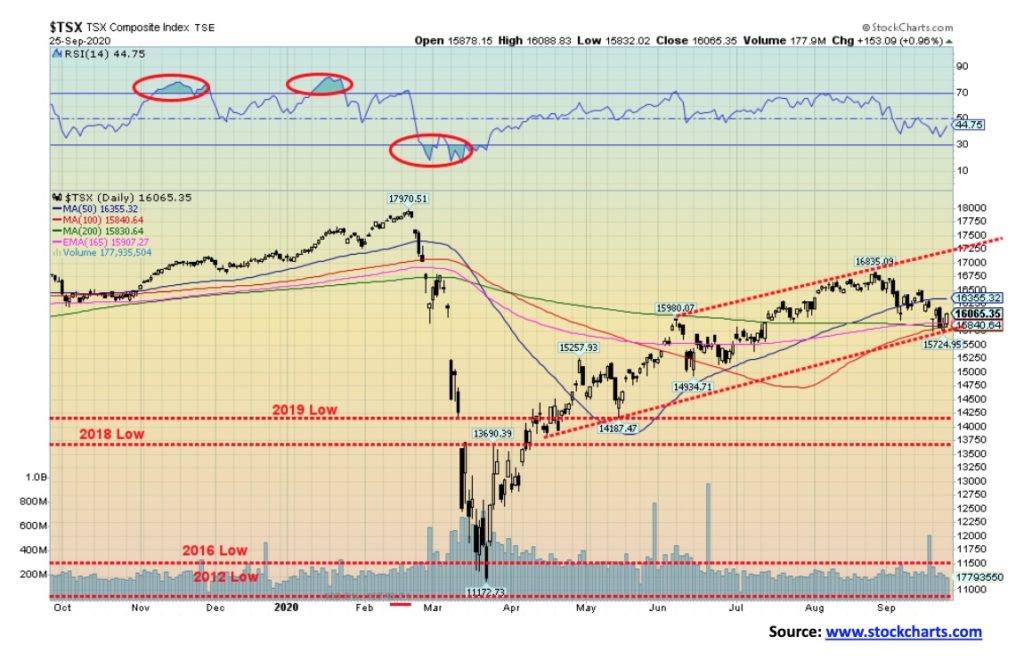
What a mixed week for the TSX Composite. The TSX fell 0.8% this past week but the sub-indices were all over the map. The TSX Venture Exchange (CDNX) took it on the chin, losing 6.7% but remains up 20.4% on the year. We say the sub-indices were all over the map because they were. Eight of the fourteen sub-indices were down on the week led by Health Care (THC), off 9.4%. But Health Care isn’t a big portion of the TSX Composite. However, Energy (TEN) is and the TEN fell 6.7%. Golds (TGD), Materials (TMT), and Metals (TGM) also suffered, losing 4.7%, 5.4% and 5.1% respectively. Financials (TFS), another large component, lost 1.7%. Given all that, it is surprising the TSX didn’t lose more. But Information Technology (TKK) gained 4.1%, and Consumer Discretionary (TCD) was up 1.1%. However, the big surprise was Consumer Staples (TCS) gaining 4.0% and rising to new all-time highs. Got to love those grocery stores. The TSX Composite is resting on support so Friday’s rebound was a welcome respite. A bounce could be in the offing but resistance comes in at 16,350–16,400. The TSX has fallen to test its 100- and 200-day MAs so a breakdown now below 15,725, the recent low, could prove dangerous. Right now, the best strategy appears to be to stick with grocery stores. We all have to eat. Our former favourites of Golds and Metals are going through a corrective period.
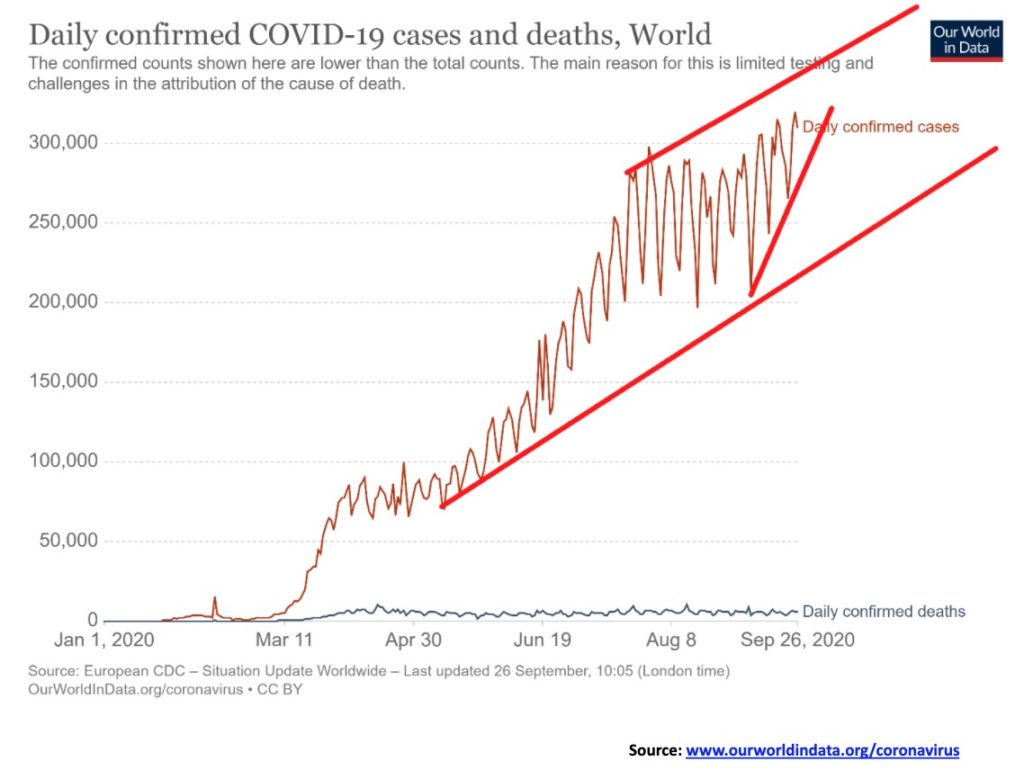
The world’s COVID-19 cases are now beginning to rise above 300,000 daily. If that is correct, we could see another 28 million cases by year end, bringing the total to over 60 million. Deaths could rise as well to upwards of 10,000/daily from the current level of 5,300/daily. Even staying where it is implies another 500 thousand dead by year end, bringing totals to 1.5 million. It appears the second wave is slowly getting underway and it probably hasn’t peaked yet. We have now passed one million deaths. The death/cases rate remains around 3%. That is well above the common flu rate of 0.1%.
Coronavirus Pandemic September 27, 2020 15:43 GMT
Number of Cases: 33,177,416
Number of Deaths: 1,000,202
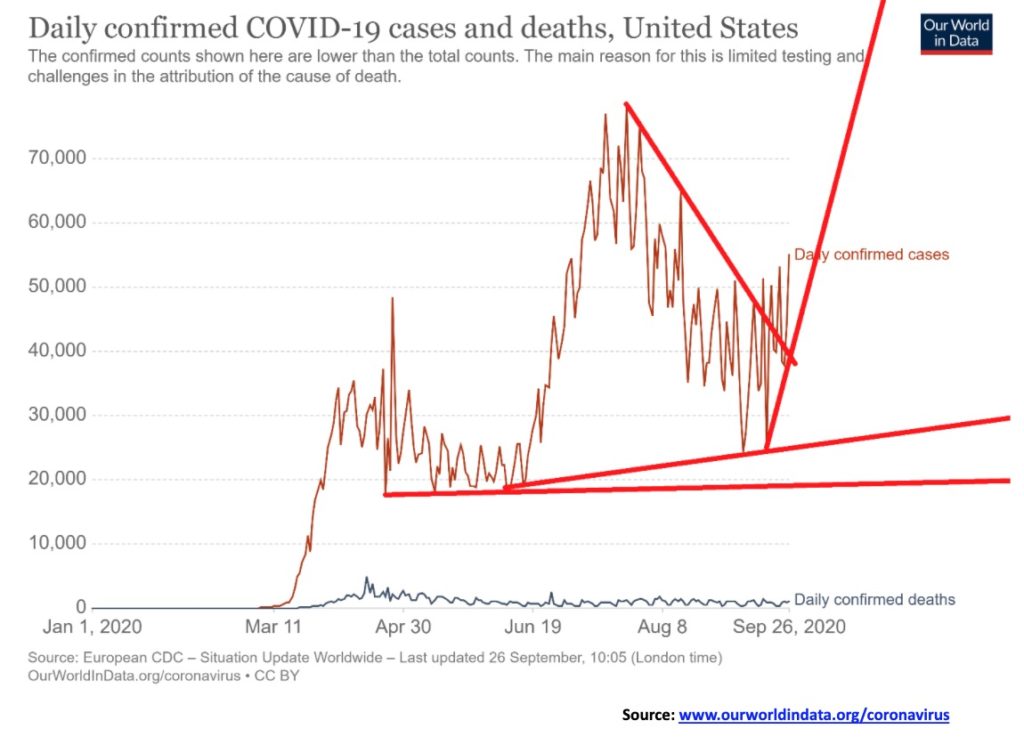
The number of cases in the U.S. is once again shooting over 50,000/day after falling at one point to under 30,000/day. Texas, California, and Florida are leading the way in daily cases. But the big rise is being seen in the heartland like Alabama, Mississippi, Tennessee, Missouri, North Carolina, Georgia, Utah, and Oklahoma. All just in time for the election, with governors who refuse to acknowledge the dangers and a powerful minority who protest against masks and social distancing. If the breakout is correct, the U.S. could soon rise back to the previous peak of over 60,000–70,000 cases daily and even to new highs of over 100,000/cases daily. Deaths are staying consistent between 1,000–1,200, but some are suggesting they could rise to 3,000/day by year end.
Coronavirus Pandemic September 27, 2020 15:43 GMT
Number of Cases: 7,294,032
Number of Deaths: 209,236
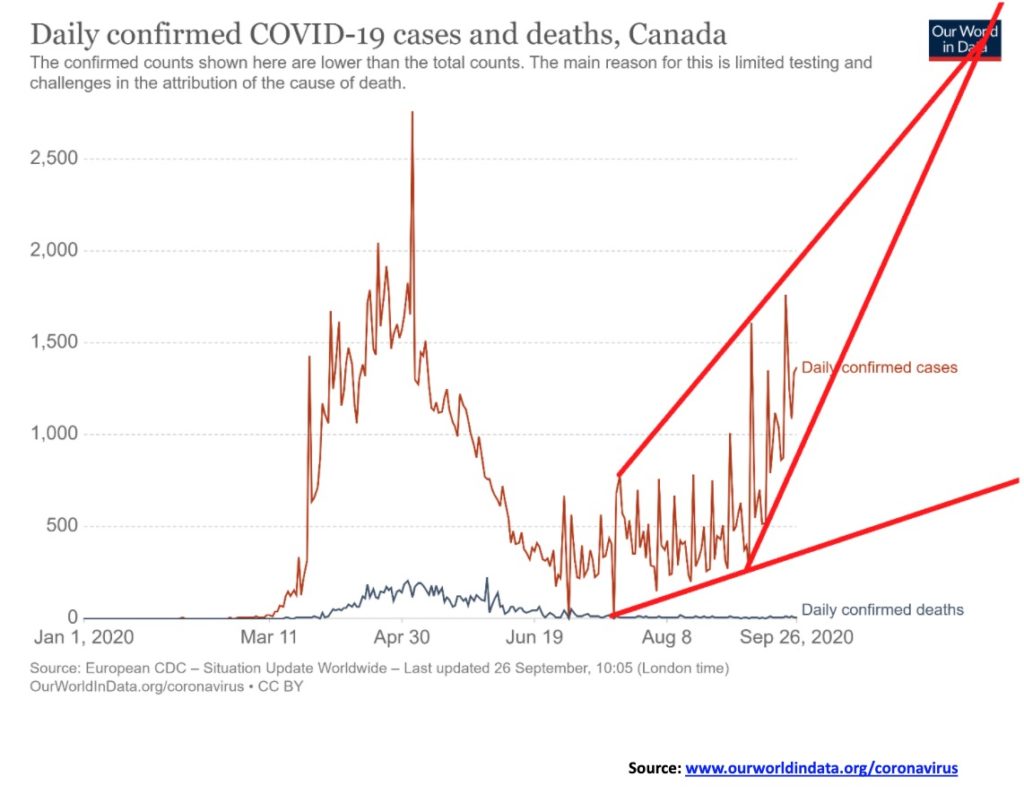
Canada’s COVID-19 numbers are rising once again. On September 22 there were 1,700 new cases, whereas, back in August, we were at levels of around 200–500 per day. That’s not good and is sending the authorities scrambling trying to determine whether we will shut down once again. Shutting down once again would be economically devastating. But the lockdowns in March/May did work in bringing the daily cases down sharply. While we could argue that Canada appears to be forming a rising/ascending wedge it still has considerable room to rise before it hits the apex. That might not come until December/January and we could once again see over 2,000 cases/day. Deaths are, however, remaining low as the cases are being seen more frequently outside the long-term care homes that dominated the first wave.
Coronavirus Pandemic September 27, 2020 15:43 GMT
Number of Cases: 153,058
Number of Deaths: 9,268
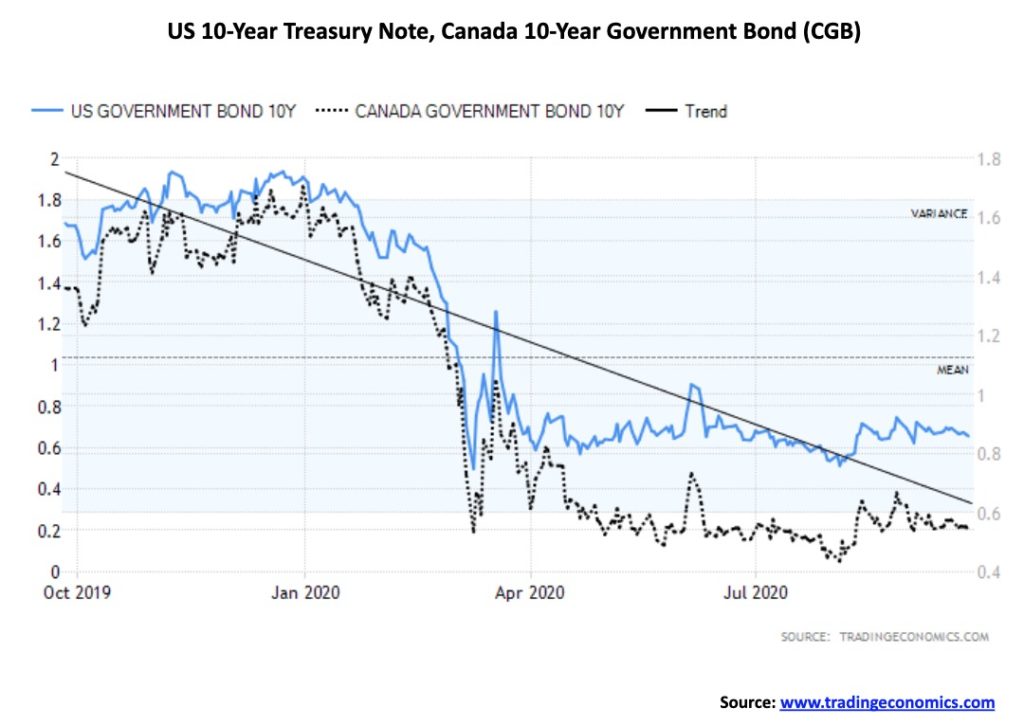
With Europe potentially going into lockdown mode once again because of a rise in coronavirus cases, there has been a rush of funds out of Europe into U.S. treasuries. That in turn is putting upward pressure on the U.S. dollar and pushing yields down further. The 10-year U.S. treasury note fell to 0.65% this past week, down from 0.69%. In Canada it was the same as the 10-year Government of Canada bond (CGB) fell to 0.52% from 0.55%. Despite increased borrowings on the part of both the U.S. and Canadian governments, the costs of borrowing just keep on falling. Of course, it helps that the bulk of the bond purchases are being made by the Federal Reserve and the Bank of Canada. With the Fed declaring that interest rates will remain at or near zero for the next few years and the bulk of purchases being made by the central banks, the potential for interest rates to rise remains very low.
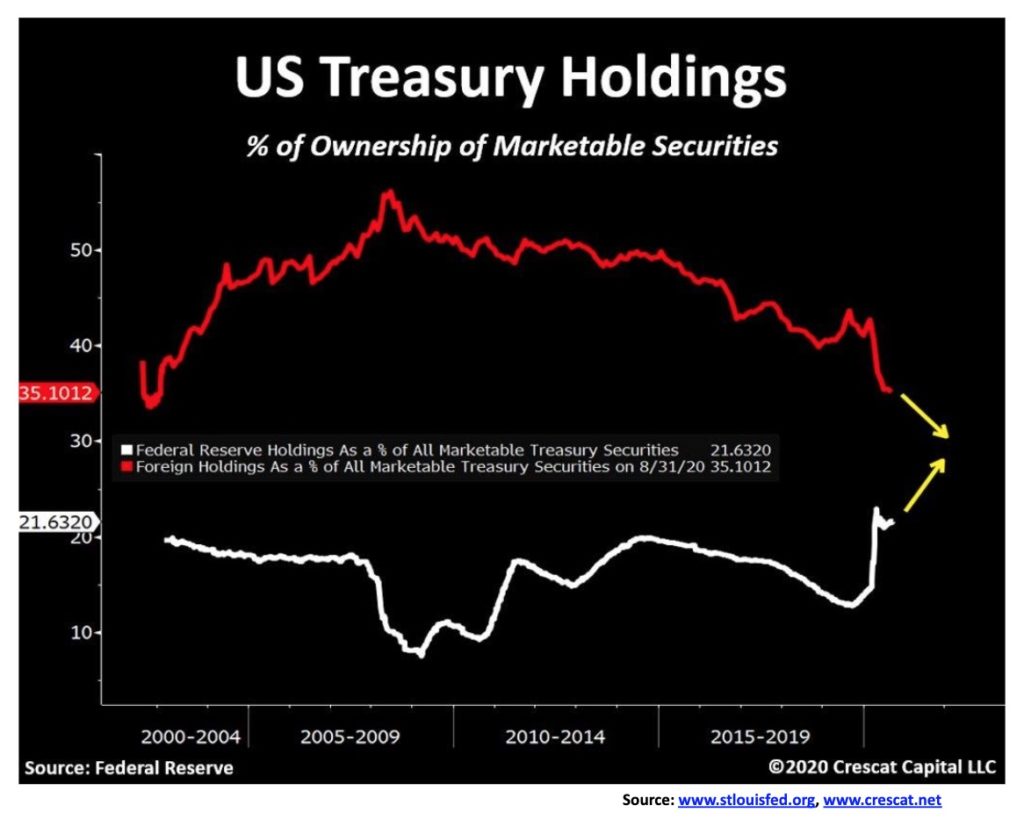
We found this chart at Crescat Capital (www.crescat.net) and found it interesting enough to post. According to the U.S. Treasury and Federal Reserve, foreign holders of U.S. treasuries at the end of July 2020 were at $7,087.2 billion, up $287 in the past year. However, U.S. treasuries outstanding at the end of July 2020 were $26,525 billion, up $4,502.6 billion. Foreign holders purchased a mere 6.3% of the treasuries issued. However, U.S. treasuries held by the Federal Reserve rose from $2,080.7 billion to $4,293.6 billion up 2,212.9 billion, suggesting the Fed purchased almost 50% of the issues over the past year. The Fed now holds 16.2% of all U.S. treasuries vs. 9.4% a year ago. The chart above focuses on marketable securities whereas our numbers look at the total amount of U.S. treasuries outstanding. Still, it is remarkable to learn the Fed is purchasing the bulk of the debt being issued. We call it monetizing the debt.
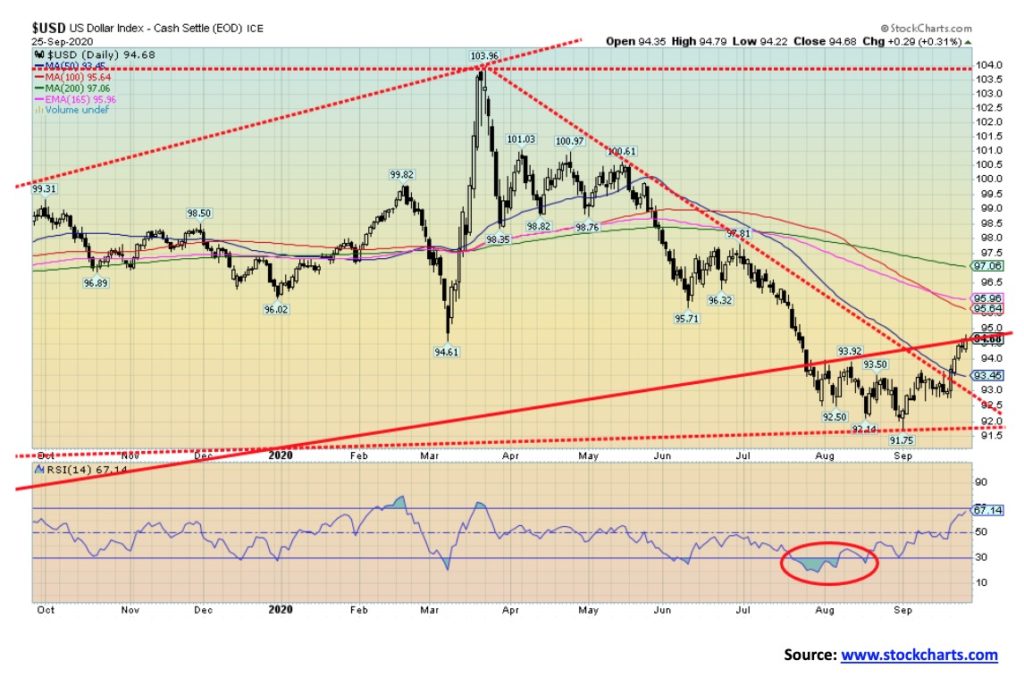
The US$ Index broke to the upside this past week, taking out its 50-day MA. It appears to be headed for a test of the 100-day MA and 165-day EMA between 95.75–96. In the interim, the US$ Index ran into resistance from an old support line near 94.70 (high this week was 94.80). The US$ Index had an excellent week, rising about 1.9%. The currencies all took it on the chin with the euro down 1.8%, the Swiss franc off 2.0%, the pound sterling down 1.4%, the Japanese yen down about 1.0%, and the Cdn$ down about 1.5%. The U.S. dollar was helped by the drop in the stock market and a rush into U.S. treasuries as the markets became nervous about the rising coronavirus numbers, the threat of another shutdown (that impacted the European markets as funds rushed out), and the potential for chaos in the U.S. election. The US$ Index might have hit a temporary high here so a pullback to test the 50-day MA near 93.45 would not be a surprise. A firm breakout above 95 would send us on our way to 96. The US$ Index is not as yet overbought so there is room to move higher. And concerns in Europe of another lockdown are pushing funds out and into U.S. treasuries.
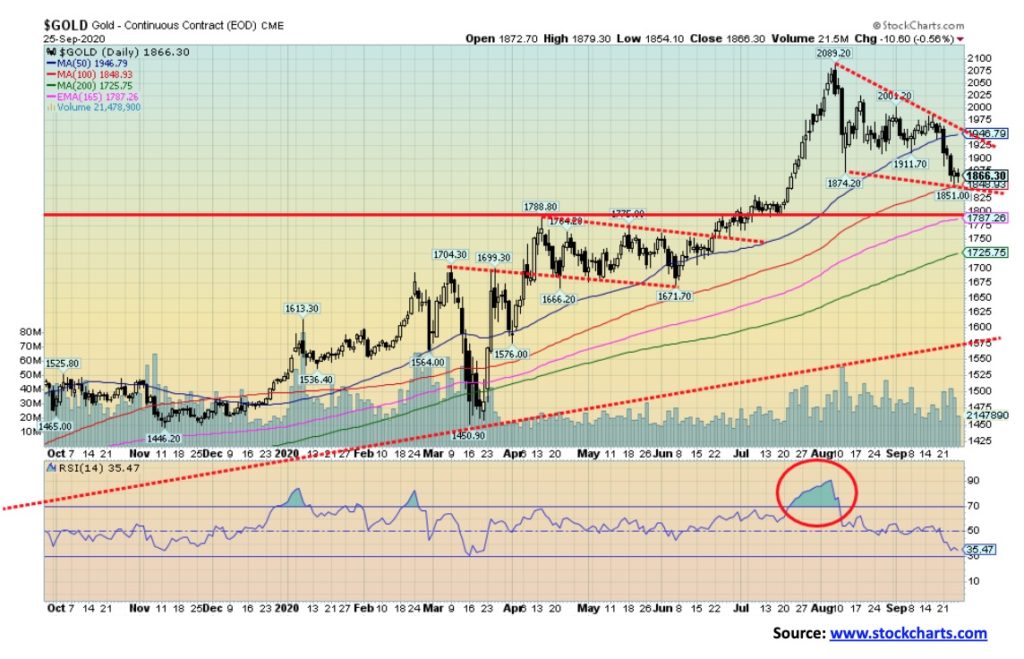
It was a miserable week for the precious metals (PMs). Gold fell almost $100 or 4.9% while silver dropped $4 or 14.9%. Platinum got killed as well, down almost $100 or 10.3% while palladium was off 6.7% and copper down 4.7%. The gold stocks also took it on the chin but, as we note in our commentary under the TSX Gold Index (TGD), the drop wasn’t as bad as it could have been. While the drop in gold prices was not pleasant there are some positive takes. First, the pattern that has developed could be a classic ABC pattern with the A wave down to $1,874 the B wave up to $2,001 and the C wave down to the low this week at $1,851. The bulls would probably be happy with that. But the triangle pattern that developed at the recent high suggested that a break of $1,910 could see gold fall back to potential targets at around $1,700. The 200-day MA is currently at $1,725. A test of the 200-day MA in a bull market is not unusual. Thursday’s low at $1,851 found support at the 100-day MA ($1,849) so that was encouraging. Clearly, however, a good break of $1,850 could swiftly take us down to $1,785/$1,800. Under that level, the decline to test the 200-day MA would be underway. The breakdown started at around $1,950 so we’d need to regain that level at minimum to suggest that a low could be in. Above $1,965, gold could be breaking out, but reality is we’d want to see gold back above $2,000 to suggest a move towards the previous high. Above $2,040, new highs are probable.
We do see bearish forecasts out there for gold and silver so we never want to dismiss them. Obviously, a breakdown under $1,700 would be quite negative and suggest a decline to very long-term support down near $1,575. We doubt that, but we don’t want to close the door on the possibility. New stimulus packages would probably be helpful for gold, but we just don’t know how much that is going to happen between now and the election. Lows into October, November, or December have not been unusual for gold in the past. October 22 would be the 12th anniversary of the October 2008 low. Mid-December marks the fifth anniversary of the 2015 low. November 12 marks the first anniversary of the key low that signaled the start of the bull market that took us to $2,089 in August 2020. Our 31-month cycle low was last seen in August 2018. That low was 32 months from the December 2015 low. By that definition the next 31-month cycle low is due April 2021 +/- 5 months so that range starts in November/December. That’s why we can’t yet dismiss the potential for a low in that period. But first we could get a rebound rally here, and as long as it stays under $1,945, we could then be set up for the next decline.
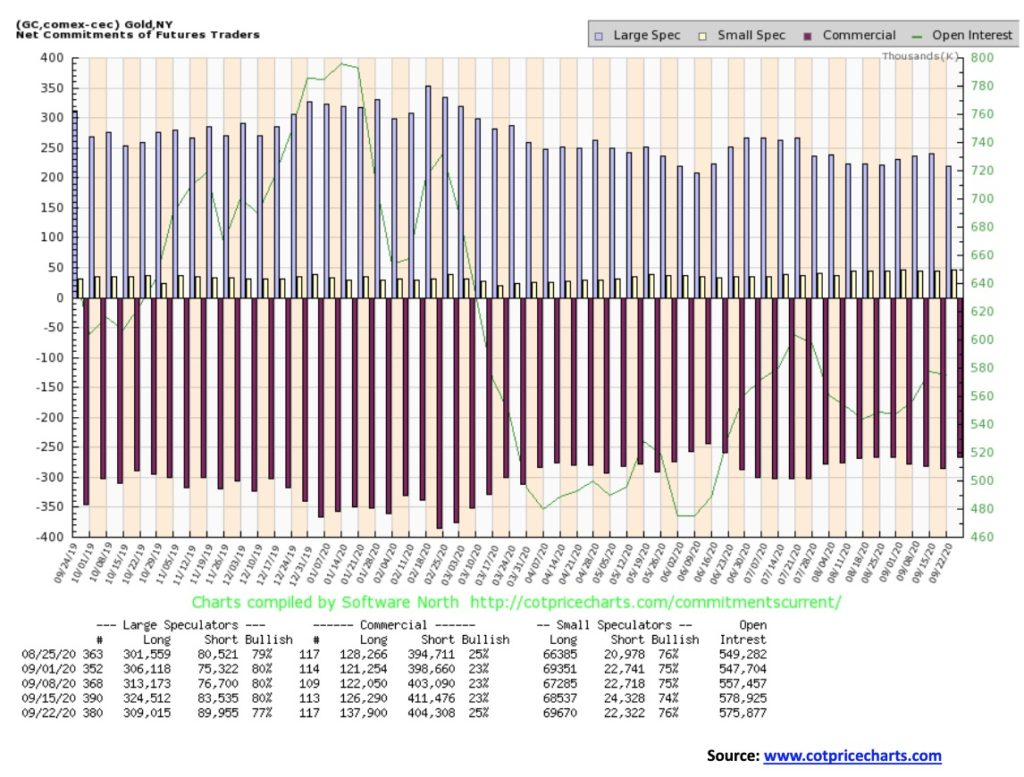
The gold commercial COT improved slightly to 25% this past week, up from 23% where it had been for the previous three weeks. Long open interest rose roughly 11,000 contracts while short open interest fell roughly 7,000 contracts. The large speculators COT (hedge funds, managed futures, etc.) slipped to 77% from 80% as their longs dropped over 15,000 contracts while shorts jumped over 6,000 contracts. Overall, open interest was down slightly by roughly 3,000 contracts. With gold prices down, that suggests to us that the decline was weak.
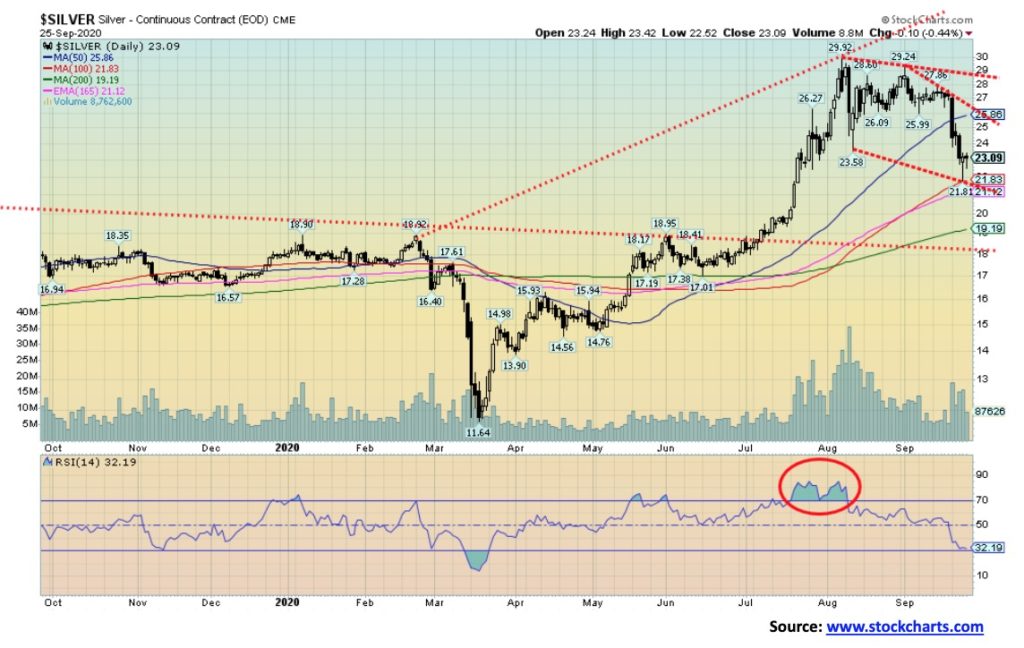
Silver prices took it on the chin this past week, falling almost 15% or $4. The low was $21.81 so the rebound to close at $23.09 was welcome. The triangle that formed at the recent high suggested a potential decline to around $19.75. The 200-day MA is at $19.19 and that remains a viable target as well. The fall this week saw silver rebound off of the 100-day MA ($21.83) and the 165-day EMA ($21.12). Could that be a low? Silver did make what appears to be a spike bottom and the rebound suggests that we could see some retracement action this coming week. Resistance would come in, however, at the 50-day MA near $25.86. That also would be about the upside breakout level. However, to suggest a major breakout, that wouldn’t occur until we once again broke out over $29. So, watch carefully how any rebound develops. A weak rebound that carries us up towards that 50-day MA could potentially prove to be a place to lighten up on positions. We expect that we might not see a low until October. Gold and silver also have some history of October lows or even lows into November/December. The RSI has not yet reached levels to suggest a low and sentiment, while it is down, has not reached deeply oversold levels. Despite any rebound at this time, however, our expectations are that the final low won’t be seen until we test the 200-day MA near $19 and even slightly below into the $18s. The breakdown started at around $27 so that level should serve as a point that would suggest that the decline is over. The pattern that has developed on silver is not dissimilar to the one on gold. We could label the drop to $23.58 as an A wave, the rally to $29.24 the B wave, and the decline this week to $21.81 as a C wave. Of course, the pattern could play out further with a D and E wave as well. So, use $27 as the point where the decline could be over.
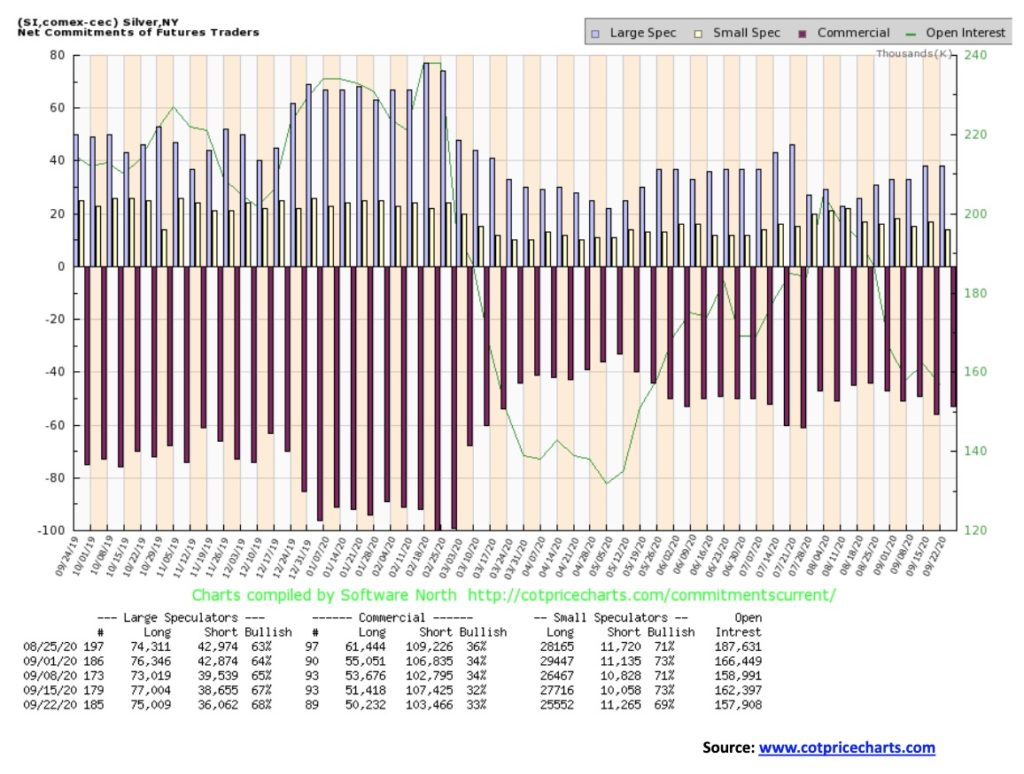
The silver commercial COT improved marginally this past week to 33% from 32%. That’s encouraging but it is not at a level we’d call bullish. Both short and long open interest fell with longs down roughly 1,000 contracts and shorts down roughly 4,000 contracts. Overall, open interest fell just over 4,000 contracts. Since the market was down on the week it suggests to us that, while the silver drop looks bad (down almost 15% on the week), the decline was actually weak.
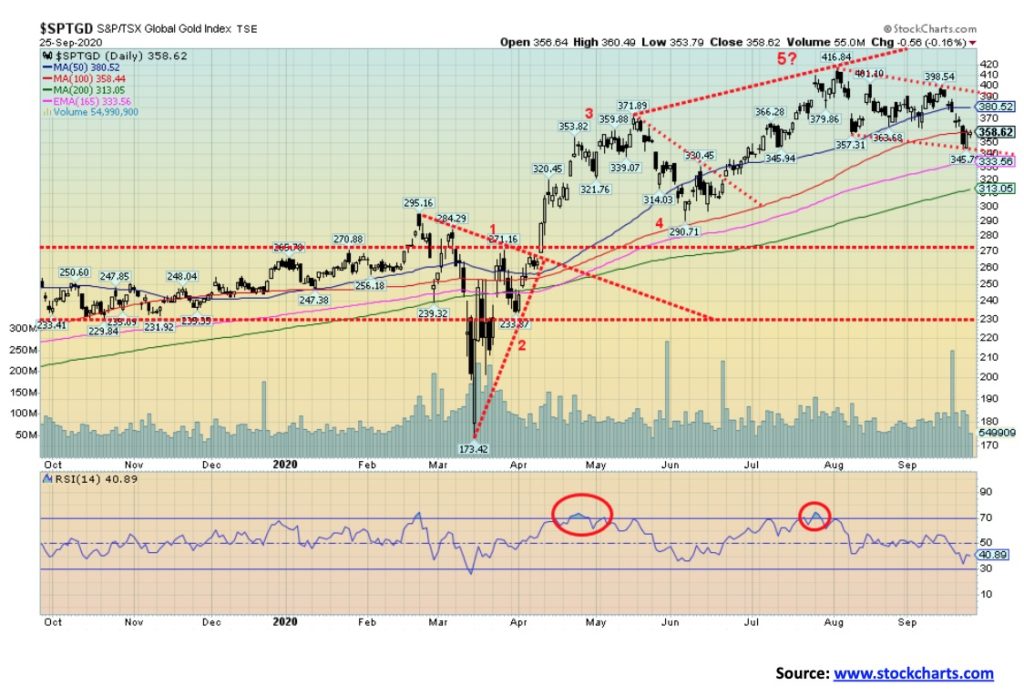
With both gold and silver prices down on the week, the gold stocks could not hold the line. The TSX Gold Index (TGD) fell 4.7% while the Gold Bugs Index (HUI) was down 6.6%. We thought it could have been worse, considering the almost 5% decline in gold prices and almost 15% decline for silver. So, by falling only about 5–7%, we have to consider this to be a win for the gold stocks. Normally double that decline would haven’t been a surprise. So maybe the gold stocks are hinting that things aren’t as bad as they might look. Still, the TGD (above) broke below its 50- and 100-day MA. Then it halted and put in a good up day on Thursday before stalling on Friday right at the 100-day MA. The TGD left what might be a forming bear channel on the charts. If this is correct, then the decline in the gold stocks might take on a gentler pattern. The 165-day EMA is just below at 333 and that should act as some support while the 200-day MA is down at 313. Those levels could act as both support and potential targets. With an RSI at 40, the TGD is not oversold sufficiently to suggest a low is at hand. We note that the Gold Miners Bullish Percent Index (BPGDM) has fallen to 62. That’s a more neutral level but it is not remotely near deeply oversold. We’d need to get down to under 25 and preferably even down to around 10 to suggest that. Other indicators are similarly rather neutral here, so we see nothing to suggest that we are bottoming. The TGD needs to regain above 380 and especially above 390 to suggest that a low is in. We don’t see that happening right now. Lower prices probably lie ahead, but our best-case scenario is for the TGD to remain within the confines of the possible forming bear channel. In that way the decline would be a slow grinding one rather than panic selling. Panic selling might only develop on a good break of the 200-day MA below 330.
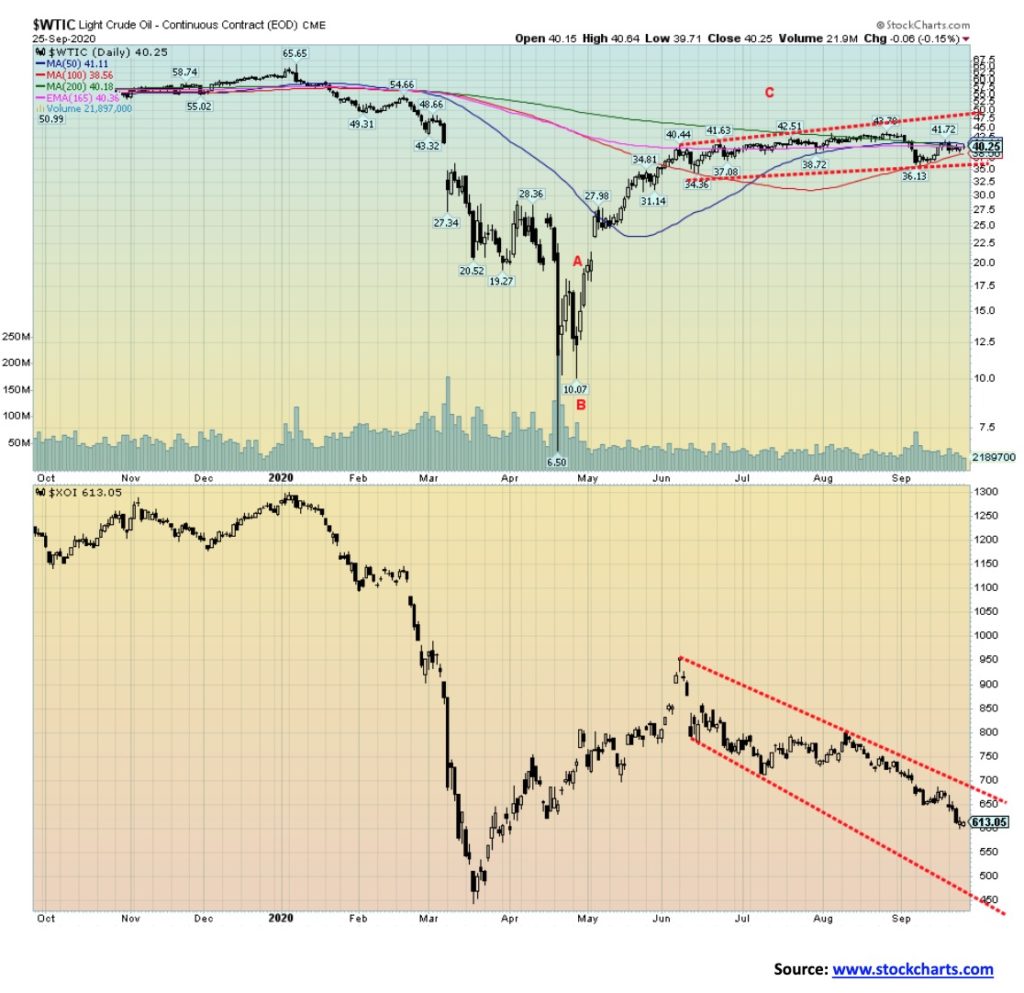
There really isn’t a lot to say about what is going on in the oil market. Prices just keep bouncing around within a trading band that goes roughly from $36 to $43. With prices currently at $40.25 for WTI oil we are about smack in the middle. WTI oil fell 2.6% this past week. On the other hand, natural gas (NG) soared, gaining roughly 75 cents for a 37.1% jump to fresh 52-week highs. None of the action translated into gains for the energy stocks, however, as the ARCA Oil & Gas Index (XOI) fell 8.6% and the TSX Energy Index (TEN) was down 6.7%. The energy stocks continue a miserable year with the XOI down 51.8% and the TEN off 54.7%. Oh, for sure there are individual stocks that have fared okay, but they are the exceptions, not the rule.
For the oil market this past week, the fear of a resurgence of the COVID-19 dominated. It is threatening to shut down European economies once again. In the U.S., the hit and miss lockdowns or outright refusal to lock down are playing havoc with rising numbers once again. It doesn’t help when California announces plans to phase out gas-powered cars by 2035. For the oil industry, falling demand is killing them. Even the U.K. is getting into the act, also announcing plans to phase out gas-powered cars or, as they say, ICE (internal combustion engines). The reality for the oil producers is that they need at least $50 to $60 oil to make things at least somewhat viable and, as we noted in our chart of the week, many need $80 plus.
Helping prices a bit this past week was a draw on reserves. At least that steadied any fall. Technically, as noted, WTI oil remains in a band. A break below $36 could trigger further selling while a breakout above $43 might trigger further gains. But the energy stocks appear to suggest that the break is more likely to be down rather than up. Pessimism grips the energy stocks and they just keep on sliding with no sign of a bottom.
—
(Featured image by Pixabay via Pexels)
DISCLAIMER: This article was written by a third party contributor and does not reflect the opinion of Born2Invest, its management, staff or its associates. Please review our disclaimer for more information.
This article may include forward-looking statements. These forward-looking statements generally are identified by the words “believe,” “project,” “estimate,” “become,” “plan,” “will,” and similar expressions. These forward-looking statements involve known and unknown risks as well as uncertainties, including those discussed in the following cautionary statements and elsewhere in this article and on this site. Although the Company may believe that its expectations are based on reasonable assumptions, the actual results that the Company may achieve may differ materially from any forward-looking statements, which reflect the opinions of the management of the Company only as of the date hereof. Additionally, please make sure to read these important disclosures.


Temotiva Launches Crowdfunding Campaign to Advance Preventive Mental Health
Temotiva Innovación Lab has launched a crowdfunding campaign through Santander X Explorer, marking a new phase for the University of...


Fed Policy Shift Raises Concerns Over Debt and Inflation Risks
The Federal Reserve is criticized for resuming balance sheet expansion through Treasury purchases despite expectations of tighter policy under new...


AI Adoption in Italian Retail Stalls Despite Strong Experimentation
A survey on AI in Italian large-scale retail trade shows companies are increasingly adopting artificial intelligence, but only 1.4% have...


Crypto Market Stays Stable as Bitcoin and Ethereum See Mild Declines
The crypto market remained stable despite slight declines in major coins like Bitcoin and Ethereum. Bitcoin held near $64,362, while...


WNBA Removes Cannabis From Banned Substances List in New CBA
WNBA removed cannabis from its banned substances list in a new CBA running 2026–2032, aligning with NBA policy and allowing...
 |
|
 |  |
 |
|
-

 Cannabis5 days ago
Europe’s Cannabis Shift: Rising Use, and New Risks
-

 Markets2 weeks ago
Sugar Markets Rise Slightly Amid War, Oil Price Pressure, and Strong Global Supply
-
 Impact Investing2 days ago
AI Adoption in Italian Retail Stalls Despite Strong Experimentation
-

 Cannabis1 week ago
Cannabis Legalization in Germany: A Mixed Interim Assessment