Featured
The stock markets gapped down this past week: is the rally over?
A raging pandemic, wildfires, hurricanes, protests and riots on the streets of the U.S. and EU, clashes between supporters of Trump and Biden. It appears things may be coming apart as we go into the “winter of our discontent.” It’s a big week – a extremely contentious election, a Fed meeting and the October job numbers. But one thing has shone. Gold has been the best performer this century and in 2020.
‘Now is the winter of our discontent
Made glorious summer by this sun of York’ —William Shakespeare, opening line of Richard III, Act 1, Scene 1
Shakespeare’s words may never be more prescient. Things, as they say, are slowly unravelling. Presidential candidate Joe Biden may say “Our politics has for far too long been mean, bitter, and divisive.” But they could get worse before they get better. In other words, things will get darker (winter) before they will get brighter (spring).
Here’s how things are looking right now: record-breaking numbers for COVID-19 as the world passes 46 million cases and over 1.2 million dead; record-breaking wildfires in California now threatening Orange County and million-dollar homes; riots and clashes on the streets of the U.S., sparked by yet another shooting of a black man; riots and clashes in the EU over shutdowns and masks; confrontations continuing to take place between supporters of President Trump and candidate Biden as the election looms, which could deepen after the election as neither side accepts the other; hurricanes, with Louisiana being hit for the fifth time this season; growing unemployment, along with rising homelessness and depression.
It has been amazing that the markets have stayed afloat during all of this, but are they now wavering for a fall? The housing market has also been rising, but for how much longer? It has been the K recovery so far. One arm up (Wall Street), the other arm down (Main Street). Oil prices have started to fall precipitously once again. Even gold and gold stocks are proving to be no safe haven from the sell-off. We saw that picture in September/October 2008 and once again during the March 2020 collapse. But gold and gold stocks were also the first out of the chute and in both instances rose to record levels. The conditions for gold just keep getting better.
With stimulus packages sure to grow no matter who wins after November 3, the money supply and the Fed balance sheet are sure to expand even further. Oh yes, stimulus—fuel for gold and fuel for the stock market as well. According to the table below (thanks, Thomas), government stimulus has totaled $7.6 trillion while central banks have provided an additional $3.4 trillion, the bulk of it coming from the Federal Reserve. Sorry Canada, you were too small for this table even if Canada’s government stimulus was at least as large as China’s.
| Country | Government stimulus | Central bank stimulus |
| USA | US$3T | US$2T |
| Germany | US$1.3T | |
| Italy | US$0.86T | US$0.06B |
| Japan | US$1T | |
| France | US$0.46T | |
| China | US$0.37T | US$1.3T |
| United Kingdom | US$0.46T | |
| India | US$0.19T | US$0.08T |
We repeat again—since the beginning of March 2020 the Fed balance sheet has exploded upwards $2.9 trillion or 69%, U.S. money supply M2 is up $3.2 trillion or 21% (to end of September), the U.S. Federal debt is up $3.8 trillion or 16%, while the S&P 500 had gained 21% at the recent peak and gold 33% at the recent peak. When too much money is chasing too few assets, one gets asset inflation. For the record, the Bank of Canada’s balance sheet has jumped $337.3 billion or 72% in the same time frame, while money supply (M2) is up $250.3 billion or about 14%.
Gold has generally followed the Federal Reserve Balance Sheet higher.
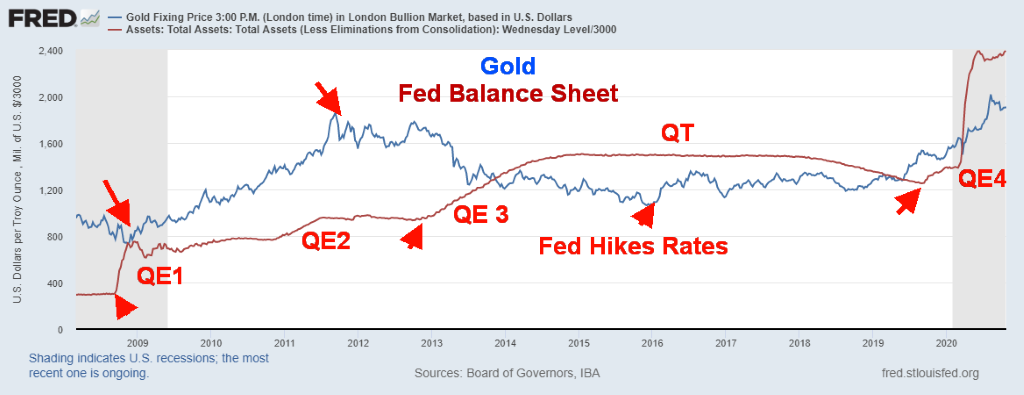
Gold began its rise quickly out of the 2008 financial crisis collapse when the Fed embarked on its first round of QE1. From October 2008 to its peak in September 2012 gold rose 182% through QE1 and QE2. Gold stocks, as represented by the TSX Gold Index (TGD), were up 200%. But gold collapsed in 2013, including the day when gold fell over $200 on April 12 and April 15. Gold didn’t find its bottom until December 2015, having fallen $870 or 46% from its top in September 2011. Many reasons were given for the collapse, but one that eventually made sense was the anticipated end of QE. While QE3 was first announced back in September 2012 it initially wasn’t as aggressive as earlier forms of QE, despite being more open-ended. Gold seemed to be anticipating the end of QE. By year end 2013 the Fed indeed was effectively announcing the tapering of the QE program and even began to hint that interest rates could be hiked. Gold did not respond well to the end of QE. Ironically, gold found its bottom in December 2015, coinciding with the Fed’s first announcement of a hike in the Fed rate.
Gold traded in a flat up-and-down manner from 2016 to 2018 but started to rise again in 2019 as the Fed’s taper program appeared to be coming to an end. Gold started to rise in late 2019 when it was learned that the Fed was conducting repo operations with the banking system. The March pandemic collapse sparked what has become known as QE4 and gold broke out of a 7-year trading range and soared to new all-time highs in August 2020 at $2,089. Since then, gold has been going through a corrective period that has largely coincided with what appears to be a slowdown in QE4. The Fed’s balance sheet peaked in June 2020 and, since then, has been relatively flat although it has started to rise again in October, albeit slowly.
Gold has been the best-performing asset of this century and in 2020 despite the 7-year hiatus from 2012–2019.
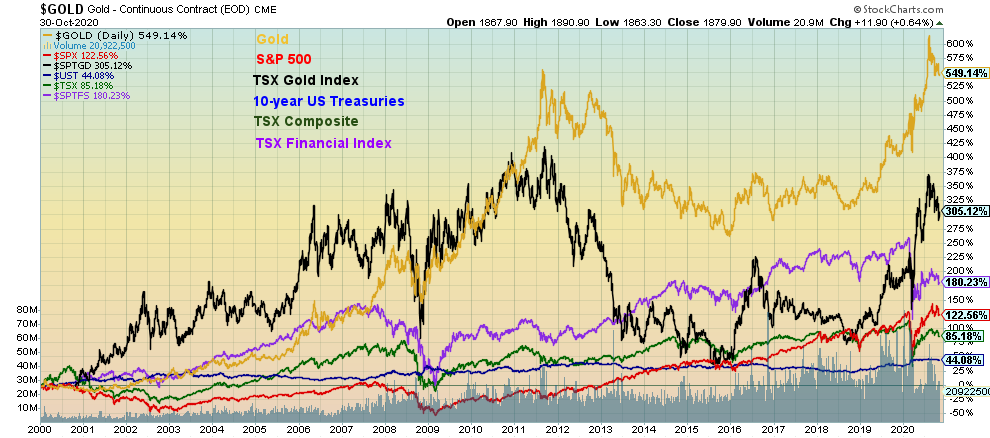
In the chart above, 2000-present, gold is up 549%, the S&P 500 +123%, TSX Gold Index +305%, U.S. 10-year Treasury Notes (before interest coupon) +44%, TSX Composite +85%, and TSX Financials +180%. Not shown is silver, up 334% while WTI oil is up 40%, TSX Real Estate Index up 133%, TSX Energy Index down 33%, the CRB Index down 29% and the City of Toronto housing index was up 285%.
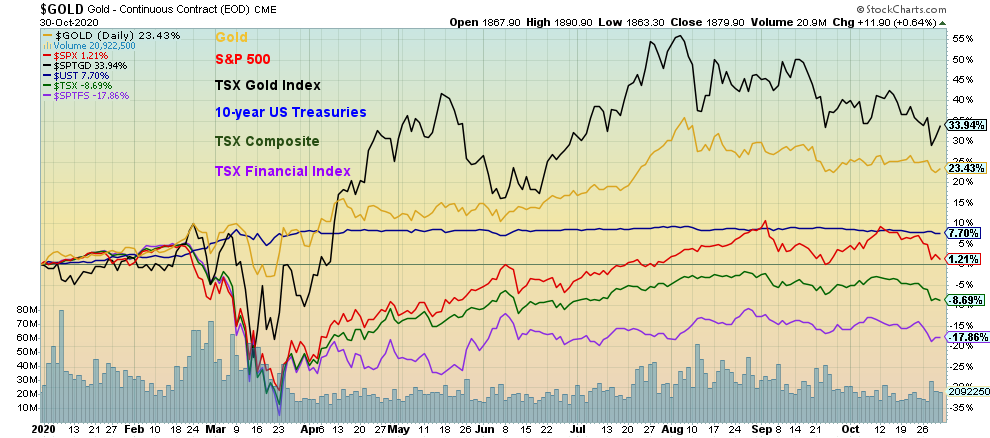
The story is much the same in 2020. The TSX Gold Index is leading the way with a gain of 34%, gold is up 23%, the S&P 500 is up 1.2%, the TSX Composite is down 8.7%, 10-year U.S. Treasury Notes up 7.7%, and the TSX Financials down 18%. Again, silver (not shown) is up 32%, WTI oil down 41%, TSX Energy Index down 56%, CRB Index down 22%, TSX Real Estate Index down 21%, but the City of Toronto housing index is up 8%.
A raging pandemic, an extremely contentious election, riots in the streets—all we can think of is “fasten your seatbelts; it’s going to be bumpy ride.” (paraphrase of Margo Channing quote, played by Bette Davis from the film All About Eve (1950)).
Markets and trends
| % Gains (Losses) Trends | |||||||
| Close Dec 31/19 | Close Oct 23/20 | Week | YTD | Daily (Short Term) | Weekly (Intermediate) | Monthly (Long Term) | |
| Stock Market Indices | |||||||
| S&P 500 | 3,230.78 | 3,269.96 | (5.6)% | 1.2% | down | up | up |
| Dow Jones Industrials | 28,645.26 | 26,501.60 | (6.5)% | (7.1)% | down | up (weak) | up |
| Dow Jones Transports | 10,936.70 | 11,106.19 | (6.5)% | 1.9% | down | up | up |
| NASDAQ | 9,006.62 | 10,911.59 | (5.5)% | 21.6% | down | up | up |
| S&P/TSX Composite | 17,063.53 | 15,580.64 | (4.4)% | (8.7)% | down | neutral | neutral |
| S&P/TSX Venture (CDNX) | 577.54 | 683.78 | (4.8)% | 18.4% | down | up | up (weak) |
| S&P 600 | 1,021.18 | 876.59 | (6.1)% | (14.2)% | neutral | up (weak) | down (weak) |
| MSCI World Index | 2,033.60 | 1,778.89 | (6.1)% | (14.2)% | down | neutral | down |
| NYSE Bitcoin Index | 7,255.46 | 13,343.05 (new highs) | 3.1% | 83.9% | up | up | up |
| Gold Mining Stock Indices | |||||||
| Gold Bugs Index (HUI) | 241.94 | 314.662 | (2.8)% | 30.0% | down | up (weak) | up |
| TSX Gold Index (TGD) | 261.30 | 349.98 | (0.8)% | 33.9% | down | up (weak) | up |
| Fixed Income Yields/Spreads | |||||||
| U.S. 10-Year Treasury yield | 1.92 | 0.87 | 3.6% | (54.7)% | |||
| Cdn. 10-Year Bond yield | 1.70 | 0.67 | 4.7% | (60.6)% | |||
| Recession Watch Spreads | |||||||
| U.S. 2-year 10-year Treasury spread | 0.34 | 0.71 | 4.4% | 108.8% | |||
| Cdn 2-year 10-year CGB spread | 0 | 0.39 | flat | 3,900.0% | |||
| Currencies | |||||||
| US$ Index | 96.06 | 94.04 | 1.4% | (2.1)% | up | down | down |
| Canadian $ | 0.7710 | 0.7510 | (1.3)% | (2.5)% | down | up | neutral |
| Euro | 112.12 | 116.49 | (1.8)% | 3.9% | down | up | up |
| Swiss Franc | 103.44 | 109.06 | (1.4)% | 5.4% | down (weak) | up | up |
| British Pound | 132.59 | 129.60 | (0.6)% | (2.2)% | neutral | up | neutral |
| Japanese Yen | 92.02 | 95.53 | 0.1% | 3.8% | up | up | up |
| Precious Metals | |||||||
| Gold | 1,523.10 | 1,879.90 | (1.3)% | 23.4% | down | up | up |
| Silver | 17.92 | 23.65 | (4.1)% | 32.0% | down | up | up |
| Platinum | 977.80 | 848.40 | (6.4)% | (13.2)% | down | neutral | neutral |
| Base Metals | |||||||
| Palladium | 1,909.30 | 2,217.20 | (7.6)% | 16.1% | down | up (weak) | up |
| Copper | 2.797 | 3.05 | (2.6)% | 9.1% | up | up | up |
| Energy | |||||||
| WTI Oil | 61.06 | 35.79 | (10.2)% | (41.4)% | down | neutral | down |
| Natural Gas | 2.19 | 3.35 (new highs) | 5.0% | 53.0% | up | up | up |
Note: For an explanation of the trends, see the glossary at the end of this article.
New highs/lows refer to new 52-week highs/lows.
Chart of the Week
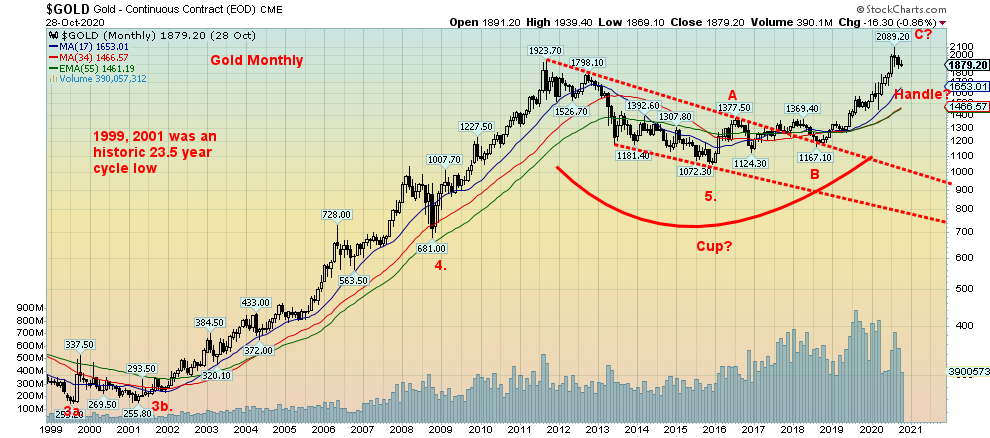
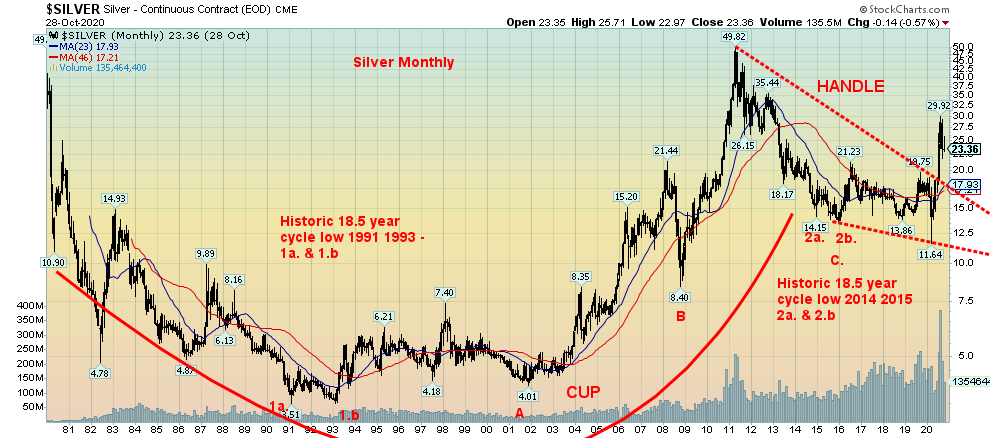
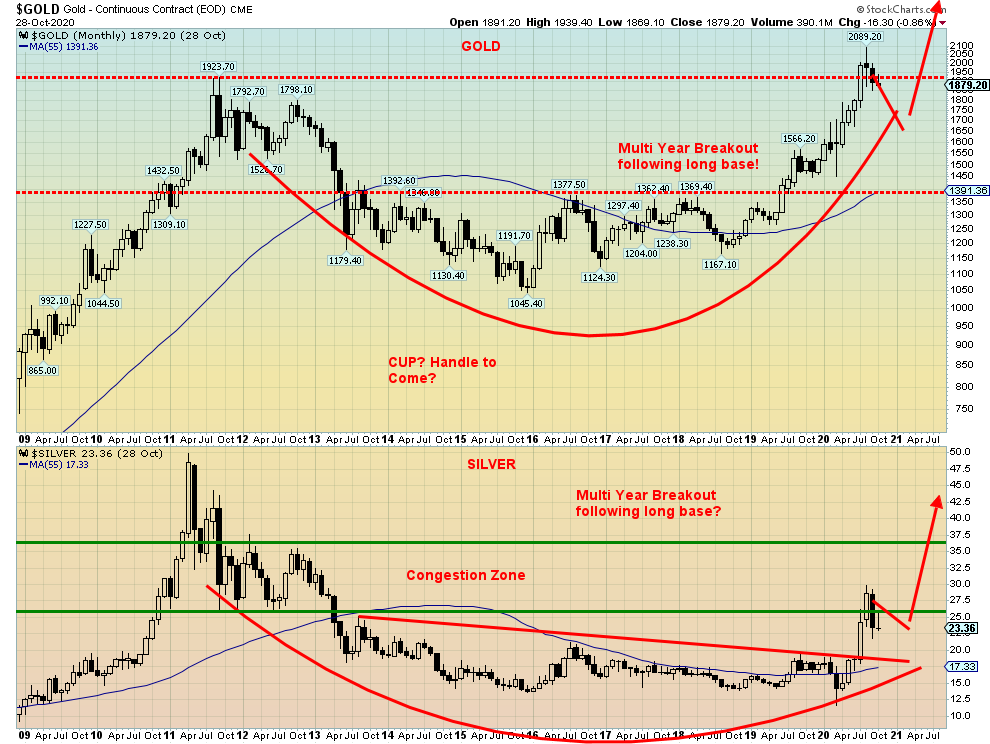
It pays to look at the big picture as it tells an important story. Above are long-term monthly charts of gold and silver. Both have broken out of long-term bases. Typically, when that happens the subsequent rally can carry on for more than a few years. Since gold became free-trading back in 1971, it has enjoyed two multi-year rallies in 1971–1980 and 2001–2011. In the first instance, gold gained 1,522% based on monthly closing prices. The second rally saw gold gain 555% on a monthly close basis. Silver gained 2,548% from 1971–1980 and was up 798% from 2001–2011, again based on monthly closes. The rebound so far has occurred from 2015–2020. Gold has gained 76% while silver is up 70%.
It should be noted that, while gold enjoyed multi-year rallies, it was not a straight-up affair and there were periods of significant corrections. During the first rally in 1971–1980 there was a 50% correction in 1975–1976. The second multi-year rally 2001–2011 saw gold fall 34% during the 2008 financial crash. In both instances, there were declarations that gold was finished and would never recover. In March 2020, at the height of the pandemic panic, gold fell 15%. During the final phase of the 2001–2011 rally seen in 2009–2011, there were two corrections of 15% yet gold managed to rise 182% overall. Corrections are a normal part of the process and they should be looked upon as buying opportunities. Only when prior years’ lows are taken does the situation change. In 2013 gold crashed through both its 2012 and 2011 low, signaling that the 2001–2011 rally was officially over.
Could this rally carry on for a few more years, including moving into a blow-off phase? It is possible. The primary or long-term trend is up for both gold and silver. Primary trends can remain in place for years. Given we are now up for five years, it is always possible that the primary trend is topping out. Except we do not consider the primary trend over until it takes out a previous year’s low. For gold, the 2019 low was at $1,267. In theory at least, silver did take out both its 2018 and 2019 low in March 2020 when it spiked down to $11.64. Except it never closed below the previous year’s levels. Both gold and silver gave long-term buy signals back in April 2019 for gold and, more recently, for silver in August 2019. These breakouts occurred following a long period of a bear market primarily from 2013–2019. If there is a concern, it is that gold moved to make new all-time highs while silver has failed to confirm as it remains well below its all-time high near $50 seen in 1980 and again in 2011.
Gold’s well-documented 7.8-year cycle low (range 7–9 years) is not due to bottom next until 2023–2024. The last one was recorded in December 2015 and before that October 2008. The longer one, but somewhat unproven due to a lack of data, is the 23.5-year cycle (range 20–28 years) which is due to bottom in early 2023 +/- 4 years. Most likely its low should coincide with the next low of the 7.8-year cycle. The last 23.5-year cycle occurred with a double bottom in 1999 and 2001.
For now, we’ll set aside forecasts that have gold going to $15,000 and silver to $150. At this point we have little evidence of that happening. Our most recent forecast for gold, based on it breaking out of its long base that formed, is a rise to at least $2,200. The high earlier this year was at $2,089. There is further potential up to $2,700. But that would occur only if we firmly take out $2,200. Right now, only a breakdown under $1,450 would suggest to us that the long-term cycles have topped and we are in the throes of collapse into the major cycle lows.
For silver, it projects up to at least $65 based on the wedge triangle it appeared to break out of earlier this year. Silver’s longest cycle is one of 18.75 years (range 15–22 years) which last bottomed in 2014/2015. So, it is currently in the process of new long-term cycle. It would take a breakdown under $19.75 to suggest to us that silver’s long-term up move is over.
There remains strong demand for both gold and silver. The pandemic has negatively impacted production in 2020, causing shut-downs and breaks in the supply chain. We have a combination of weak output, strong demand, and the fact that gold is generally held in strong hands who are not inclined to sell. We also have dwindling confidence in paper money. With central banks all around the world pumping up the money supply and adding to their balance sheets, that results in one thing: devaluation of the currency. While gold this year is up 23% in US$, gold is up 26% in Cdn$, 27% in pound sterling, 19% in euros, 17% in Swiss francs, and 19% in Japanese yen. Gold acts as a hedge not only against currency devaluation but also against inflation and deflation.
No matter what happens coming out of this election, gold should remain a winner. Both candidates are committed to spending trillions to bring the U.S. out of the steep recession of 2020. If the post-election period is tumultuous as many expect, gold could act as a safe haven. Since the Fed and here in Canada the Bank of Canada (BofC) are committed to hold interest rates where they are into 2023 central banks will have no choice but to monetize the rapidly growing debt. Again, this a positive for gold going forward.
When we talk gold and silver here, we are referring to physical gold and silver. Gold stocks are leveraged to the price of gold and silver, but other factors may have gold stocks doing better or worse than gold and silver itself. Given the need for new sources of gold and silver, the junior exploration miners are the most leveraged to the price of gold and silver. We await the election.
It was the worst week since the panic selling in March 2020. No wonder, with coronavirus cases surging over 500 thousand globally, over 100,000 in the U.S. alone, and continued protests, clashes, and riots in the EU and in the U.S. as we head into the most contentious election ever. Regardless of who wins on Tuesday—and all signs point to a contested election result or at least a delayed election result—the divide in the U.S. is not going away any time soon. Again, it won’t matter who wins on Tuesday, as the divide and clashes most likely will intensify.
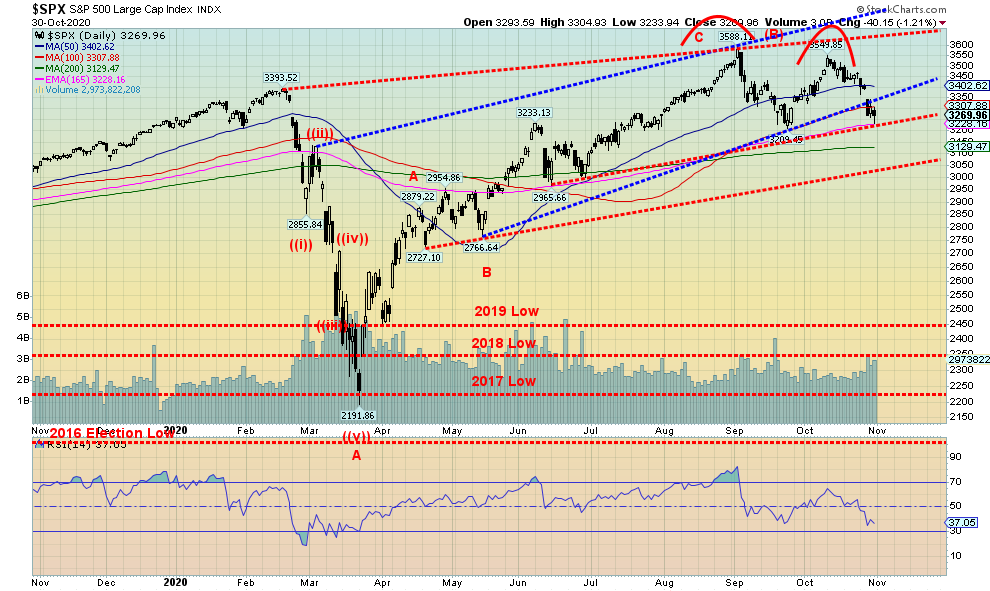
The S&P 500 gapped down on Wednesday, leaving a gap between 3,365 and 3,342. Our expectation is that the gap will not be filled, signaling to us that a bear market is most likely underway. Because the collapse in March took out previous year’s lows all the way down to 2017, it signaled to us that a major bear market was most likely under way. The March collapse was the A wave. The rally from March is the B wave. Now comes the C wave. C waves can create a flat, meaning the low should come somewhere around the March low. Or it can go slightly lower. If this bear market is like previous bears, the market should lose at least 30% and could, overall, last at least a year and half. That would take us into late 2021 or even into 2022 before we find the final bottom. That would fit with cycles that would fall into that time frame.
This past week the S&P 500 lost 5.6%, the worst week since March. The Dow Jones Industrials (DJI) was off 6.5%, the Dow Jones Transportations (DJT) was down 6.5% as well, while the NASDAQ dropped 5.5%. The small cap S&P 600 dropped 6.1% and the S&P 500 Equal Weight Index lost 5.8%. Here in Canada the TSX fell 4.4% and the TSX Venture Exchange (CDNX) was down 4.8%. In the EU the London FTSE was off 4.8%, the Paris CAC 40 down 6.4%, and the German DAX dropped 8.6%. In Asia, China’s Shanghai Index (SSEC) was a star, losing only 1.6% and the Tokyo Nikkei Dow (TKN) dropped 2.3%. Asia is faring far better with the coronavirus as they were brutal about shutdowns and closing their borders as they remembered SARS and as a result were much better prepared.
The S&P 500 broke one trendline and appears to be on the cusp of breaking another. All indications are that this market should go lower. Most indicators are down but they are not very oversold yet. So, there is room to move lower. If, however, the market was to gap lower again as it did in March, then this decline could get ugly in a hurry and a panic could follow. There is support down to the 200-day MA near 3,100 but under that level a panic could be underway. Right now, only regaining 3,500 would suggest to us that we could move higher.
There are three big events this week: the election on Tuesday November 3, the Fed meeting on November 4-5, and, the October employment numbers on Friday. The charts are not encouraging and a panic is possible.
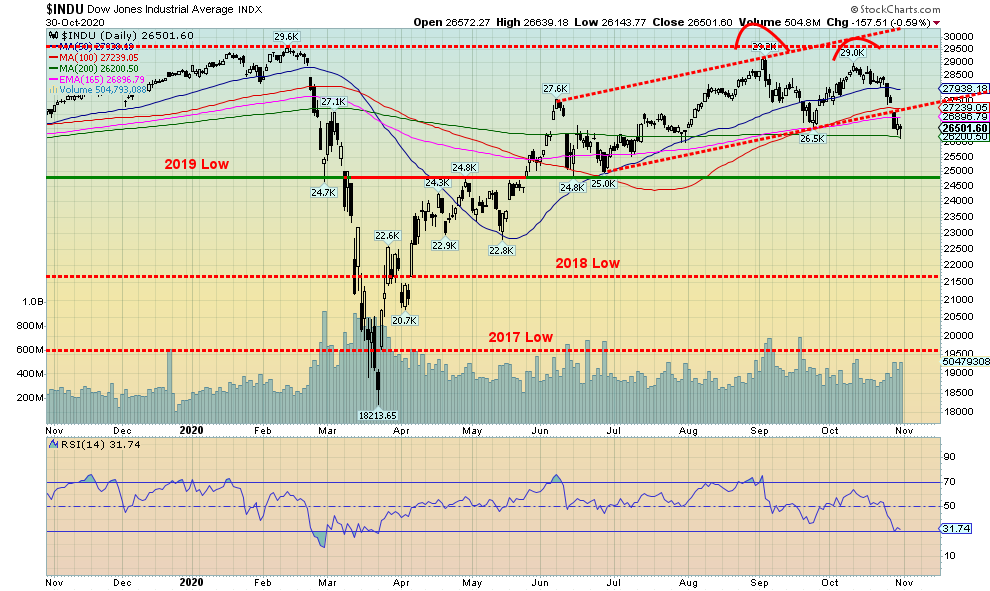
The Dow Jones Industrials (DJI) is not faring well, falling 6.5% this past week, the worst of the major indices. As well, unlike the others, the DJI broke under the September low of 26,815 and is currently resting on the 200-day MA. If the double top is correct, then the DJI projects down to at least 24,470. The DJI closed bearishly this past week, but it could have been worse. A solid close under 25,300 would have signaled to us that we were headed lower now. On the other hand, the DJI failed to close above 27,800 that might have signaled to us that we are still alive. Instead, we are just in a kind of no man’s land. But a solid break now of 25,300 would signal to us that we are headed lower. We note that the DJI did not confirm with the DJT in making new all-time highs. This major divergence between the indices is not quite confirmed just yet, but confirmation to the downside appears to be certain.
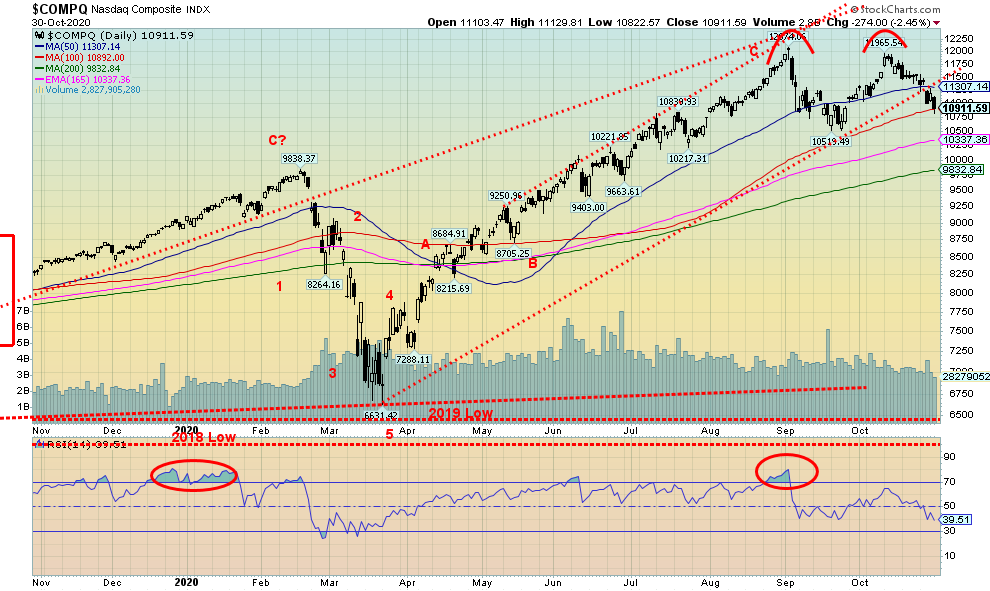
The tech-heavy NASDAQ gapped down like the other indices on Wednesday, losing 5.5% on the week. The gap is small as the low on Monday the 26th was 11,358 while the high on Thursday the 29th was 11,287. The differential has not been closed. The NASDAQ found support at the 100-day MA at least initially on Friday. It could break lower towards the 165-day exponential MA near 10,337 and the 200-day MA near 9,832. Breaking the September low at 10,519 could project a fall in the NASDAQ to potential targets at 8,965. The NASDAQ is down 15% from its all-time September high but remains up 21.6% on the year. Its major FAANG components were hit this past week with Facebook down 7.6%, Apple off 5.4%, Amazon down 5.3%, Netflix off only 2.6%, and Google down 1.2%. Microsoft fell 6.4% and Tesla lost 7.8%. Even Berkshire Hathaway wasn’t spared, falling 5.3%. Odds are good that the NASDAQ should break its September low. Below that, the key support level is the 200-day MA.
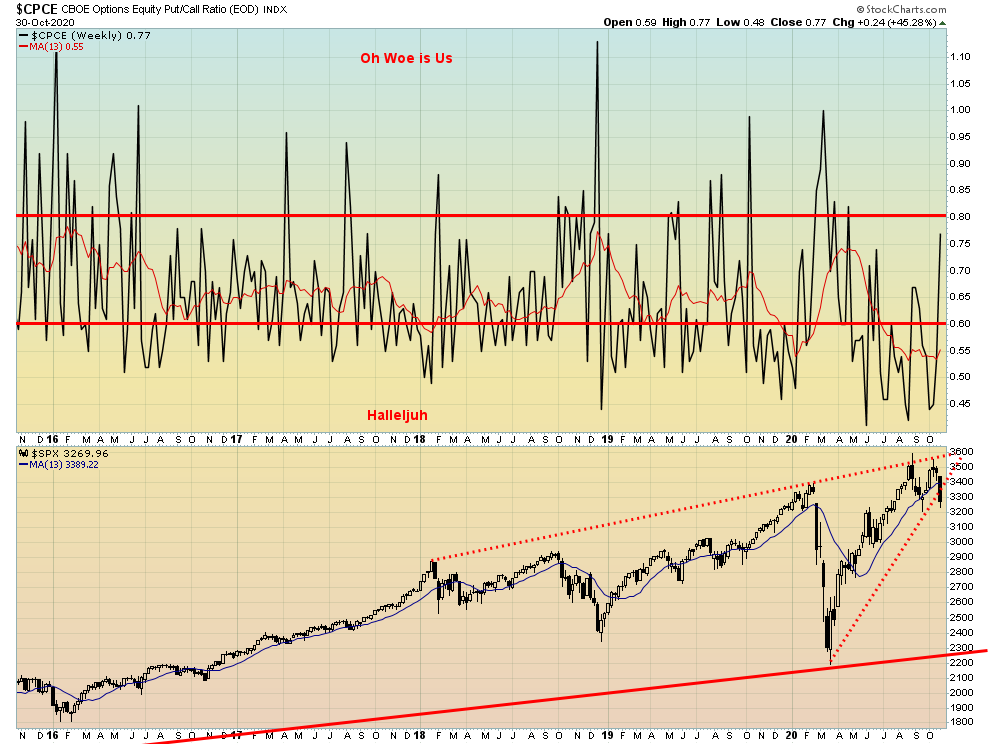
It is no surprise that the put/call ratio has leaped this past week, now at 0.77. This is neutral territory for the put/call ratio—neither bearish nor bullish. Another big plunge this coming week and the ratio could leap into puts being favoured over call by a wide margin. That in turn could set up the potential for a low.
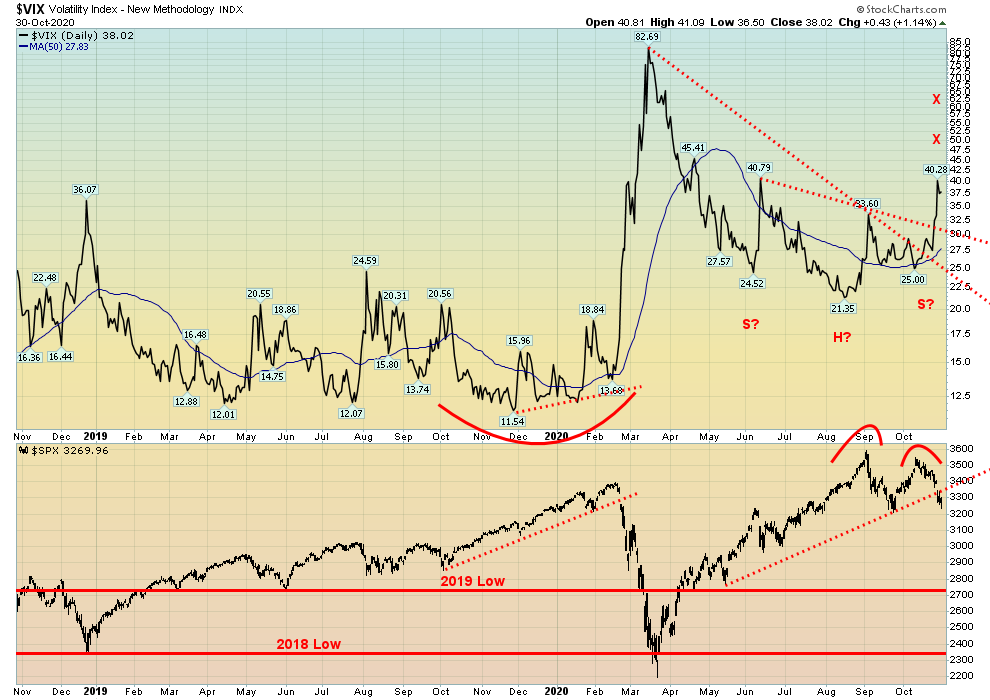
No surprise that volatility has jumped in the wake of the markets being beat up this past week. The VIX volatility index is quickly back at the levels seen at the June 2020 low. The VIX made a possible head and shoulders bottom. It has now broken out of its neckline around 31 and projects up to at least 50. Further potential is up to 62. The S&P 500 broke an uptrend line from a low in April. It is also falling from a potential double top on the charts.
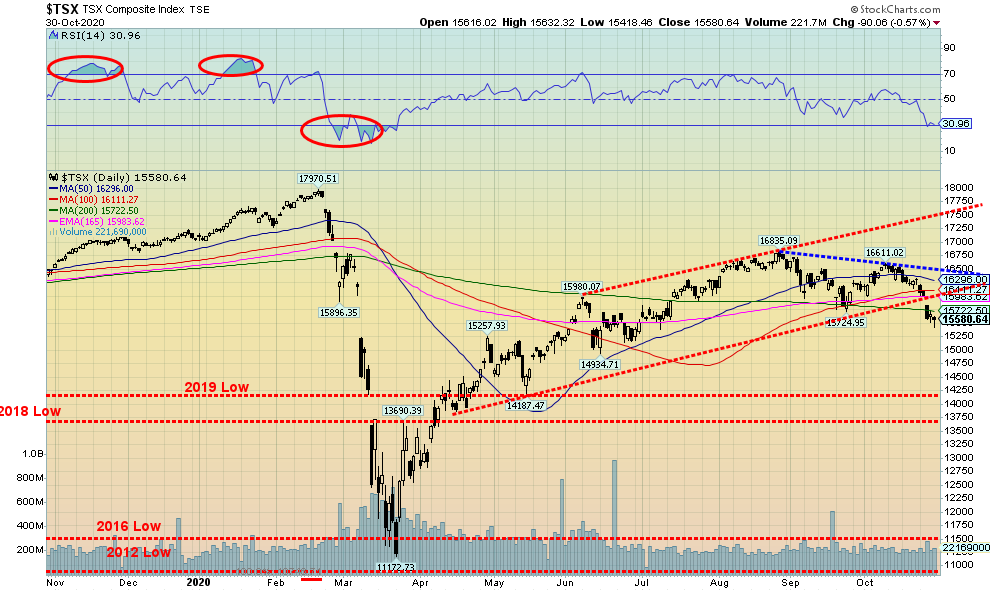
The TSX joined the down party this week, losing 4.4%. Like some of the other indices, the TSX gapped lower on Wednesday and then closed under the 200-day MA. It could find support here, but if we were to break under the June low of 14,935, then all bets are off and we are most likely in the throes of a bear market. The possible double top on the charts plus the gap down on Wednesday indicate a potential top for the TSX. It suggests to us that the B wave is complete and we are now beginning the C wave down. The A wave down was the March pandemic crash that smashed through the 2016 low to 2019 low and came close to breaking under the 2012 low. That was a signal to us that a major bear market was potentially underway. The B wave recovery was not unexpected. The TSX just didn’t do as well as some of the other indices, regaining just over 50% from the March low. Every sub-index was hit this past week, led by Energy (TEN), down 6.5% and closely followed by Information Technology (TKK), down 6.4%. Golds were the best performer, losing only 0.8%.
U.S. Real GDP & Federal Debt (Annual Change %)
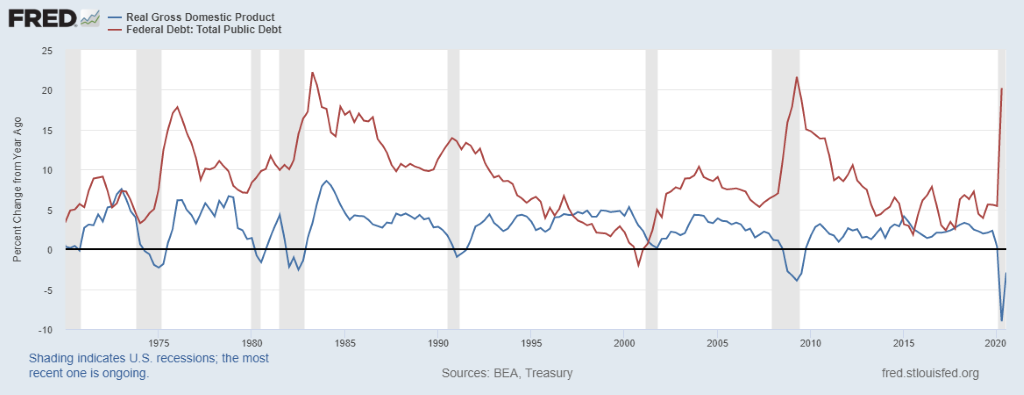
The U.S. reported that Q3 GDP rose 33.1%. This was above the expected 31%. It followed a record 31.4% plunge in Q2. It still left the U.S. 3.5% below its pandemic peak. The expectation for 2020 is a GDP decline of 4.6%. The rebound was helped by a surge in personal spending and helped by the CARES cheques and unemployment benefits. With those withering now, the expectation is that Q4 could see a return to negative growth. Of the 22 million jobs lost in March and April, only 11.3 million have been recovered and the real unemployment level is probably around 20 million. If one adds in long-term unemployment, it could be as high as 26 million. With GDP plunging, U.S. federal debt has gone in the opposite direction. That’s not unusual as one can see that with each recession debt has to some extent surged. The biggest gains previously were during the 1980–1982 recession and the Great Recession of 2007–2009. But this one so far is the biggest plunge in GDP since the Great Depression.
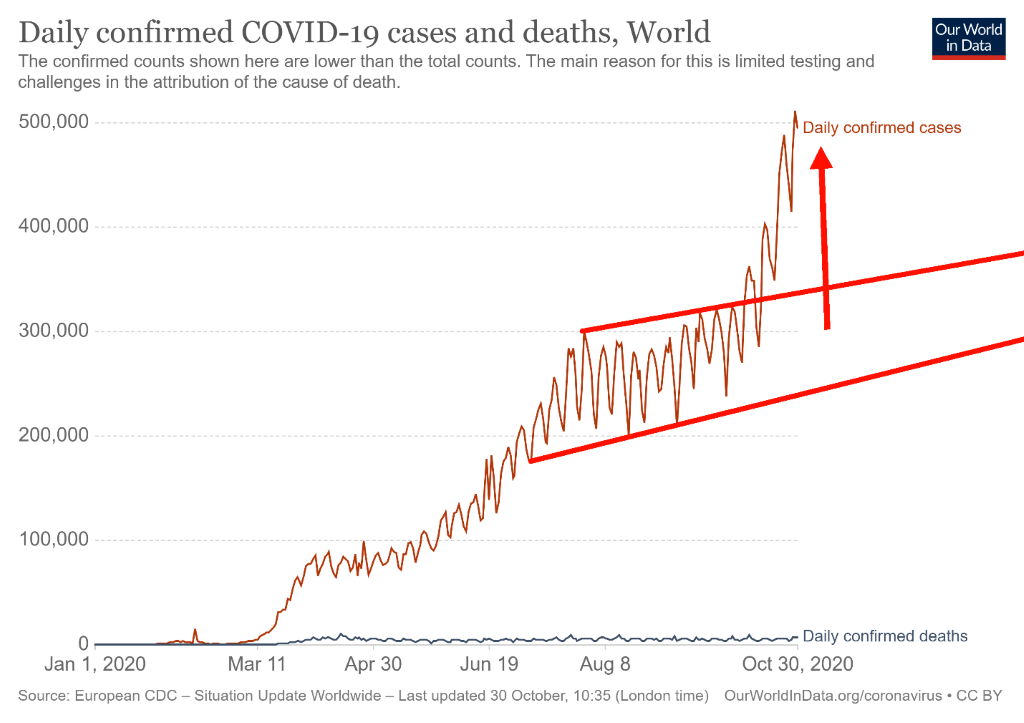
Has COVID moved into the hockey stick pattern? It looks that way as the number of daily cases appears to be going straight up. This past week a record 573 thousand cases were recorded on October 30. It was led by the U.S. who recorded 101 thousand cases that day, becoming the first country to record over 100 thousand cases in a day. But numbers have been soaring in Europe as well. France, for example, recorded over 49 thousand cases on Friday. Eight countries are now over one million cases, led by the U.S. with over 9 million cases. The world has surpassed 46 million cases and if 500 thousand plus daily cases holds, that translates into a million more cases every two days. That means we’ll be at 50 million cases by Tuesday. The 7-day average is now over 463 cases. Deaths are also rising even as overall deaths as a percentage of cases are falling. The overall death rate/cases has fallen to 2.5% from 3% and of late it is been more like 1.3%. They can’t stop the spread but they are slowing down the death rate. The common flu has a death/cases ratio of around 0.1%.
Coronavirus cases and deaths November 1, 2020 – 14:19 GMT
Cases – 46,516,506
Deaths – 1,202,134
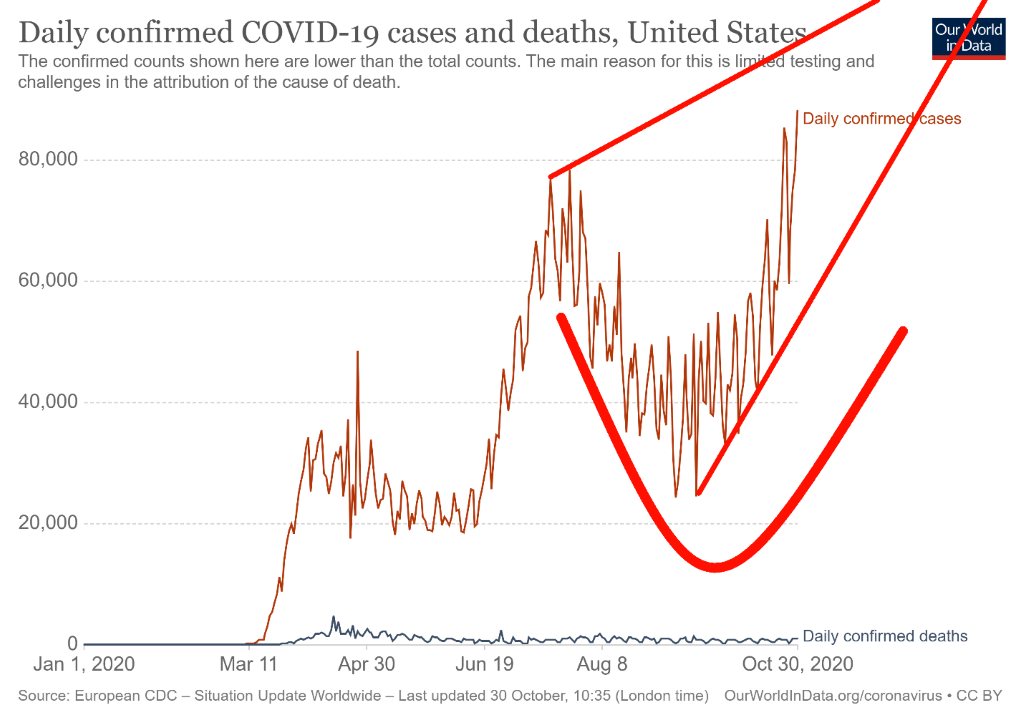
The U.S. continues to set records, recording for the first time over 100 thousand cases in a single day. The second wave is proving more deadly than the first wave. Yet, large parts of the U.S. refuse to deal with it sensibly. The U.S. leads the world with over 9.4 million cases and over 235 thousand dead. That’s more deaths than all the wars since the Korean War in 1950 – 1953 and double the number of U.S. deaths in World War I. Although it has a way to go to reach the number of deaths in World War II, and it is still only a third of the deaths recorded during the U.S. Civil War in 1861 – 1865. The estimated number of deaths due to the Spanish flu in 1918 – 1919 was 675 thousand on a much smaller population base. Both Texas and California are rapidly approaching a million cases each with Florida not too far behind. New York still leads in number of deaths but they have slowed of late while Texas and California and Florida are rising rapidly. The U.S. death rate/cases has fallen to around 1%. Many hospitals are at or near capacity and are going to have a much harder time handling cases if the current rate of infections remains at these levels.
Coronavirus cases and deaths November 1, 2020 – 14:19 GMT
Cases – 9,404,823
Deaths – 236,101
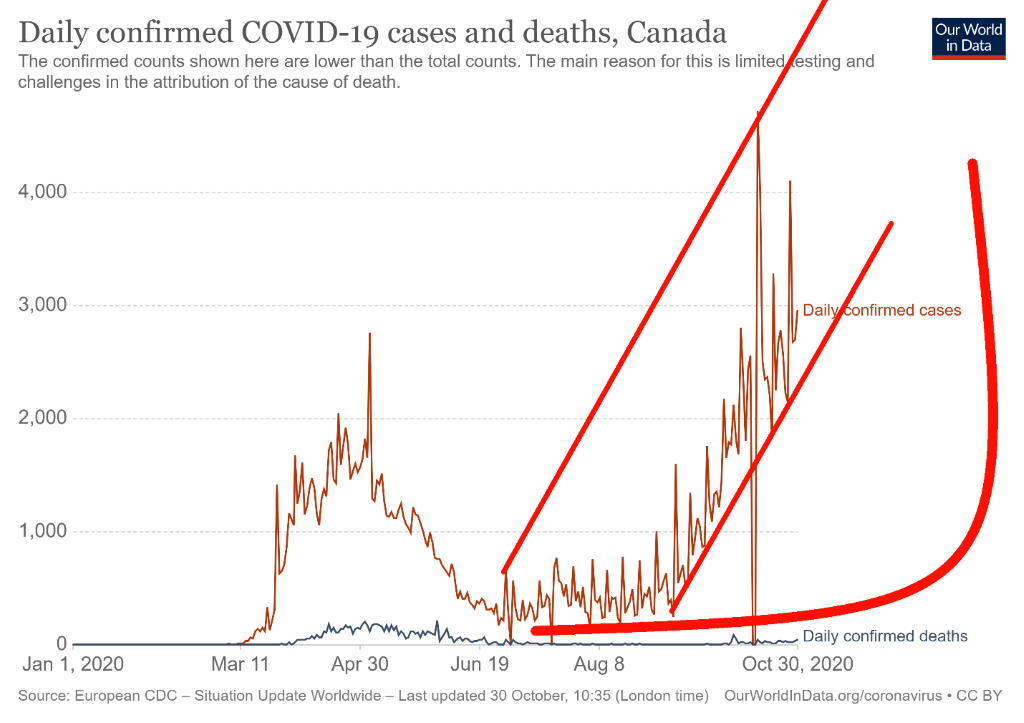
For Canada, it is good news and bad news. The good news is that Canada has fallen to 31st place in the world in terms of the number of cases. The bad news is the number of cases keeps on rising as Canada is now between 2,500 to 3,500 cases every day, led as usual by Ontario and Quebec but rising in the West as well, particularly Alberta. Canada has recorded over 10 thousand deaths for a death/cases ratio of 4.4%. That is comparatively high but it is coming down more recently to being closer to 1%. That was due to high death rates in long-term care homes in the early stages of the pandemic. Canada still ranks 22nd in deaths but ranks 88th in terms of cases/million population and 40th in terms of deaths/million of population. Some prize.
Coronavirus cases and deaths November 1, 2020 – 14:19 GMT
Cases – 234,511
Deaths – 10,136
US 10-Year Treasury Note, Canada 10-Year Government Bond (CGB)
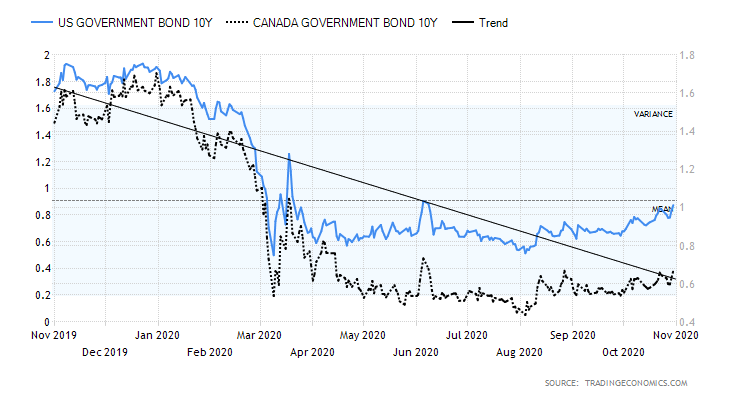
Whither longer-term interest rates? It appears that, for the moment, the path of least resistance is up as the U.S. 10-year treasury note rose to 0.87% this past week, up 3.6%, and the Government of Canada 10-year bond (CGB) gained 4.7% to 0.67%. The 10-year is trying to poke its head above the 200-day MA so it is possible that it fails somewhere around here. A firm break over 0.90%, however, could suggest that the 10-year is headed higher, potentially to levels around 1.20%. The catalyst appears to be the better than expected economic numbers that are being reported. As we noted, Q3 GDP rose 33.1%, better than the expected 31%. Weekly jobless claims were also better than expected at 751,000 vs. 791,000 the previous week and an expectation of 775,000. Personal income for September rose 0.9% vs. down 2.5% in August while personal spending was up 1.4% vs an expectation of only 1.0%. The Michigan Consumer sentiment indicator came in at 81.8 which was better than the expected 81.2 and above the previous month’s 80.4. Earlier, in the Case-Shiller index, home prices were up 5.2% year over year, much better than the expected 4.2% gain. The Chicago PMI for October surprised at 61.1 vs. an expectation of 58, suggesting further recovery in manufacturing. The biggie is out on November 6 as nonfarm payrolls are expected to show a gain of 661 thousand and the unemployment rate at 7.9%. We should note that Canada will also report its October employment numbers. Canada is looking for a small loss of 7,500 jobs and an unemployment rate of 9%. We’ll report on them in next week’s Scoop. The rise in interest rates could stop dead in its tracks if employment numbers are worse than expected and chaos breaks out after the election.
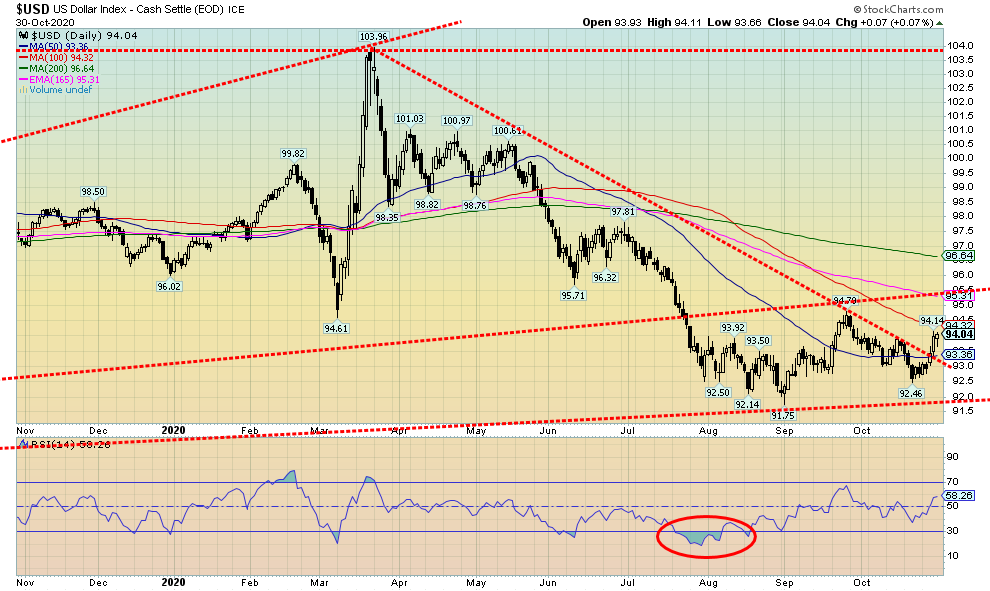
With the EU effectively shutting down in the wake of a huge surge in the coronavirus, along with ongoing protests, riots and clashes on the streets of Italy, France, and Germany in particular, funds rushed out of EU stocks and into a supposed safe haven of U.S. dollars. The result was that the US$ Index rose 1.4% this past week and appears to have broken out once again to the upside, closing just above 94. The euro fell 1.8%, the Swiss franc was down 1.4% while the pound sterling was off 0.6%. The Japanese yen bucked the trend, rising a small 0.1% but the Cdn$ joined the others, losing 1.3%. The election this coming week could whip the U.S. dollar in the other direction, particularly if the outcome is in doubt and clashes erupt on the streets. The US$ Index has resistance up to about 94.50. Above that level, a rise to the 165-day exponential MA near 95.30 would get underway. The 200-day MA is up at 96.64. The US$ Index could be tracing out an ABCDE-type pattern with the A wave and B wave complete. This could be the C wave. A breakdown could occur if the index broke back under the recent low of 92.46. Confirmation would come on new lows below 91.75. But mostly the trading in the US$ Index is lethargic, suggesting to us this is merely corrective to the big downswing from the March 2020 top.
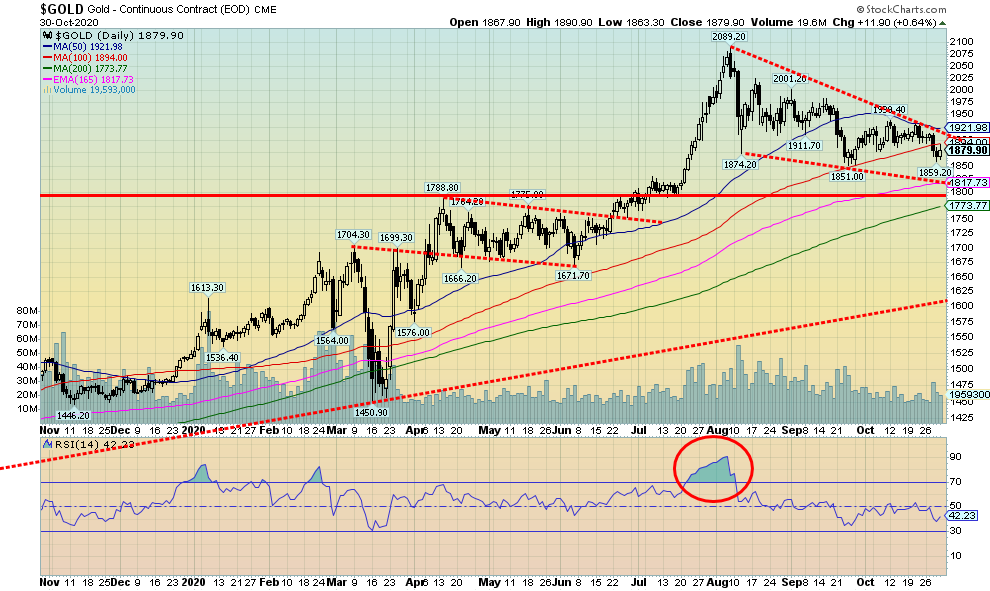
With a stronger U.S. dollar, gold was hit this past week, losing 1.3%. Silver was down 4.1% while platinum took another hit, losing 6.4%. Platinum can’t seem to get out of the way of itself; it is down 13.2% on the year. Of the near precious metals, palladium was down 7.6% while copper was off a small 2.6%. Both copper and palladium remain up on the year. Gold is up on the year by 23.4%. However, gold lost 0.8% on the month and it was the third monthly decline having topped in August even as the month ended down. Gold did rebound on Thursday and Friday after falling more sharply earlier in the week. No matter who wins the election on Tuesday (or later) stimulus is sure to keep on coming and that, ultimately, is positive for gold as we have noted. But this past week the strong U.S dollar, coupled with a rush to less risky investments as result of the surge in coronavirus, saw gold, silver, and the gold stocks fall along with the broader stock market. Gold currently has channel support down to around $1,815/$1,820. Further support can be seen down to $1,775 and the 200-day MA. We have noted gold may be trying to find its 31-month cycle low. The last registered 31-month low was seen in August 2018 at $1,167. The next one is due April 2021 +/- 5 months. We are now in that window. The March crash was too early for that cycle low; instead, it may have been a half-cycle low of the longer 7.83 cycle. That cycle would work out to around 47 months and it came in 51 months after the December 2015 low. So, it would qualify. It will be interesting to see how gold responds to this week’s election. Gold needs to return back above $1,920 now to suggest that a low is in. Confirmation would come on a break over $1,950/$1,970. To the downside, the danger point is under $1,850 and that might help trigger a move to test the 200-day MA.
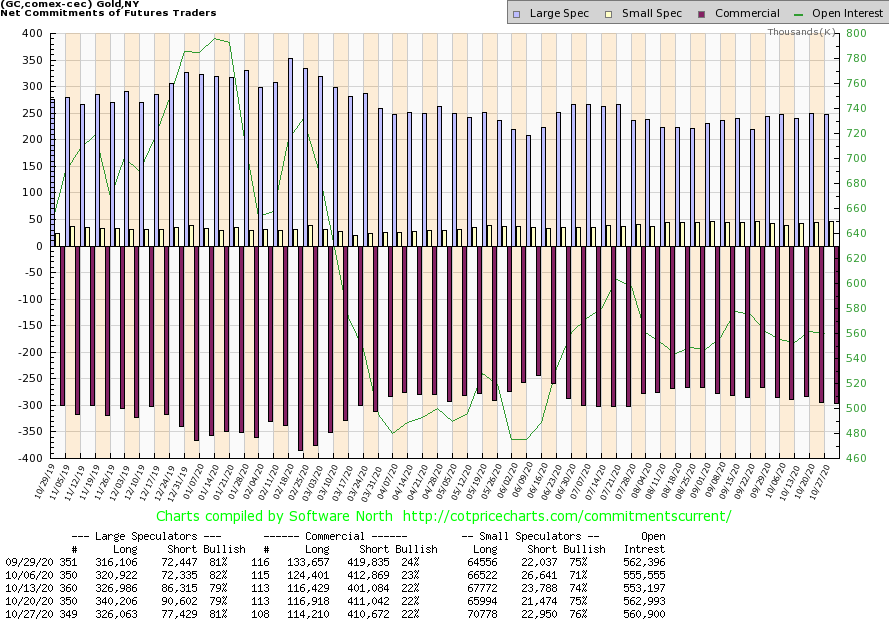
The commercial COT for gold remains steady at 22%. Long open interest fell over 2,000 contracts this past week while short open interest was down about 400 contracts. The large speculators COT (hedge funds, managed futures, etc.) rose to 81% from 79% as their long open interest fell roughly 14,000 contracts and short open interest was down roughly 13,000 contracts. Overall, open interest fell almost 3,000 contracts this past week, suggesting that some of the volume and downside this past week was short covering. Overall, the COT remains somewhat bearish.
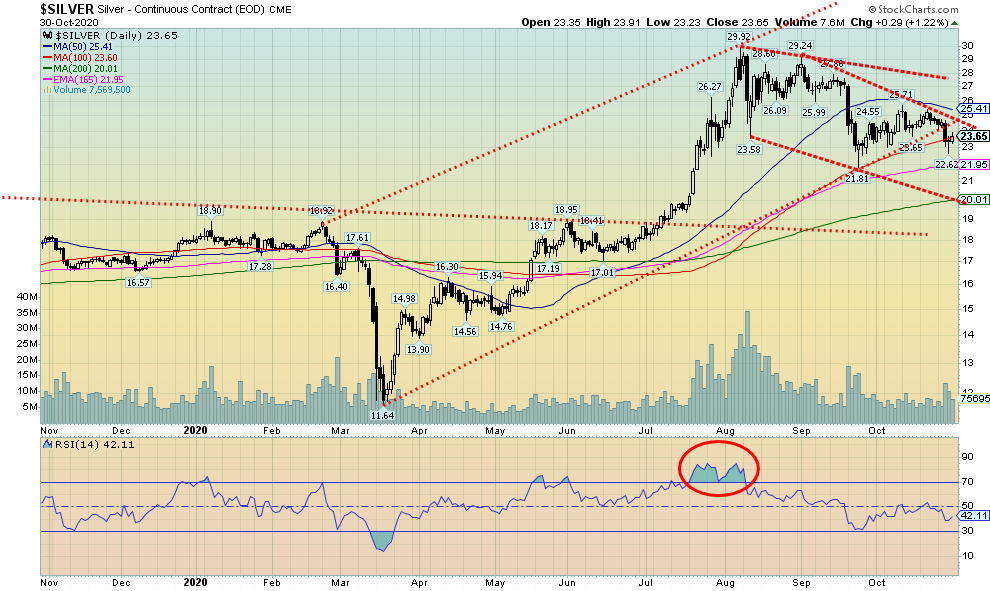
Silver was pressured lower this week, losing 4.1%. Silver appeared to find support around the 100-day MA at the end of the week. The 200-day MA is down at $20. A test of that level cannot be ruled out as the descending bear channel’s bottom is near $20. Silver actually eked out a small gain for the month of October after falling sharply in September. Silver is down 21% from the August high. This has been the first good correction since the March 2020 low and only the second correction since an important low was seen in November 2018 (the first was the March 2020 crash).
As we have noted before, we believe that the 2015 low was a very important cyclical low. Silver’s longer-term cycle of 18.75 years breaks down effectively into 3 cycles of 7 years with the half cycle around 3.3 years. The November 2018 low came roughly 3 years after the December 2015 low so that would qualify. With silver taking out its $21.22 high of July 2016, it confirmed that the major trend for silver is up and should stay that way for the foreseeable future. Silver does risk falling to the bottom of the bear channel near $20, but our preference is that we hold above $21. We do have potential targets down to that level. Silver needs to rise above $25 to suggest to us that the downtrend is over. Confirmation would come with a close over $26. The final breakout level is above $28. Above that, level new highs are probable.
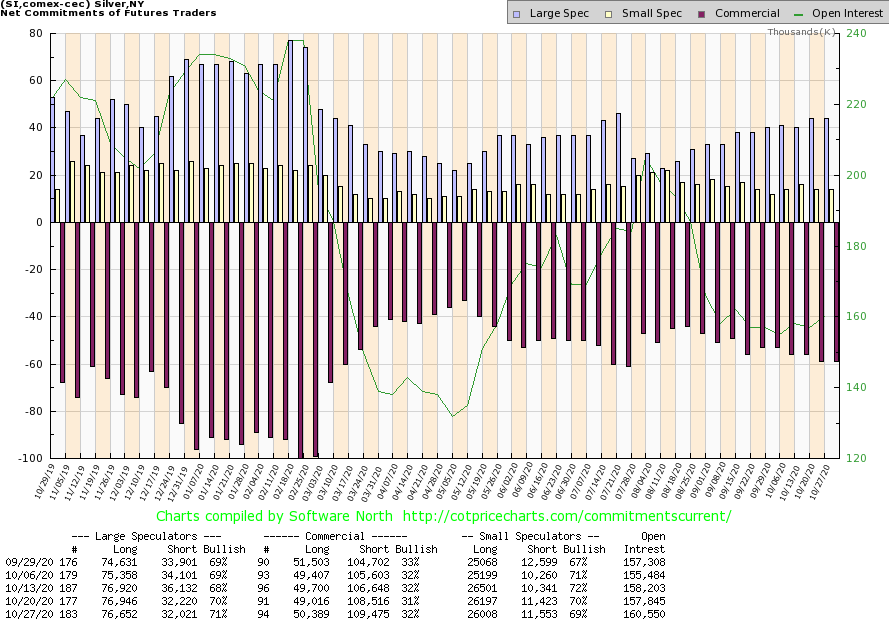
The silver commercial COT rose slightly to 32% this past week from 31%. A glimmer of hope? Long open interest rose over 1,000 contracts but short open interest was also up about 1,000 contracts. Total open interest rose about 3,000 contracts on a down week, suggesting some strength in the sell-off. The large speculators COT rose to71% from 70%. Overall, the silver COT remains somewhat bearish.
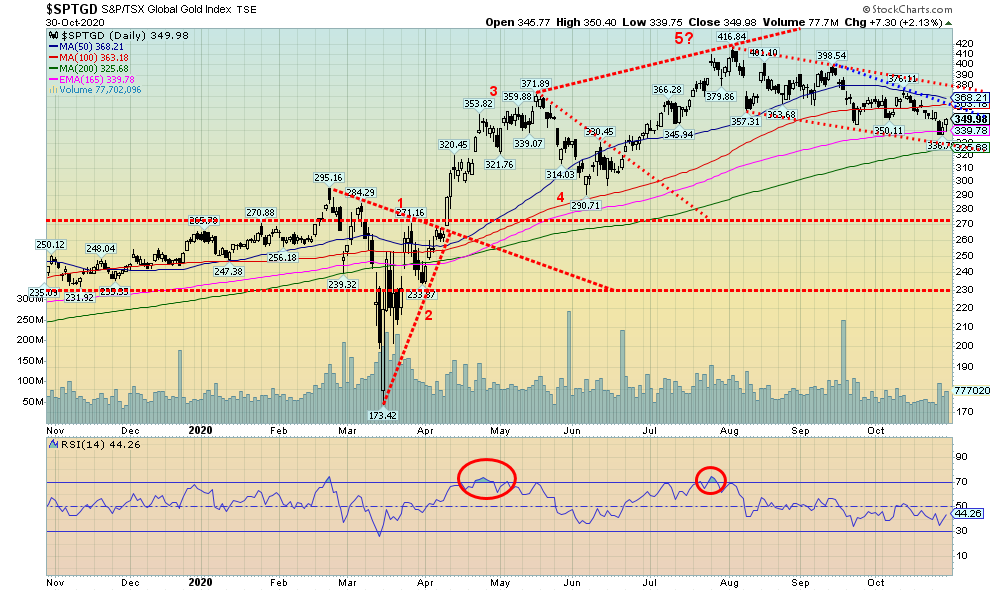
Gold stocks remain under pressure as the price of gold and silver slides. The TSX Gold Index (TGD) fell 0.8% this past week while the Gold Bugs Index (HUI) was down 2.8%. However, both bounced back on Thursday and Friday. The TGD appeared to find support around 165 exponential MA and just above trendline support near 330. The low so far is 336.80. The TGD closed Friday almost 4% above that low. As long as the TGD remains within the confines of the down channel, any further decline from here could be minimal. We see a possible 5-wave decline in the channel, but it is of the type ABCDE as opposed to a 1,2,3,4,5 impulse move: in other words, a corrective move. The 200-day MA is just below at 325. The TGD remains up 33.9% on the year and the HUI up 30.0%. That’s a healthy move in any book, even if the TGD is 16% off its high seen in July. The 2009–2011 bull run saw a few 15% or so corrections on its way to the top. The risk here is that the bottom falls out of the down channel. That would suggest a drop under 325 and a potential decline to 255. We doubt that, as the down move does not appear to us as a descending triangle. If anything, the downtrend is narrowing more along the lines of a descending wedge triangle which is bullish, not bearish. But the TGD needs to break out over 365 for starters and then over 380 to confirm that a new upward push could be underway.
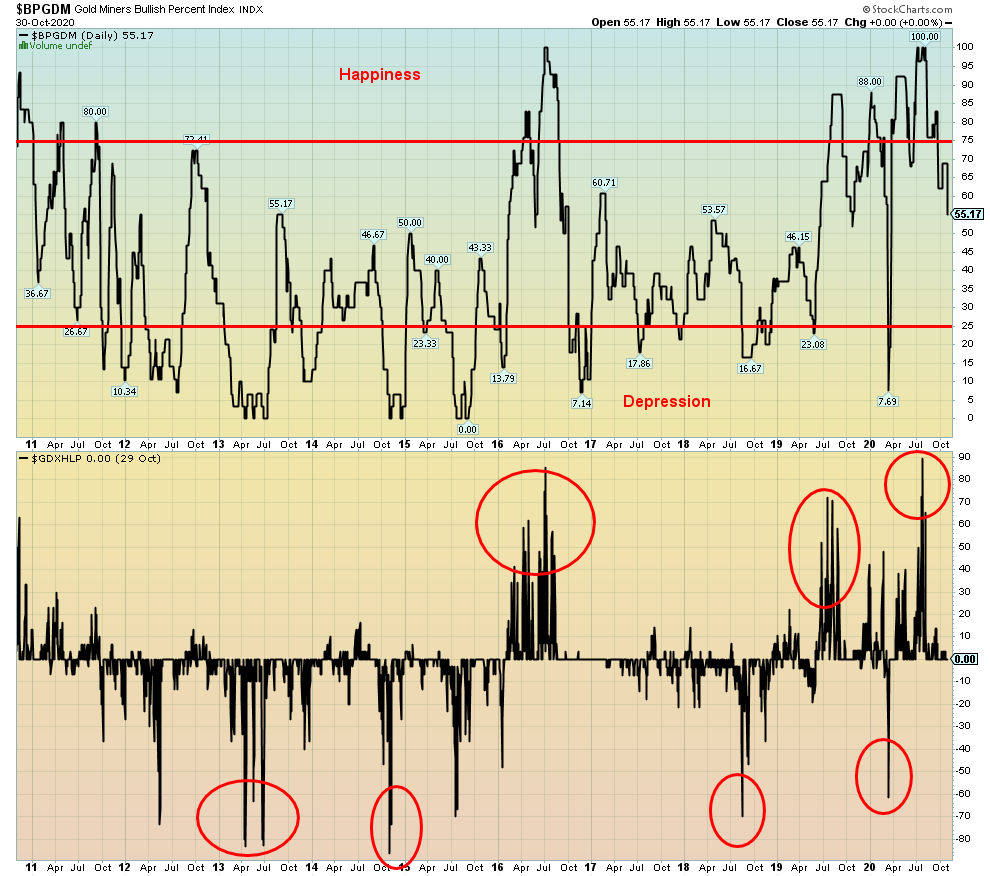
The Gold Miners Bullish Percent Index (BPGDM) has moved into neutral territory near 50 (currently 55.17). This is the lowest level seen since March 2020 plunge. It has to get down under 25 and preferably under 10 to give off a strong buy signal. The Gold Miners New Highs – New Lows Index (GDXHLP) is also pretty neutral here. Both indicators are moving in the right direction if one is looking for the next buying opportunity. But we note that the indicators can remain in neutral territory for some time: witness the trading between 2017–2018.
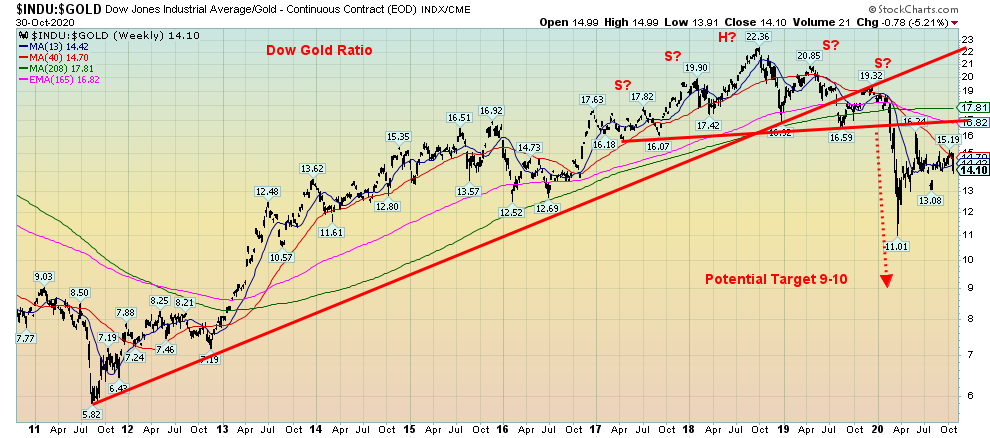
The DJI/Gold ratio appears to be reasserting itself in favour of gold. After falling out of what appears to us as complex head and shoulders top pattern the ratio fell in favour of gold into the March 2020 panic low. Since then the ratio has tried to rebound in favour of the DJI. After several weeks of attempting to break higher the ratio fell this past week and appears poised to break away to the downside in favour of gold. We maintain potential targets of 9-10 and the ratio could even go lower in favour of gold. Breaking under 13 would confirm the breakdown in progress.
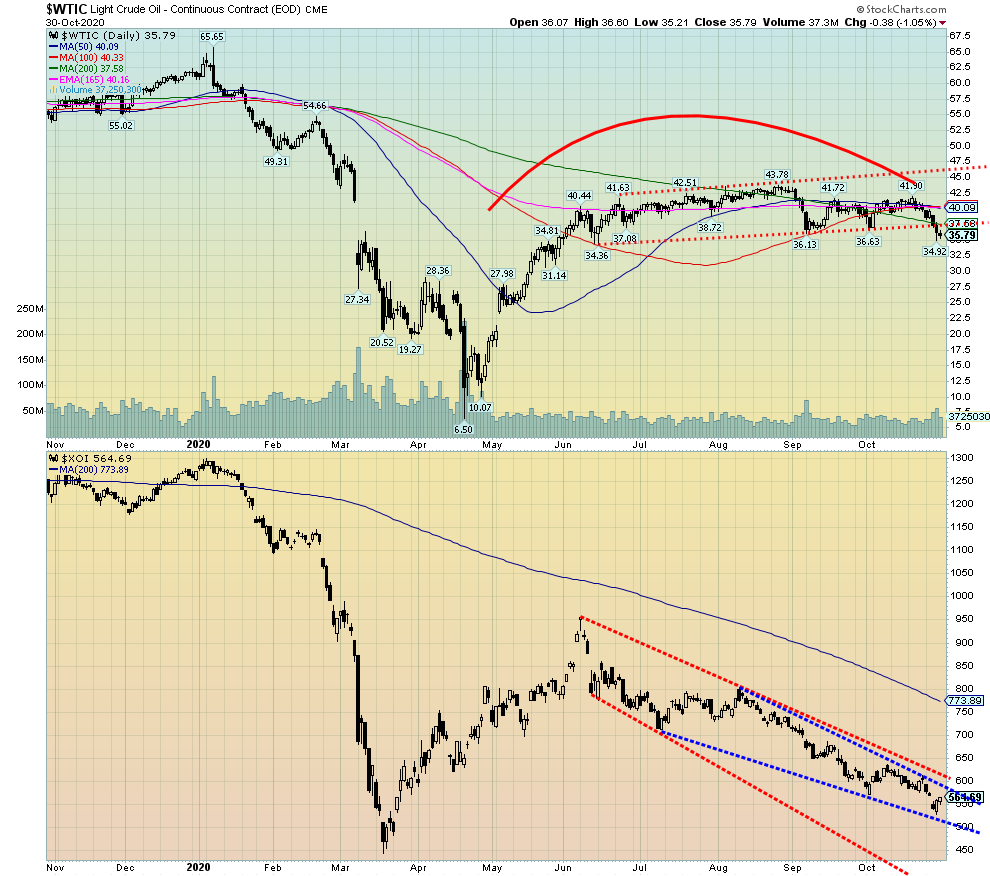
Are oil prices in the throes of breaking down? It appears that way as WTI oil fell a sharp 10.2% this past week and appears to be dropping out of the 5-month trading range. As usual, we need a final confirmation. That would come with a breakdown and close below June’s low of $34.36. So far, this past week, the low was at $34.92. The breakdown has a potential target zone of $27.50/$28.00. Only a return and close over $40 could change this growing negative scenario. On a firm breakdown under $27, WTI oil could fall as low as $21/$22.
So why did oil prices fall? Simple, in one word—COVID. As cases soar and lockdowns get underway once again, particularly in the EU, demand wanes. And looming is the potential for OPEC to not maintain its production cuts. That would once again flood the market with oil and push prices even lower. In effect, it means Saudi Arabia in particular would be leading a price war as they can withstand lower prices the best because of low production costs. This is despite the fact that Saudi Arabia needs $70/$80 to pay for its high expenses. Iraq and Kuwait are also poised to join cutting back on production cuts as it is negatively impacting their ability to pay for things. Cutting production cuts may have benefit for low-cost OPEC countries but it would destroy many others who haven’t already been destroyed. Fracking and Alberta are both already reeling from low prices and may not be able to withstand yet another price war.
If there was a bright light amongst the potential gloom it was natural gas (NG) that leaped to another 5.0% this past week once again to fresh 52-week highs. That is helping natural gas stocks. But that didn’t save the energy indices as the ARCA Oil & Gas Index (XOI) fell 6.4% and the TSX Energy Index (TEN) dropped 6.5% this past week. The XOI is down 55.6% on the year and the TEN off 56.1%. Yet both remain above their lows of the year seen during the March 2020 crash, for the moment at least.
The devastation is being seen with Exxon (XOM) reporting that they could take a $30 billion write-down largely related to their shale assets. They are also going to cut 15% of their workforce or at least 1,900 jobs. The big Cenovus (CVE)/Husky (HSE) merger is also going to see a huge exodus of around 2,500 jobs. Huge losses were reported by Husky of $5.2 billion for the third quarter.
The energy sector can’t be described any other way than it is in a depression. The question is, when will it recover, if ever?
—
(Featured image by Pixabay via Pexels)
DISCLAIMER: This article was written by a third party contributor and does not reflect the opinion of Born2Invest, its management, staff or its associates. Please review our disclaimer for more information.
This article may include forward-looking statements. These forward-looking statements generally are identified by the words “believe,” “project,” “estimate,” “become,” “plan,” “will,” and similar expressions. These forward-looking statements involve known and unknown risks as well as uncertainties, including those discussed in the following cautionary statements and elsewhere in this article and on this site. Although the Company may believe that its expectations are based on reasonable assumptions, the actual results that the Company may achieve may differ materially from any forward-looking statements, which reflect the opinions of the management of the Company only as of the date hereof. Additionally, please make sure to read these important disclosures.


Dolci Palmisano Issues Its First Minibond of the F&P “Rolling Short term” Program
Dolci Palmisano Srl issued its first €300K Short Term Minibond at 5.5%, fully subscribed on launch. Structured by Frigiolini &...


Bitcoin Traders on DEXs Brace for Downturn Despite Price Rally
Despite Bitcoin’s recent rally, over 70% of BTC options volume on DEXs like Derive.xyz are puts, signaling trader caution. Many...


Dow Jones Nears New High as Historic Signals Flash Caution
The Dow Jones is nearing a new all-time high despite past resistance, with a current BEV of -2.65%. A potential...


Stock Markets Surge Amid Global Uncertainty, But Storm Clouds Loom
The stock market hit new highs despite global tensions, with the S&P 500, NASDAQ, and TSX leading. Oil collapsed amid...


The TopRanked.io Weekly Digest: What’s Hot in Affiliate Marketing [NordVPN Affiliate Program Review]
There's a bit of a vibe in the EU right now that's slowly taking hold of everyone, from everyday consumers...
 |
|
 |  |
 |
|
-

 Markets2 weeks ago
Global Sugar Market Sees Mixed Trends Amid Weather Shifts and Price Pressures
-

 Fintech3 days ago
Kraken Launches Krak: A Game-Changing Peer-to-Peer Crypto Payment App
-

 Africa2 weeks ago
Agadir Welcomes Nearly 570,000 Tourists by May 2025
-

 Cannabis6 days ago
Record-Breaking Mary Jane Fair in Berlin Highlights Cannabis Boom Amid Political Uncertainty