Featured
The surging TSX Venture Exchange (CDNX) and its history of booms and busts
We begin the Biden era and the stock market shot once again to new all-time highs. We look at some of the challenges the incoming administration will face going forward. We also look at the huge surge in debt and explain why we don’t believe we will face a huge surge in inflation. Any inflationary push will come from commodity shortages. But what has surged in price are assets valuations in the stock market, housing market and collectible market.
The stock market celebrated the arrival of the Biden era by rallying to new all-time highs. Does that portend the start of a new up-move for the stock market? Well maybe, maybe not. One day does not make the start of a new up-trend. The new administration faces a raft of issues and challenges. The huge divisions in the country are but one of many issues. The divisions are not going to disappear overnight and may even deepen. The divisions will continue to weigh on the country both politically and economically.
Setting aside the divisions, the incoming Biden administration faces many other challenges. Among these are climate change/environment, the economic fallout from the pandemic, and inequality in income and wealth. As to the first, climate change and the environment, Biden has already rejoined the Paris climate accord that will take effect in 30 days. Second, he cancelled the Keystone XL pipeline and has instructed to review and take action on more than 100 actions on the environment. There are numerous challenges with the environment but there is also considerable opportunity and huge potential for job growth. Renewable energy stocks have been one of the strongest performers over the past year and many companies, including traditional oil and gas companies, have been making substantial investments in renewable energy. Rather than be laggards, much of the corporate world has been leading even as others, including some governments, cling to fossil fuel energy. However, use of fossil fuels is not about to end any time soon and there will, no doubt, always be a role for them.
The economic fallout from the pandemic will continue to be a major a challenge. The U.S. fell into recession in 2020, as did most of the world with exceptions (China, Taiwan) with unemployment hitting at one point a high of 14.8% (U3), the highest level since the Great Depression. Upwards of 18–20 million are receiving some kind of benefits. Over the past four years the U.S. labour force has barely grown despite population growth. The unemployment rate is at levels last seen in 2013 as the U.S. was recovering from the 2007–2009 financial crisis. The number unemployed for 27 weeks or longer is also back at levels last seen in 2013. Continued unemployment claims hit a peak of 24.9 million back in May 2020 but today still sit at over 5 million, a level well above anything ever seen before, dating even back to the Great Depression. For comparison sakes, the numbers in Canada are proportionately similar with upwards of 1.8 million persons officially unemployed the highest level seen in over 50 years. Since the onset of COVID-19 in March 2020 the total number of people employed is 636,000 fewer than were employed in February 2020.
Biden has unveiled a $1.9 trillion spending package to be funded by borrowing. The package contains $20 billion in a national vaccination programme and cheques of $1,400 to Americans on top of the $600 agreed to in December. The package includes raising the minimum wage to $15/hour and emergency jobless benefits of $400 per week. The package also includes $350 billion for emergency funding for states and local governments. Despite this ambitious package, it could still face considerable opposition through Congress and the Senate. Many of these same proposals failed earlier.
Support will continue to come from the Fed through its program of quantitative easing (QE) and maintaining a very easy monetary stance. That is not expected to change. Also, the appointment of Janet Yellen could help. Being past chair of the Federal Reserve and a well-known Keynesian, she would be supportive of accommodative programs to get things moving again.
There is also a great need to upgrade the U.S.’s infrastructure. Many roads, airports, bridges, and dams have not seen any significant upgrades since the 1950s. However, one big challenge will be the fact that skill levels needed may not match skill levels that are available. There are vacancies in many areas, including health care and professional services where there the problem is not insufficient people but insufficient training and background required to fill the positions.
Biden will also face challenges on how to reform the tax system and how to deal with the myriad of tariffs and sanctions that resulted in trade wars and foreign tensions, most notably with China, Russia, and Iran. He cannot move too fast on those as with many things there are winners and losers and the losers are always the most vocal and provide the stiffest opposition. Solving them will take considerable time and tensions will remain.
All of this is occurring against the backdrop of the coronavirus pandemic that is now approaching 100 million cases globally, with over 2 million dead. There are over 25 million cases in the U.S. with over 400,000 dead, and expectations that by mid-February the death toll will hit 500,000. In the U.S., hospitals are overrun as they run out of ICUs and beds with bodies stacked in the hallways, upwards of 200,000 businesses have either failed or are in danger of failing, and schools are flailing, caught between the need for in-house classes vs. the reality of online learning. The picture is repeated elsewhere, including here in Canada. As to the effects on the economy, the expectation is that Q1 will once again see negative growth; however, given the vaccine rollout there remains hope of a good Q2 and beyond. But will that be the reality?
The cries are out that spending to combat the pandemic is out of control, the debt is soaring, hyperinflation is coming. The attacks are coming predominantly against the aid that would go to people. No such complaining is being heard about the Fed’s QE program or support for businesses, which tends to favour large corporate interests.
But is the debt out of control if the Fed is purchasing large amounts of it? In Japan, some 70% of the debt is purchased by the Bank of Japan (BOJ), the rest by Japanese banks and trusts. That helps keep the bond yields under control and staves off inflation. In Japan, the inflation rate for 2020 was 0.1%. The 10-year bond yield is zero. The same is happening in the eurozone where the inflation rate is 0.3% for 2020 and the 10-year bond yield is negative 0.6%. In Japan, the federal debt to GDP ratio is 270% vs. 130% in the U.S. In the U.S. the inflation rate for 2020 was 1.2% and the 10-year bond yield is 1%.
Another reason why hyperinflation is possibly not likely is that the velocity of money (how quickly a $1 turns over in the economy) has plummeted over the past 30 years. It peaked in 1997 and has been falling ever since. Money, as they say, is stagnant when it should be constantly turning over. This also helps keep the inflation rate and bond yields low. While there are signs that shortages could send commodity prices higher, it is inflation caused by the shortages, not by stagflation and an oil crisis that pushed oil prices through the roof as we saw in the 1970s. Instead, given QE and hordes of liquidity being pumped into the financial system, the inflation shows up in asset inflation in stocks, houses, collectibles (i.e., coins, stamps, comic books, trading cards, dolls, board games, movies, records, books, toys, and much more – how about a Pokémon card for $180K, a mint condition Batman comic book for $2.2 million, a gold aureus of Brutus for $4.3 million, ), and yes, Bitcoin. Our chart below shows how U.S. M2 and the velocity of M2 have diverged with each other since that crossover in March 2019. Since then, M2 has soared $5.1 trillion or 35% but the velocity of M2 has fallen 21%.
Money Supply (M2) and Velocity of M2
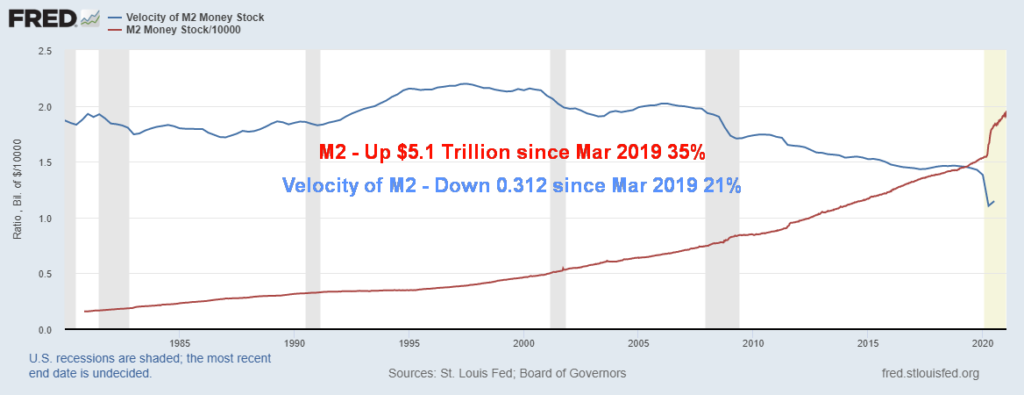
With M2 up $5.1 trillion since March 2019, we also note that the U.S. federal debt has soared $5.8 trillion or 26% and the Fed’s balance sheet has leaped $3.4 trillion or 87%. All that money sloshing around (liquidity) has resulted in the S&P 500 rising 1,060 points or 38% and personal savings have soared up $928 billion or 72% during the same period. But personal savings have been falling in recent months. At its peak in April/May 2020 personal savings had soared $5.1 trillion or 296%. The past several months have seen personal savings depleting at a rapid rate. GDP, on the other hand, is up a mere $177 billion or 0.8%. The K recovery? The rich get richer (stock market soaring) and everyone else awaits their support cheque. Inflation? What inflation? The CPI is up 3% in the same time period while the PPI is flat.
So, what does all this mean for the stock market and gold? While the stock market may face some short-term bumps, the outlook remains positive. Given our penchant for looking at cycles, one we have focused on recently is: when will the well-known 6.5-year cycle low hit again? It was last recorded in 2015/2016. The 6.5-year cycle is a sub-set of the 18-year cycle which is a subset of the 36-year cycle and is itself a subset of the 72-year cycle. Dating from 1932 (the Great Depression low), the 72-year cycle was recorded with the financial crisis low in March 2009 (77 years). That low was also 35 years from 1974, the last recorded 36-year cycle low and 1990 (or could be 1987), the last recorded 18-year cycle low. So, 2009 was an 18-year, 36-year, and 72-year cycle low. A brand new long up cycle was born in 2009. We are currently only in the 12th year. The 18-year cycle low could be expected anywhere from 2024 to 2030.
The 6.5-year cycle (range 5–8 years) has been reasonably consistent. Our chart starts with the important 1982 low (8 years from the 1974 low). Lows were recorded in 1987 (5 years), 1994 (7 years), 2002 (8 years), 2009 (5 years), and 2016 (7 years) (numbered 1–6). So, what was that March 2020 low?
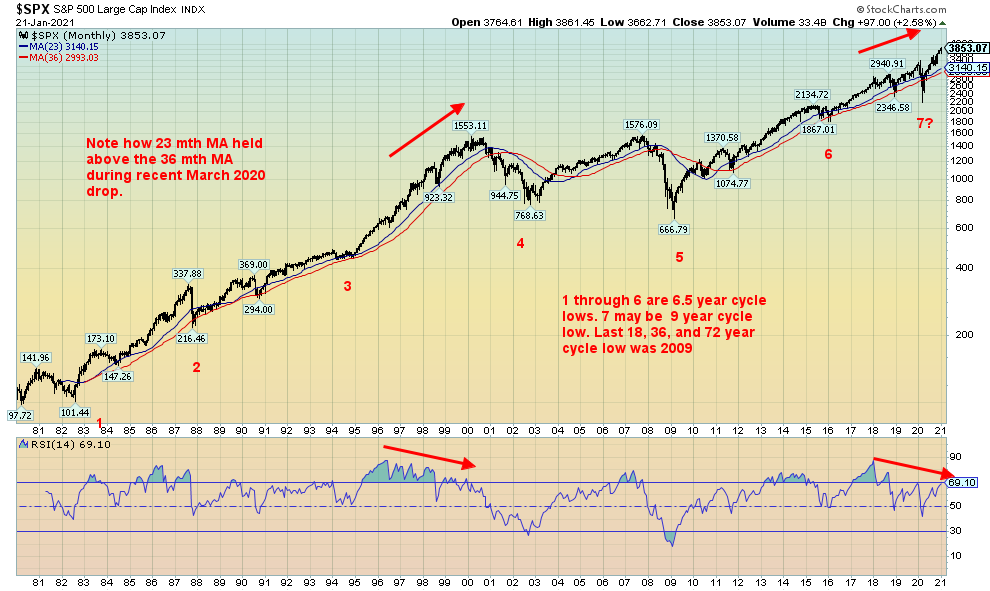
Ray Merriman of MMA Cycles (www.mmacycles.com) has noted that sometimes the 18-year cycle exhibits both a series of 3–6.5-year cycles and even 2–9-year cycles. That latter is rare but happens. The March 2020 low came 11 years after the 2009 low so it is within the range of 7–11 years for the 9-year cycle low. It was also only 4 years from the 2016 low so it was too early for the 6.5-year cycle but perfect for a shorter 4 year cycle low. Since we have moved to new all-time highs once again, this tells us the 18-year cycle is alive as is the current 6.5-year cycle. Furthermore, we are in the throes of a new 9-year cycle. The next 6.5-year cycle low would be due from 2021–2024 and if we are correct it should not be below the March 2020 low. The question is, when will this cycle peak?
While we could be facing a near-term correction, we should come out of it and once again soar to new highs. The peak of the current cycle could, we suspect, come by September and then we would enter into the 6.5-year cycle low that could come in 2022. If we are still making new highs into 2022, then the cycle low would come a bit later in the year or 2023. All this suggests that we are going higher still and one could purchase pullbacks in the market. We would expect that any interim correction would not exceed 10%. One thing of note is with the RSI indicator. Note how it is diverging with the price action as the RSI makes lower highs while the S&P 500 goes higher and higher. It is merely an indicator. It doesn’t tell us when things will break. But note how the same thing happened from 1995–2000. What followed was the high-tech/dot.com crash of 2000–2002. Again, it’s a warning. It does not exactly tell us when we have topped, but if the previous one is any guide, we should be in the final throes of this one. The top should occur this year.
What about gold? Gold peaked in August 2020 at $2,089. Since then, we have been in a corrective mode that is now into its fifth month. We have noted previously that we have been looking for our 31.3-month cycle low. The 31.3-month cycle is a subset of the 7.83-year cycle which is a subset of a possible 23–25-year cycle. The last 23–25-year cycle bottomed in 1999 and 2001. The next one is due anywhere from 2022 to 2026. The last 7.83 cycle low was last recorded in December 2015 and the prior one was in October 2008. We are currently the third and final 7.83-year cycle of the longer 23–25-year cycle. It is due next anywhere from 2021 to 2025. So, it overlaps the 23–25-year cycle. The 31.3-month cycle was last recorded in August 2018 at $1,167 which fit well counting from the December 2015 low. This would be the second one from 2015 and is due April 2021 +/- 5 months. So far, we have the November 30 low at $1,767, but admittedly it was a tad early. So, it may be our low, but it also may not be. We could still see a new low in the next few weeks. Gold has struggled to get itself above $1,900 recently and bigger resistance is seen at $1,950/$1,960. Once those are taken out and we clear over $2,000 once again new highs should be seen with potential targets up to $2,200/$2,400.
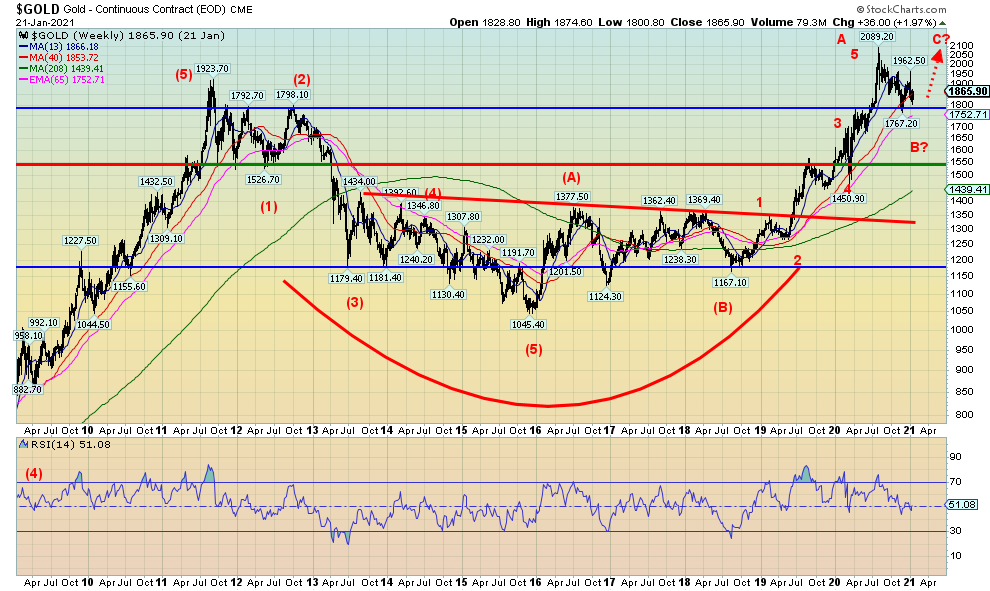
The 31.3-month cycle low will be confirmed once we take out the recent high at $1,962. Trading into options expiration (due January 29, 2021) could also bring us our low. The current bottom of the channel is near $1725 and under no circumstances would we want to see gold fall under $1,700 as that could signal the start of our descent into the 7.83-year cycle low and 23–25-year cycle low. We doubt it and believe that crest could come later this year or even into 2022. Once we find this low, we should embark on our final 31.3-month phase. The 7.83-year cycle can also create a half-cycle low of 4 years. That cycle may have made a bottom back in March 2020 as it was within range of 4 years 3 months. Since we made new highs after, that told us that the cycle once again had shifted to the upside.
A positive sign for gold has been the performance of silver and platinum. Platinum has been making fresh 52-week highs even as gold and silver struggle. Silver has been holding its 100-day MA even as gold has been struggling to hold its 200-day MA and remains below its 100-day MA. The gold/silver ratio is currently at 72.63 well below its peak of 131.41 seen in March 2020. With both silver and platinum leading this portends well for gold going forward. Silver in particular tends to lead in both bull and bear markets. With silver leading it tells us that we remain in a bull market and we should go higher once this corrective period is over.
The bottom line is, only new highs can absolutely confirm that we are in the final 31.3-month cycle phase of the current 7.83-year cycle and that the next crest or peak could be quite important. After that we could likely see our steepest decline since 2013.
Continued liquidity, continued low interest rates, and the bulk of the funds falling into the hands of the banks and dealers tells us that we should continue our upward march following any near-term pullback. That holds for both the stock market and the gold market.
Chart of the Week
If you enjoy roller-coaster rides, then you will love trading on the TSX Venture Exchange (CDNX). Wild rides up and down appear to be de rigueur. The CDNX began trading on November 29, 1999 and was purchased by the TSX Group in 2001. The CDNX was the amalgamation of the old Vancouver Stock Exchange (VSE), the Alberta Stock Exchange (ASE), and the junior venture companies from the Montreal Stock Exchange (MSE) as well as a number of junior companies from the TSX’s Canadian dealing network. The old VSE was known as the wild, wild west filled with colourful characters, scams, and scandals.
The CDNX has over 1,600 companies listed of which roughly 400 make up the S&P/TSX Venture Composite Index. Mining companies make up a slight majority of the listed companies (53%) with another 15% from the energy sector. The remainder cover a wide range of companies in technology, biotech, industrials, utilities, finance, consumer and more, not dissimilar to what one would find on the big board S&P/TSX Stock Exchange. Market cap of all the companies exceeds $50 billion. The CDNX has been most compared with the NASDAQ’s OTCBB, a small cap exchange. Companies not able to meet the CDNX’s listing requirements usually trade on the NEO Exchange. Canada also has the Canadian Securities Exchange (CSE), the Montreal Exchange (MX) that trades derivatives, and NASDAQ Canada.
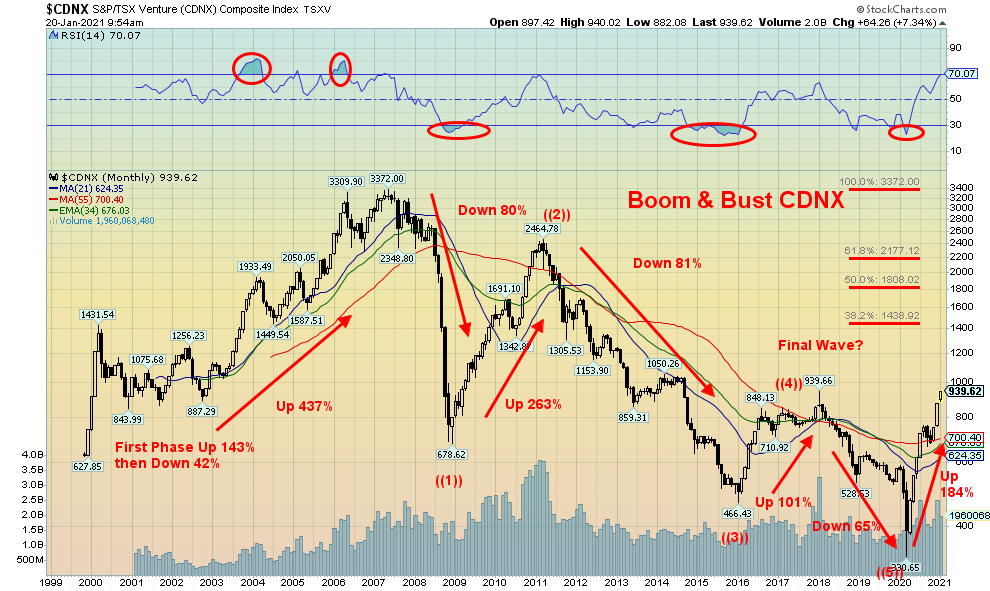
The focus here is the CDNX. It has been a wild ride. 1999–2007 up 437%, 2007–2008 down 80%, 2008–2011 up 263%, 2011–2015/2016 down 81%, 2016–2018 up 101%, and 2018–2020 down 65%. Are you out of breath yet? Since that low in March 2020 the CDNX has been on another tear to the upside, some 184% to date. The best part is that is that run does not appear to be over.
Given the short history of the CDNX it may be a bit early to try and determine what cycles may exist. But based on the limited number of observations we note the following: Nov 1999–Dec 2008 – 9 years 1 month; Dec 2008–Jan 2016 – 7 years 1 month; Jan 2016–Mar 2020 – 4 years 2 months. Average: 6 years 9 months. However, if we use instead the low seen in October 2002, a point that corresponds to lows in the large cap indices, as our starting point then the first run becomes Oct 2002–Dec 2008 – 6 years 2 months and our average falls to 5 years 10 months. That could indicate the possibility of a 6-year cycle with a range of 4-8 years. That would peg our next major low to be 2026 with a range from 2024–2028. Wide, of course. That cycle somewhat corresponds to the 6.5-year cycle we observed in the stock market.
Typically cycles subdivide into either 2 or 3 so the 6-year cycle could be two 3-year cycles or three 2-year cycles. That would suggest a possible low, but not necessarily the final low sometime in 2022 or 2023. Now how high could the CDNX go?
The current run on the CDNX has cleared the 21-month and 55-month MAs and 34-month EMA. This is the first time since Jan 2018. The question is, can it hold above that level? Quite likely yes because volume has been strong on this up move. The March 2020 low appears to have culminated in five waves down from the May 2007 top. There is a strong probability this up move is therefore a major corrective wave to the 2007–2020 decline. But how high could we go?
Fibonacci retracement levels can be seen at 38.2% – 1,438, 50%, 1,808 and 61.8% 2,177. An interim Fibonacci retracement level is at 23.6% or at 1,021. At minimum, we should achieve that target that is currently only about 90 points away. Resistance can be seen between the January 2018 high and the March 2014 high at 1,050. So, there is a possibility of a pause through here. Once above 1,050 the next target could be the 38.2% retracement level. There would be little in the way of resistance above 1,050. The 21-month MA has not yet crossed over the 55-month MA. If that occurs, that would be another positive sign as that has not taken place since briefly in 2011. Other possible targets we can see are 1,220, a swing target based on the January 2018 high and the March 2020 low. That would also be equivalent to the run-up October 2008 to the March 2011 high. A run equivalent to the run-up to the May 2007 high could see a target of 1850-1900.
No matter how we currently look at the CDNX, the potential for higher prices is strong from both a cyclical and technical viewpoint. In strong bull markets the small caps lead the way and the CDNX has done that, making consistent 52-week highs of late. Once we take out 1,050, we could go on a stronger upside run. However, one thing is for certain with the CDNX: it’s a wild ride—up and down. Oh yes, and the ride up is a lot more fun.
MARKETS AND TRENDS
| % Gains (Losses) Trends | |||||||
| CloseDec 31/20 | CloseJan 22/21 | Week | YTD | Daily (Short Term) | Weekly (Intermediate) | Monthly (Long Term) | |
| Stock Market Indices | |||||||
| S&P 500 | 3,756.07 | 3,841.47 (new highs) | 1.9% | 2.3% | up | up | up |
| Dow Jones Industrials | 30,606.48 | 30,996.88 (new highs) | 0.6% | 1.3% | up | up | up |
| Dow Jones Transports | 12,506.93 | 12,856.54 | (0.7)% | 2.8% | up | up | up |
| NASDAQ | 12,888.28 | 13,543.06 (new highs) | 4.2% | 5.1% | up | up | up |
| S&P/TSX Composite | 17,433.36 | 17,845.91 | (0.4)% | 2.4% | up | up | up |
| S&P/TSX Venture (CDNX) | 875.36 | 947.43 (new highs) | 4.3% | 8.2% | up | up | up |
| S&P 600 | 1,118.93 | 1,231.70 (new highs) | 1.6% | 10.1% | up | up | up |
| MSCI World Index | 2,140.71 | 2,179.62 | (1.4)% | 1.8% | up | up | up |
| NYSE Bitcoin Index | 28,775.36 | 35,910.10 | (12.0)% | 24.8% | up | up | up |
| Gold Mining Stock Indices | |||||||
| Gold Bugs Index (HUI) | 299.64 | 288.84 | 1.5% | (3.6)% | down | down (weak) | up |
| TSX Gold Index (TGD) | 315.29 | 310.93 | 1.4% | (1.4)% | down | down | up |
| Fixed Income Yields/Spreads | |||||||
| U.S. 10-Year Treasury yield | 0.91 | 1.09% | flat | 19.8% | |||
| Cdn. 10-Year Bond yield | 0.68 | 0.84% | 3.7% | 23.5% | |||
| Recession Watch Spreads | |||||||
| U.S. 2-year 10-year Treasury spread | 0.79 | 0.97% | (1.0)% | 22.8% | |||
| Cdn 2-year 10-year CGB spread | 0.48 | 0.66% | 1.5% | 37.5% | |||
| Currencies | |||||||
| US$ Index | 89.89 | 90.75 | 0.8% | 1.0% | neutral | down | down |
| Canadian $ | 0.7830 | 0.7860 (new highs) | flat | 0.3% | up | up | neutral |
| Euro | 122.39 | 121.69 | 0.8% | (0.6)% | neutral | up | up |
| Swiss Franc | 113.14 | 112.95 | 0.7% | (0.2)% | up | up | up |
| British Pound | 136.72 | 136.84 (new highs) | 0.7% | 0.1% | up | up | up |
| Japanese Yen | 96.87 | 96.36 | 0.1% | (0.5)% | neutral | up | up |
| Precious Metals | |||||||
| Gold | 1,895.10 | 1,856.20 | 1.4% | (2.1)% | neutral | neutral | up |
| Silver | 26.41 | 25.56 | 2.8% | (3.2)% | neutral | up (weak) | up |
| Platinum | 1,079.20 | 1,111.60 (new highs) | 2.0% | 3.0% | up | up | up |
| Base Metals | |||||||
| Palladium | 2,453.80 | 2,365.20 | (1.3)% | (3.6)% | neutral | up | up |
| Copper | 3.52 | 3.63 | 0.8% | 3.1% | up | up | up |
| Energy | |||||||
| WTI Oil | 48.52 | 52.27 | (0.3)% | 7.7% | up | up | neutral |
| Natural Gas | 2.54 | 2.46 | (10.2)% | (3.2)% | down | up (weak) | neutral |
—
(Featured image by Pixabay via Pexels)
DISCLAIMER: This article was written by a third party contributor and does not reflect the opinion of Born2Invest, its management, staff or its associates. Please review our disclaimer for more information.
This article may include forward-looking statements. These forward-looking statements generally are identified by the words “believe,” “project,” “estimate,” “become,” “plan,” “will,” and similar expressions. These forward-looking statements involve known and unknown risks as well as uncertainties, including those discussed in the following cautionary statements and elsewhere in this article and on this site. Although the Company may believe that its expectations are based on reasonable assumptions, the actual results that the Company may achieve may differ materially from any forward-looking statements, which reflect the opinions of the management of the Company only as of the date hereof. Additionally, please make sure to read these important disclosures.


Morocco’s Growth Holds at 4.6% as Agriculture Offsets Economic Pressures
Morocco’s economy grew 4.6% in Q1 2026, driven by a strong agricultural rebound offsetting declines in industry. Services expanded moderately...


Abivax Shares Surge as New Trial Data Eases Safety Concerns Over Ulcerative Colitis Drug
Abivax shares surged nearly 36% after positive updated trial results for its ulcerative colitis drug obefazimod reassured investors following earlier...


El Dorado Raises $9M to Expand Cross-Border Fintech Platform
El Dorado, a Latin American fintech improving cross-border financial services, raised a $9 million Series A led by Paradigm with...


Bitcoin Stalls Near $60K as Strategy Moves, ETFs Outflow, and EU MiCA Rules Take Effect
Bitcoin hovers near $60,000 with ETF outflows, while Strategy boosts reserves, sells BTC, and raises dividends to reassure investors. Ethereum...


Cannabis Dominates Global Drug Use: Trends, Risks, and Shifting Markets
Cannabis remains the world’s most widely used illicit drug, with 256 million users in 2024, surpassing all others combined. Growth...
 |
|
 |  |
 |
|
-

 Impact Investing1 week ago
EU Weighs More Free Emission Permits in ETS Review to Boost Industry Competitiveness
-

 Impact Investing2 weeks ago
SBTi Net-Zero Standard 2.0 Enhances Corporate Climate Action
-

 Crypto5 days ago
Bitcoin and Ethereum Slide as Market Pressure Builds Amid Strategy Concerns and Layer 2 Disruptions
-

 Business2 weeks ago
Fed Policy Shift Raises Concerns Over Debt and Inflation Risks