Business
The Broader Stock Market is still Making New Highs but not Everyone is Joining the Party
To taper or not to taper. That has been a burning question with the markets and central banks. We have a look at some history of tapering and what does it mean for the markets. We also look at the massive growth of central banks balance sheets. Our Chart of the Week looks at the TSX Financial Index the sector that has been on a tear since the March 2020 pandemic crash.
- Tapering is the theoretical reversal of quantitative easing (QE) policies; QE policies are implemented by a central bank and are intended to stimulate economic growth
- Tapering refers specifically to the initial reduction in the purchasing of and accumulation of central bank assets
- As a result of their dependence on sustained monetary stimulus under QE, the financial markets may experience a downturn in response to tapering; this is known as a “taper tantrum”
- Taper tantrums may lead central banks to promptly re-accelerate asset purchases (and essentially, reverse the process of tapering)
- As a result, central banks, once having embarked on QE policies, have for the most part not been able to sustainably unwind their expanded balance sheets; tapering remains a mostly theoretical option
Source: www.investopedia.com
To taper, or not to taper—that is the question. To taper refers to the massive amounts of quantitative easing (QE) that central banks, acting on behalf of the government, have injected into markets to prevent a financial and economic meltdown that could have plunged the world into an unknown magnitude of an economic depression. Thousands, if not millions, would lose their jobs and without support could be plunged into poverty.
At risk of sounding like The Economist and its excellent article on the subject “Central banks face a daunting task: tapering without the tantrum” (The Economist,July 4, 2021), we can note that those who believe and support QE view it as an essential central bank tool to prevent that very meltdown and economic collapse. On the other hand, with all that money being pumped into the financial system, it has created asset bubbles in stocks, housing, collectibles, and more. As well, it has further widened the equality gap as a few have become extremely wealthy while many more hang on with their fingernails to survive. It has also raised fears of hyperinflation. The question now is, is it still useful and should it be continued? Or as they say, tapered?
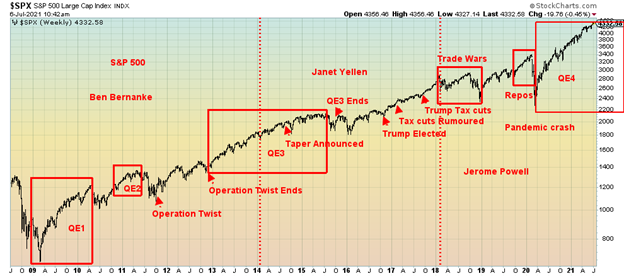
Since 2008, the balance sheets of the major central banks (Swiss National Bank (SNB), Bank of England (BOE), Bank of Japan (BOJ), Federal Reserve (FED), European Central Bank (ECB)) have swelled from under $4 trillion to almost $26 trillion. The pandemic period 2020–2021 has seen their balance sheets leap $11.7 trillion. The rise has been relentless with barely a pause. The most notable pause as far as the stock market was concerned came from August 2015 to February 2016 when the DJI fell 14.5%. The NASDAQ was hit a little harder, down 18.2%.
Quantitative easing (QE) became a phrase in the financial world as a result of the 2008 financial crisis. To protect the economy and help the banks maintain liquidity the Fed embarked on a program of buying U.S. treasury notes and bonds along with mortgage-backed securities and other longer-term instruments designed to help bring down interest rates. The Fed also dropped the key lending rate, known as the Fed rate, to 0%–0.25%. In the euro zone and Japan interest rates went negative. The program was originally seen as temporary to help stimulate the economy and have a positive effect on inflation and employment.
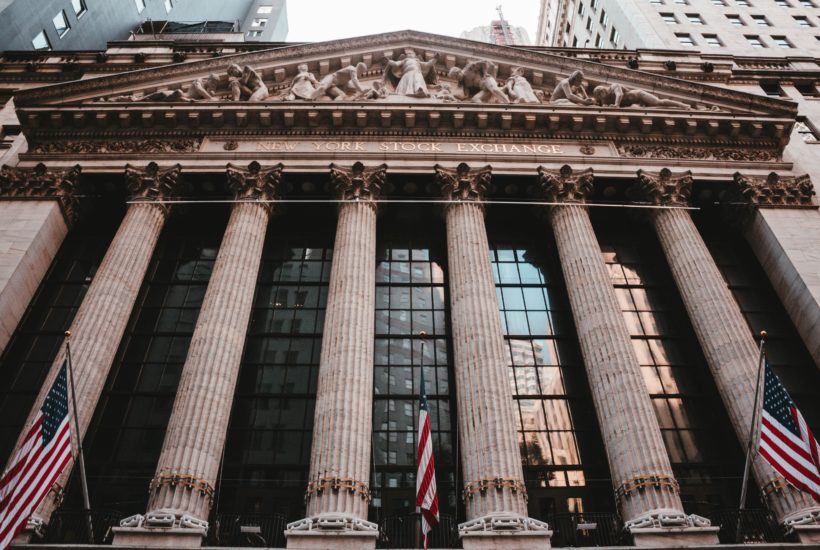
The word “taper” first came into being in May 2013 when then Fed Chairman Ben Bernanke said that the Fed may taper, or reduce, its bond-buying program (QE). While the stock market didn’t react much to the news, the bond market saw the 10-year U.S. treasury note rise from 1.78% in May 2013 to 3.04% by December 2013. Everyone expected the Fed to start tapering. Gold plunged as a result and a major bear market got underway. But at their September 2013 meeting things were left as is. However, by December 2013 the Fed thought they could taper and they eased from $85/month to $75 billion/month. The hope was that this wouldn’t disrupt things too much. The Fed continued to cut back through 2014.
In December 2015 the Fed surprised by hiking the Fed rate 0.25%. Surprisingly, the 10-year after peaking in December 2013 slowly retreated and by December 2015 it had fallen to near 2.00%. Hiking rates didn’t spook the market and by July 2016 the 10-year had fallen to 1.37%. Not so the stock market that feared rising rates from the Fed. As we noted, the DJI fell 14.5% from May 2015 to February 2016. There was some fear of a recession once again. Gold responded by having its strongest rally in five years from December 2015 to July 2016.
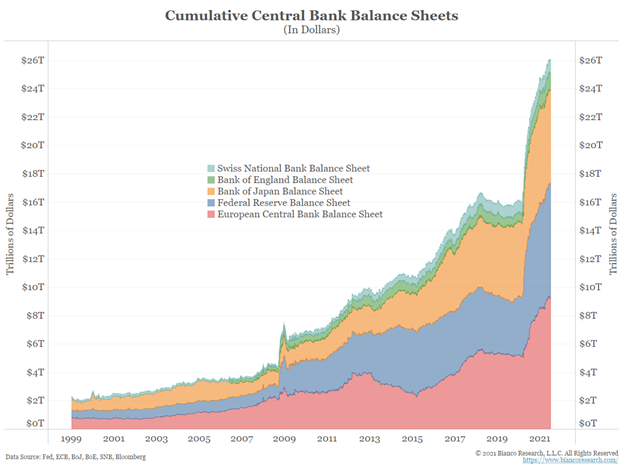
Fed Balance Sheet, U.S. 10-Year Treasury Note, Dow Jones Industrials, Fed Funds 2008–2021
In October 2017 the Fed introduced another word to the financial world—quantitative tightening (QT). Instead of buying bonds or doing nothing at all, the Fed announced it would instead reduce its balance sheet. Call it reverse QE. After peaking at $4.5 trillion in February 2015, the Fed’s balance sheet began to reduce and by August 2019 it had fallen to $3.8 trillion. The election of Donald Trump in November 2016 and thoughts of a massive tax cuts kept the stock market rising all through 2017. Interest rates began to slowly creep back up and all along the Fed kept hiking the Fed rate. From July 2016 through to November 2018 the 10-year U.S. treasury note rose from 1.37% to 3.22%. The Fed rate was hiked under both Fed Chair Janet Yellen 2014–2018 and Jerome Powell 2018–present, hitting a high of 2.50% by December 2018.
Trade wars and fears of rising interest rates helped shake the stock markets starting in January 2018. By December 2018 the DJI had fallen 18.4%. The Fed announced it wouldn’t hike interest rates further and that eased the stock market as it went on another tear, topping out in February 2020. Then came the pandemic.
But before that the Fed was doing strange things. In August 2019, despite the economy remaining relatively strong, they lowered interest rates by 0.25%. They did it again in September and October. The Fed also started a repo program in September 2019. The Fed’s balance sheet began to grow again. By February 2020 the Fed’s balance sheet was up over $400 billion. What was the Fed concerned about? Then came the pandemic.
So, could talk of tapering lead to another taper tantrum à la 2013? The Fed has also talked of hiking interest rates but not until 2023. We noted that in 2013 bonds sold off (yields move inversely to prices), the U.S. dollar rose, emerging markets saw capital outflows and gold plunged. Interest rates had been rising as the 10-year U.S. treasury note rose from 0.52% in August 2020, hitting a high of 1.74% by March 2021. This was all on expectations. But then a strange thing happened. The 10-year began to fall again (prices rose) and was last seen at 1.32%. Fear of rising interest rates? Maybe the bond yields are falling because of fear of another recession? August 2020 also proved to be a top in the gold market as gold fell 20% over the next several months.
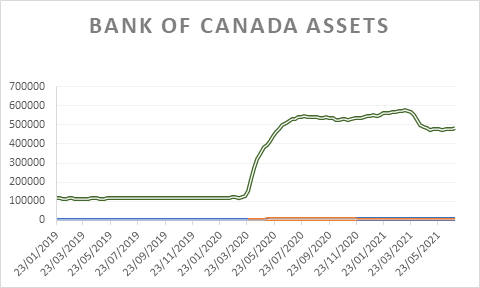
Some central banks have already started to taper. The Bank of Canada started to wind down in April 2021. Their assets have fallen from a peak of $575 billion in March 2021 to $481 billion at the end June 2021. Assets were $119 billion in March 2020 at the outset of the pandemic. The Reserve Bank of Australia announced they would start to wind down in September 2021. The BOE is approaching its target and is likely to stop purchasing. They’ve even mused about selling off assets. The Reserve Bank of New Zealand has announced they would not make all of their purchases and the ECB is wondering how it might wind down its QE.
QE and lowering official interest rates to effectively zero may have saved the economy and helped suppress any major rise in interest rates. However, it has ballooned the central banks balance sheets to unheard-of levels. As a percentage of GDP, it is also at unheard-of levels. The Fed stands at about 37% of GDP but the BOJ is at 134% of GDP, the ECB at 82%. The Fed almost appears to be “chumpers” compared to the others. There is so much money sloshing around as a result of QE that the Fed has been conducting reverse repos daily since April 2021, hitting a high of $992 billion on June 30, 2021. Spikes in the past usually occurred at month ends, quarter ends, or year ends to drain excess cash from the banking system. Now it’s everyday.
The central banks have been buying up debt. The Fed now owns over 18% of all U.S. government debt of $28.4 trillion. Lately they have been purchasing over half of the bond issues. Monetization of the debt? The BOJ owns an even larger percentage of Japan’s debt.
QE and zero percent interest rates are like a drug. Once you have it you don’t want to go back to the old ways. That is why a taper tantrum might upset markets. Take away the punch bowl and suddenly the markets are not so much fun anymore. What goes up comes down even faster. The Fed tries to be careful in its wording so that the market is not surprised. The Fed largely controls the short end of the yield curve through the Fed rate, but they cannot control the long end of the yield curve. But what if inflation rose faster than they expected? Could that panic the Fed into hiking rates? The Fed can calm markets in the midst of a crisis (2008 financial crisis, the pandemic) but what happens when things begin to normalize? How does the Fed’s monetary policy gel with the governments fiscal policy? The Federal government wants to or is embarking on huge spending programs. Will the Fed remain accommodative for them? The Fed is supposed to operate independently of the government.
Currently, the central banks are effectively purchasing long-term bonds but financing them with short-term bank deposits (reserves), other deposits, and reverse repos. That’s a profitable operation actually, even though the Fed is not supposed to be really making a profit. In banking parlance, it has long been the case—lend long, borrow short, and ride the yield curve with positive carry.
A taper tantrum and especially another round of quantitative tightening would spook markets. Bond yields could rise and that in turn triggers a rise in other interest rates like mortgages. The gold market could teeter and fall like it did in 2013. The stock market could fall. It wouldn’t take much of a hike today to spark considerable concern in the markets. After all, when you are enjoying the drug (QE, low interest rates) you don’t want it taken away. It was William McChesney Martin, 9th Chair of the Federal Reserve 1951–1970 under five presidents (Truman, Eisenhower, Kennedy, Johnson, and Nixon) who famously quipped, “The job of the Federal Reserve is to take away the punch bowl just when the party is getting good.”
Canada’s Job Numbers
Canada Unemployment Rate, Employment Change 2016-2021
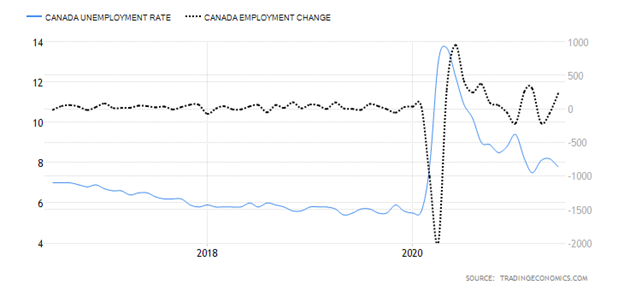
Halleluiah! Canada created 230,700 jobs in June as the pandemic restrictions were eased. That was above the forecast of 195,000 jobs. That’s the good news. The bad news is that 263,900 of the jobs were part-time, falling mostly to the 15–24 age group. Full-time employment actually fell 33,200. For full-time employment, that follows a loss of 142,800 jobs in April and May. Part-time employment fell 54,200 in May and 78,000 in April. Overall, the gain in June failed to make up for the job losses in April and May. The gain of 234,700 jobs in June does not quite make up for the 275,000 jobs that were lost in April and May as restrictions took hold. However, Canada has recouped 2,684.5 thousand jobs of the 3,004.5 thousand jobs that were lost in April/May 2020. That’s an 89% recovery rate, well above the rate for the U.S. which stands at 70%.
The unemployment rate fell to 7.8%, slightly above the forecast of 7.7%. The R8 unemployment rate that takes into consideration discouraged searchers, those waiting to be called back, and involuntary part-timers fell to 10.1%, down from 11.3% in May. That rate peaked at 18.3% in May 2020. The labor force participation rate rose to 65.2% from 64.6% as more people returned to the labor force. The labor force rose 443,700 in June to 19,159.5 thousand. Those employed rose to 18,787.9 thousand from 18,559.2 thousand. The total number unemployed (official unemployed) fell to 1,591.6 thousand from 1,652.3 thousand.
Total hours worked are 4% below pre-pandemic levels and little changed in June. The number working from home fell by 400 thousand to 4.7 million. However, self-employed workers fell by 63,000 and that’s down 7.2% from February 2020. Employment increased in Ontario, Quebec, British Columbia, and Nova Scotia but fell in Saskatchewan, Manitoba, and Prince Edward Island. The other provinces were largely unchanged. Youth employment in the 15–24 age group jumped 164,000 in June, the highest seen since July 2020. Little was said about how much of this was just summer employment as many young people continue to struggle to find work. Accommodation and food services saw an increase in employment of 101,000. Private sector employment jumped by 251,000, accounting for most of the gain in June. Vacancies remain high in retail trade and leisure and accommodation as many are reassessing their career goals and many women cannot find child care. Many women are also reluctant to go back to work in the toxic environment of the restaurant industry.
While increasing vaccination rates and an ease in the pandemic numbers have helped employment and allowed the reopening of restaurants, bars, and retail stores, many remain closed, in patio-only mode, or with a limited number in the store at a time. Things are primed to open up further in another week but lingering in the background is the Delta variant of COVID. That the report showed a big jump in part-time employment while full-time employment fell is disappointing. Part-time work is not only few hours but also low pay, often minimum wage. Overall, we view this report as a disappointment, despite Canada’s track record on the employment front actually being better overall than the U.S.’s.
Chart of the Week
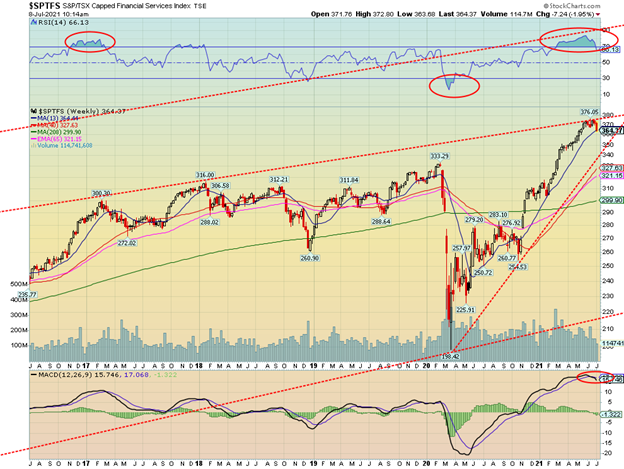
Since the March 2020 pandemic crash, the TSX Financials Index (TFS) has been on a tear, up almost 90% at its recent peak. Since then, it has fallen just over 3%, signalling that a top might be in. We note that since February 2021 the weekly RSI indicator has been consistently over 70. The monthly RSI only recently crossed over 70. The weekly MACD indicator has crossed over to the downside for the first time since February 2020. The TSX Financials are the largest sub-index in the TSX Composite, representing almost 30% of the index.
Components of the TSX Financials Index include the major banks (RY, TD, BMO, BNS, BMO, CM, NA) but also Canada’s major insurance companies (FFH, GWO, IAG, IFC, MFC, SLF). In addition to the banking behemoths and insurance companies, the TSX Financials Index also holds a number of alternative financial companies, smaller banking institutions, and wealth management and independent brokerage firms. Some will fare better than others if the financial sector turns down.
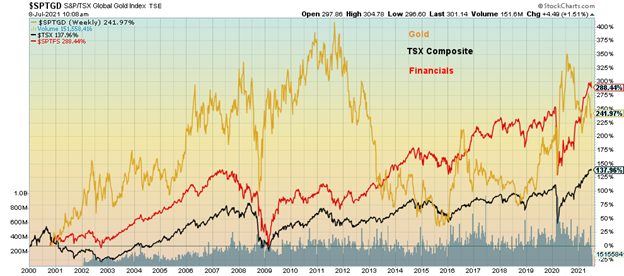
Not only has the TSX Financials Index been the best-performing index since the March 2020 pandemic crash, but the TFS has now taken the lead as the best-performing sub-index since 2000, recently edging out the TSX Gold Index (TGD). The gain since 2000 is almost 289% vs. Gold’s gain of 239%.
Performance TSX Gold, Financials and TSX Composite 2000-2021
The financial stocks, particularly the banks, are well known for their dividend yields and stable and growing dividends. Many of the components, particularly the large banks and insurance companies, are staples of conservative blue-chip portfolios.
But the sector is not immune to general market conditions. Financials tend to be strong performers in good times but can take big hits during sharp downturns. During the 2008 financial crisis the TFS fell almost 60% vs. a decline in the TSX of about 50%. The corrective period in 2015–2016 saw the TFS fall 21% vs. the TSX down 26%. But during the March 2020 pandemic crash the TFS fell about 38% vs. the TSX, down 40%.
Given the persistent overbought conditions that dominated the TFS Index over the past five months plus the first sell signal from the MACD in over a year, caution is now advised and some may choose selective profit-taking. With bond yields currently headed lower, that could also impact bank profits as their spreads tend to narrow in a low interest rate environment. Higher inflation would also be a negative for the sector. When the tide turns, the moves can be dramatic.
MARKETS AND TRENDS
| % Gains (Losses) Trends | ||||||||
| Close Dec 31/20 | Close Jul 9/21 | Week | YTD | Daily (Short Term) | Weekly (Intermediate) | Monthly (Long Term) | ||
| Stock Market Indices | ||||||||
| S&P 500 | 3,756.07 | 4,369.55 (new highs) | 0.4% | 16.3% | up | up | up | |
| Dow Jones Industrials | 30,606.48 | 34,870.16 | 0.2% | 13.9% | up | up | up | |
| Dow Jones Transports | 12,506.93 | 14,842.77 | (1.3)% | 18.7% | down | up | up | |
| NASDAQ | 12,888.28 | 14,639.33 (new highs) | 1.9% | 13.6% | up | up | up | |
| S&P/TSX Composite | 17,433.36 | 20,257.95 (new highs) | 0.2% | 16.2% | up | up | up | |
| S&P/TSX Venture (CDNX) | 875.36 | 938.47 | (3.1)% | 7.2% | down | up (weak) | up | |
| S&P 600 | 1,118.93 | 1,359.58 | (0.7)% | 21.5% | up | up | up | |
| MSCI World Index | 2,140.71 | 2,310.04 | (0.7)% | 7.9% | down | up | up | |
| NYSE Bitcoin Index | 28,775.36 | 33,556.14 | 0.1% | 16.6% | down | neutral | up | |
| Gold Mining Stock Indices | ||||||||
| Gold Bugs Index (HUI) | 299.64 | 268.95 | (0.5)% | (10.2)% | down | down | up | |
| TSX Gold Index (TGD) | 315.29 | 299.53 | 1.0% | (5.0)% | down | down | up | |
| Fixed Income Yields/Spreads | ||||||||
| U.S. 10-Year Treasury Bond yield | 0.91 | 1.35% | (5.6)% | 48.4% | ||||
| Cdn. 10-Year Bond CGB yield | 0.68 | 1.32% | (3.7)% | 94.1% | ||||
| Recession Watch Spreads | ||||||||
| U.S. 2-year 10-year Treasury spread | 0.79 | 1.13% | (5.0)% | 43.0% | ||||
| Cdn 2-year 10-year CGB spread | 0.48 | 0.82% | (11.0)% | 70.8% | ||||
| Currencies | ||||||||
| US$ Index | 89.89 | 92.12 | (0.3)% | 2.5% | up | neutral | down | |
| Canadian $ | 0.7830 | 0.8030 | (0.9)% | 2.5% | down | up (weak) | up | |
| Euro | 122.39 | 118.81 | 0.1% | (2.9)% | down | neutral | up | |
| Swiss Franc | 113.14 | 109.43 | 0.8% | (3.3)% | down (weak) | down (weak) | up | |
| British Pound | 136.72 | 138.98 | 0.5% | 1.7% | down | up (weak) | up | |
| Japanese Yen | 96.87 | 90.81 | 0.9% | (6.3)% | neutral | down | down | |
| Precious Metals | ||||||||
| Gold | 1,895.10 | 1,810.60 | 1.5% | (4.5)% | down (weak) | down (weak) | up | |
| Silver | 26.41 | 26.23 | (1.0)% | (0.7)% | down | neutral | up | |
| Platinum | 1,079.20 | 1,095.70 | 0.7% | 1.5% | down | neutral | up | |
| Base Metals | ||||||||
| Palladium | 2,453.80 | 2812.00 | 0.7% | 14.6% | up (weak) | up | up | |
| Copper | 3.52 | 4.35 | 1.6% | 23.6% | down (weak) | up | up | |
| Energy | ||||||||
| WTI Oil | 48.52 | 74.56 (new highs) | (0.8)% | 53.7% | up | up | up | |
| Natural Gas | 2.54 | 3.66 | flat | 44.1% | up | up | up |
New highs/lows refer to new 52-week highs/lows and in some cases all-time highs.
Will the Delta variant upset the recovery? That seems to be a question that is gaining some credence. However, you’d never know it as this past week the S&P 500 and the NASDAQ once again made new all-time highs. The S&P 500 gained 0.4% while the NASDAQ was also up 0.4%. That, despite the hiccup on Thursday when markets took a tumble before recovering on Friday. But not everyone is joining the all-time high party. The Dow Jones Industrials (DJI) did not, even as it gained 0.2% on the week. The Dow Jones Transportations (DJT) definitely did not as it is now diverging with its cousin the DJI. The DJT fell 1.3%. Small-cap stocks didn’t fare well either as the S&P 600 dropped 0.7%. Small-cap stocks usually lead in a bull market and lead to the downside in a bear market. With the DJI close once again to new all-time highs watch carefully for divergence with the DJT that is nowhere near its all-time high.
Joining the all-time high party were the NASDAQ 100, the S&P 100, the Wilshire 5000, and the Russell 1000 and 3000. In Canada, the TSX Composite joined the party, gaining 0.2% but the small-cap TSX Venture Exchange (CDNX) fell 3.1%. In the EU, the London FTSE was off 0.2%, the Paris CAC 40 dropped 0.4%, but the German DAX gained 0.2%. In Asia, China’s Shanghai Index (SSEC), embroiled in controversy over Didi, managed to gain about 0.2% but the Tokyo Nikkei Dow (TKN) dropped 2.9%. The MSCI World Index lost almost 0.7%. Bitcoin gained about 0.1% but appears poised to fall again.
Next week Q2 earnings season gets underway with the banks reporting first. Given weak earnings a year ago, the expectations are that they will look good. With some Fed officials expressing concern about the Delta variant, the worry is that if this more deadly variant rears its head it could spark lockdowns once again. While much of the U.S. population and Canada too is getting vaccinated, there are pockets of resistance to vaccination or areas where people haven’t been vaccinated yet where the Delta variant could take hold. Another lockdown would be poorly received and could spark violence.
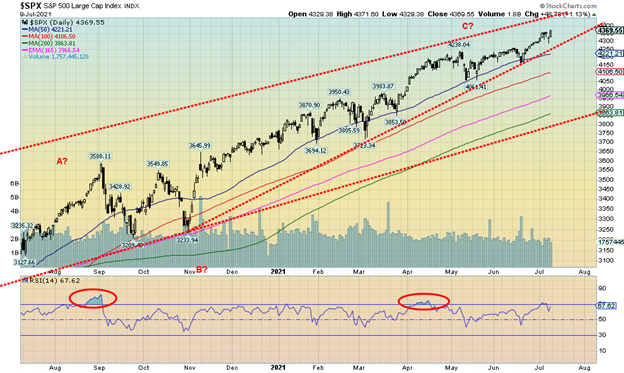
The S&P 500 continues to climb in what appears to us as an ascending wedge triangle. The breakdown point is under 4,250. However, there is room to climb further as the top of the channel is currently near 4,450.
One thing we do note is that while the S&P 500 made all-time highs this past week, the NYSE advance-decline line did not. A possible divergence. The advance-decline for up-down volume also is not making fresh highs, another divergence. The McClellan Summation Index (ratio-adjusted) known as the RASI is falling, another divergence. The VIX volatility indicator did not make new lows this week along with the S&P 500 making new highs (the VIX and the S&P 500 are inversely related). Another divergence. Finally, the CBOE put/call ratio closed on an up note this week at 0.53 vs. last week at 0.51. It hit a low of 0.37 in the first week of June. The put/call ratio is also diverging as more appear to be buying puts.
We can’t call a top just yet even if we suspect that one could be forming. Martin Armstrong of Armstrong Economics (www.armstrongeconomics.com) is calling for a panic-cycle to hit this month. However, he does not believe a major crash is coming at this time. That fits with our own thoughts of a pullback in the market that could carry into the fall. Given the concern over the Delta variant and the potential for it to slow down the recovery, the thought of pullback may have some legs. August and September are the two weakest months of the year with lows often seen in October/November.
Key numbers to watch are 4,290 for the S&P 500 as that was the low on Thursday and 34,415 the comparable level for the DJI. The DJI breaks down under 33,270. Yes, there is room to move higher here first but signs are dominating that some caution is advised.
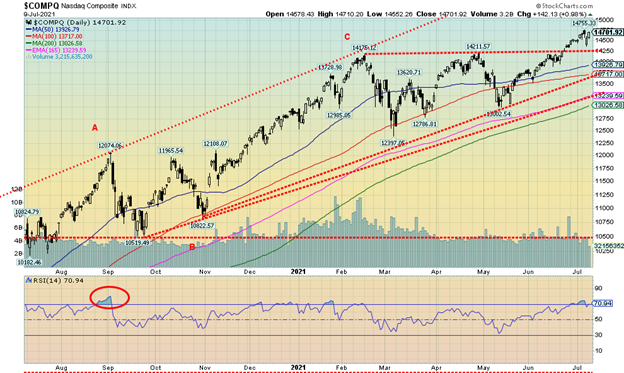
Growth stocks are rocking again and the NASDAQ soared once again to new all-time highs. The NASDAQ also appears to have broken out of an ascending triangle that could project up to just over 16,000. The NASDAQ gained 0.4% this past week. FAANG stocks performed as clutch of them made all-time highs as well. The big winners were Facebook -1.2% in a reversal as it made all-time highs, then reversed and closed lower. Apple +3.7%, Amazon +5.9%, Google +0.7%, and Microsoft +0.1% all made all time highs, holding their gains. Nvidia made fresh new highs, but like Facebook it reversed and closed lower, losing 2.1%. Rounding out the FAANG stocks, Netflix gained 0.4%, Tesla lost 3.2%, Twitter -0.3%, Baidu -7.8%, and Alibaba -5.4%. The latter two were hit as part of the dump Chinese stocks. As much as the NASDAQ appears to be poised to move higher, a reversal and break back down under 14,250 would be viewed negatively. Under 13,700 a top would be confirmed. To keep the potential for 16,000 alive the NASDAQ has to keep rising this coming week.
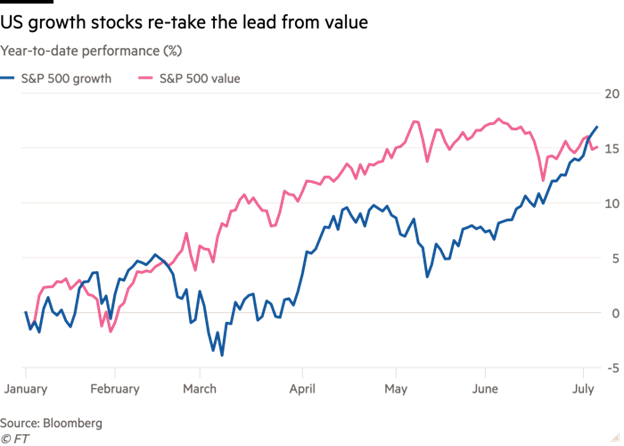
For several months from February–June 2021 value stocks ruled the roost as investors switched from growth to value. But now the reversal appears to be going the other way. This chart we saw in a recent report from Bianco Research (www.biancoresearch.com). Optimism seems to be prevailing that one is better off holding Apple (AAPL) rather than Berkshire Hathaway (BRK.A). Not sure what role that falling long-term interest rates might be playing in this as falling long-term rates make it cheaper for corporations to raise cash. FAANG stocks like Facebook, Google, Microsoft, and Twitter have outpaced the gains for both the S&P 500 and the Dow Jones Industrials (DJI) and even the NASDAQ thus far in 2021.
Gains Since 2006 – Wall Street vs. Main Street, Index 2006=100
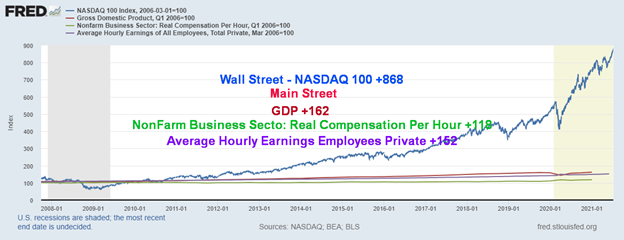
This emphasizes the gains for Wall Street vs. Main Street indexed to 2006. It also emphasizes how, because of the actions of the Fed in money printing, the benefits have gone primarily to Wall Street. The numbers on the chart reflect the index set at 100 in 2006. In terms of percentages, it plays out as follows from 2006:
Wall Street
- NASDAQ 100 +738%
Main Street
- GDP +57.2%
- NonFarm Business Sector: Real Compensation per Hour +17.5%
- Average Hourly Earnings of all Employees: Private +47.5%
In other words, the gains on the NASDAQ 100 are 13 times higher than GDP, 42 times better than the NonFarm Business Sector Real Compensation per Hour, and over 15 times better than the gain for Average Hourly Earnings of all Employees in the Private Sector.
In anybody’s book that is quite a differential. Wall Street parties. Main Street wallows in gloom.
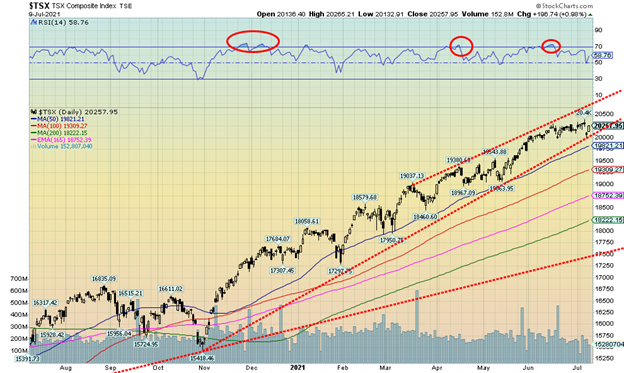
Once again, the TSX Composite hit an all-time high at 20,381.70. New all-time highs appear to be a weekly affair. The TSX gained about 0.2% this past week. Five TSX sub-indices also hit either new all-time highs or 52-week highs. Income Trusts (TCM) gained 2.5%, Consumer Staples (TCS) +.1%, Real Estate (TRE) +2.8%, Information Technology (TKK) +1.6%, and Telecommunications (TTS) +0.7% were the ones seeing new highs. It was not all joy on the week as four sub-indices were down. Consumer Discretionary (TCD) fell 1.0%, Energy (TEN) was the big loser on the week down 2.7%, Financials (TFS) lost 0.8%, and Health Care (THC) dropped 2.6%. As mentioned, Real Estate was the big winner on the week. The TSX Composite continues to trade within a bull channel not far from the top of the channel. The top of the channel is up near 20,700. The TSX came close to breaking down this past week before recovering on Friday. A breakdown under 20,000 could signal the end of the rally. The daily MACD indicator (not shown) gave a sell signal in mid-June. It has not been rescinded. The weekly MACD is close to a potential cross-over sell signal. The trend for the TSX remains to the upside but selection is required in picking stocks. Given recent life to Golds (TGD), Metals (TGM), and Materials (TMT), those might be the areas to look at as Financials (TFS) and Energy (TEN), two of the largest TSX components, are both faltering.
U.S. 10-year Treasury Bond/Canadian 10-year Government Bond (CGB)
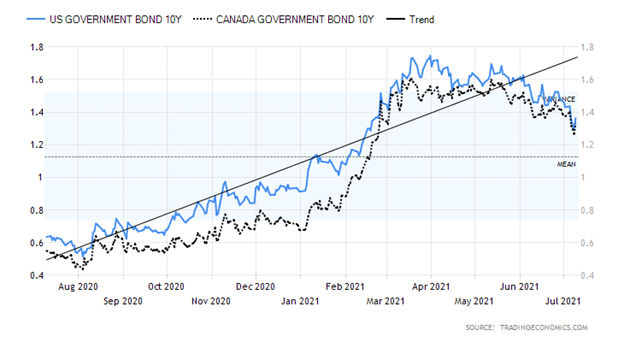
As anticipated here for the past few weeks the U.S. 10-year treasury note broke under 1.40%, hitting a low this week near 1.29% before rebounding. Bond yields were falling because there was a sense in the bond market that the best was over and that the economy could be peaking. The bond market was also concerned about the potential for the Delta variant to take hold, resulting once again in lockdowns. The initial employment claims this past week didn’t help as they came in unexpectedly above expectations at 373 thousand when the market was only expecting 320 thousand. The previous week saw initial claims of 371 thousand. JOLTS job openings hit a high of 9.2 million, although that was slightly below expectations. Mortgage applications fell this past week by 1.8%, raising concerns that the housing market has topped. The FOMC minutes were mixed but the Fed felt the vaccinations were getting the economy going again and that monetary and fiscal support was crucial to the recovery. The Fed emphasized the need to maintain low interest rates and also expected the current QE program to continue even as they continue to soak up excess liquidity by daily reverse repos. Fed officials also expressed concern about the Delta variant and how that could throw a wrench into the recovery. Pfizer and its partner BioNTech are asking U.S. and European regulators about the necessity of a booster for COVID but the CDC and health authorities are questioning the necessity. No doubt Pfizer makes a lot of money off of this. A sharp rise in the deadly Delta variant could throw a huge roadblock into a recovery, particularly if it comes with lockdowns once again. Lockdowns would not be well received. This coming week there is a $38 billion 10-year auction and a $24 billion 30-year auction. How well will they go? The Fed has been purchasing upwards of 50% of recent auctions. That should continue as the Fed doesn’t want to see any major upward pressure on rates.
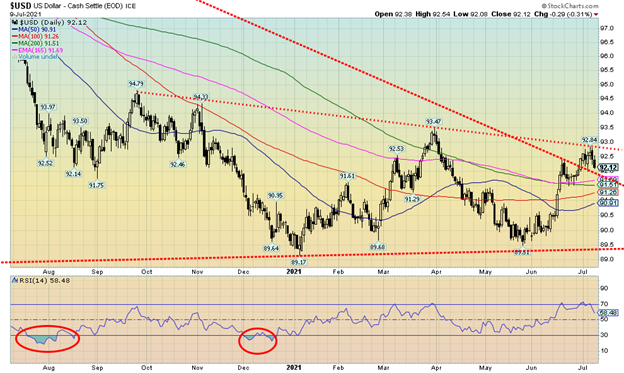
The US$ Index was initially strong this past week, hitting at high of 92.84 before turning south and closing at 92.12 down 0.3% on the week. The currencies, as a result, gained. The euro was up a small 0.1%, the Swiss franc jumped 0.8%, the pound sterling was up 0.5%, and the Japanese yen gained about 0.9%. The Canadian $ didn’t fare so well, falling 0.9% after earlier hitting a six-year high at 83.30. The current uptrend for the Cdn$ appears to have been broken and a consolidation/corrective period appears to be underway. The US$ Index failed perfectly at a trend line coming over from a high in September 2020 that joined with a high in March 2021. As long as that level holds, the trend for the US$ Index remains to the downside. However, it has been going through a corrective period and now may be making a double top. The neckline is well-drawn, currently around 89.50. A major breakdown under that level could target down to near 84. A fall in the US$ Index would be positive for gold that tends to move inversely. If a top is to be in place, we need first to break back down under 91.70. Following that, the next level to break down under is near 90.90. Given the US$ Index’s failure at the moment at least to exceed the March high of 93.47 the risk remains to the downside. However, if the US$ Index were to break above 93, then all bets could be off and the 93.47 March high could fall.
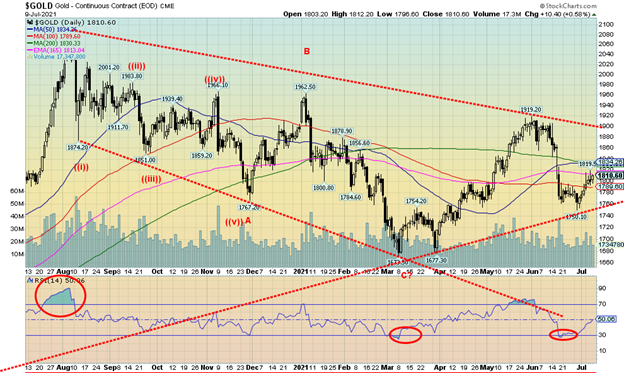
Thanks to some renewed fears that the Delta variant COVID-19 might derail the recovery and with bond yields falling to their lowest levels in four months, gold gained 1.5% this past week to $1,810. Silver didn’t fare as well as it fell 1.0%. However, platinum rose, gaining 0.7% and the industrial metals with precious metals characteristics also rose. Palladium gained 0.7% and copper was up 1.6%. We note that all of the TSX Gold Index (TGD) +1.0%, the TSX Metals & Mining Index (TGM) +2.4% and the TSX Materials Index (TMT) +1.0% gained on the week. For gold, this was the third consecutive weekly gain. Gold also held its 100-day MA and remains above a trend line that comes up from a low seen in 2019 at $1,267. Despite the gain, gold remains somewhat in a bear market as it is still down over 13% from the August 2020 high of $2,089. Gold’s patterns are not quite as clear as silver’s patterns. One could interpret the decline from the recent high at $1,919 as a 5-wave decline. This wave then could be seen as a corrective wave. But if we are right about making the long-awaited most recent 31-month cycle low, then we should go higher. However, with the looming 7.83 year and 23–25-year cycle low, the question is: will this be a bullish run where we take out the August 2020 high or a bearish run where it fails to take out the August 2020 high? The 7.83-year and 23–25-year cycle low is not due now until 2024–2025. So, this rally is quite important. Is it a bullish run or a bearish run? If the Delta variant takes hold and sends the Western world into lockdown again, it is sure to have a negative impact on job and GDP growth. That in turn could be positive for gold. Note that Southeast Asia and Japan are once again experiencing lockdowns (i.e., no spectators for the Olympic Games in Japan). And, given that everyone is probably fed up with lockdowns, violence could erupt. Gold is a hedge not only against inflation expectations but, most importantly, during economic and political uncertainty. Political uncertainty could also manifest itself in a loss of confidence of governments. We also note that, while the U.S. dollar was higher earlier in the week, it closed on a soft note—the US$ Index fell on Friday, turning the index negative for the week. On the other hand, sales of gold were soft in India and China this past week. They are traditionally strong buyers. We remain positive on gold. However, gold needs to first break above $1,820/$1,830 and preferably hold above $1,790. Gold breaks down under $1,760. Gold bugs don’t want to see that level break.
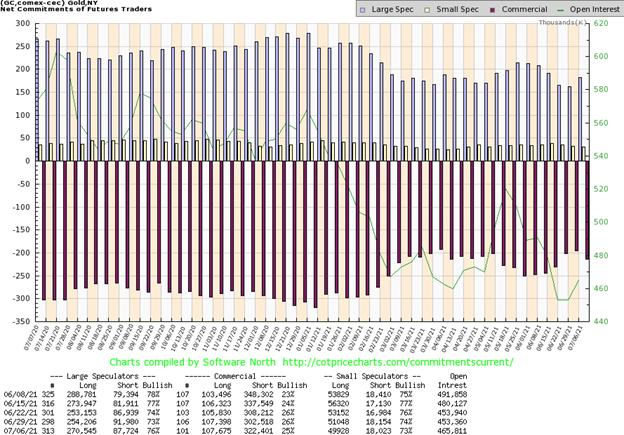
The commercial COT (bullion companies and banks) slipped this past week to 25% from 26%. Long open interest was largely unchanged but short open interest jumped by roughly 20,000 contracts. Overall, open interest rose over 12,000 contracts on a week that gold gained. The large speculators COT (hedge funds, managed futures, etc.) rose to 76% from 73% as they seemed to jump the gun on a potential gold rally. Their long open interest jumped over 16,000 contracts while short open interest fell over 4,000 contracts. The last time the large speculators did this it was handed to them as gold prices fell and in no time their COT fell from 78% to 73% before rising this past week. It’s only one week and the recent trend has been to an improving commercial COT. Is this a one-week wonder? Or the start of another downtrend?
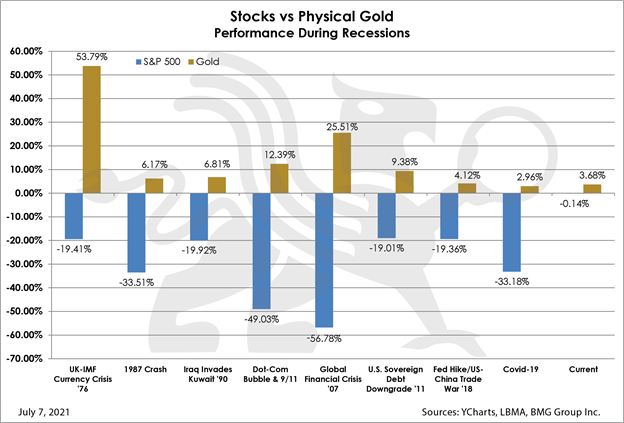
As we have often noted, gold (physical gold, not paper gold) is negatively correlated to stocks (and bonds as well). The above chart from BMG Group (www.bmg-group.com) states this. Gold has consistently outperformed stocks during recessionary periods and market corrections. It is particularly stark during financial meltdowns as was seen during the 1987 crash, the dot.com crash, 9/11 2001–2002, the financial crisis 2007–2009, and the pandemic crash 2020. No, that does not mean gold stocks act the same as gold itself. Nor silver for that matter. Gold stocks are paper, just like the stock market, while silver tends to act more as an industrial metal during these periods and suffers along with the stock market. Gold goes through its cycles ups and downs like everything else, but during a steep correction and crash gold has consistently outperformed. Gold remains the best performer since 2000, up 522% vs. 195% for the S&P 500.
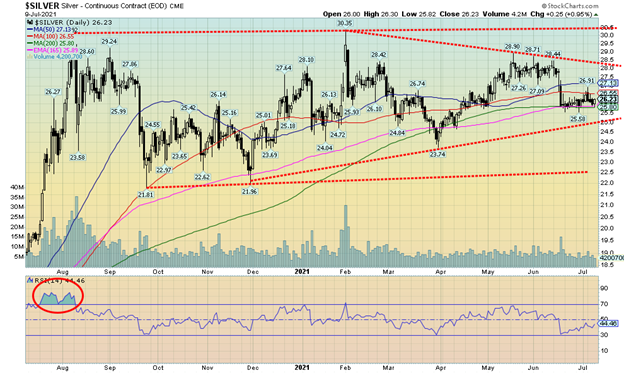
Silver continues to form for us a potential ascending triangle. It has not been an easy one as it drags on. This past week silver did not rise with gold, losing 1.0%. Nonetheless, silver continued to hold key MAs that are flatlining. As long as silver remains above $25 the triangle pattern remains in place and the potential to rise and eventually take out the February 1 high of $30.35 remains. Since the top in August 2020 at $29.24, silver has been moving back and forth generally in patterns of three. That implies to us that all this action has been corrective and is not indicative of the potential for a major breakdown. However, we have a lot of work to do. We are holding a now flatlining 200-day to 100-day MA between $25.80 and $26.55. But key to taking out the February high is to regain back above $28 and preferably above $28.90 that high in May. And, of course, hold above $25.
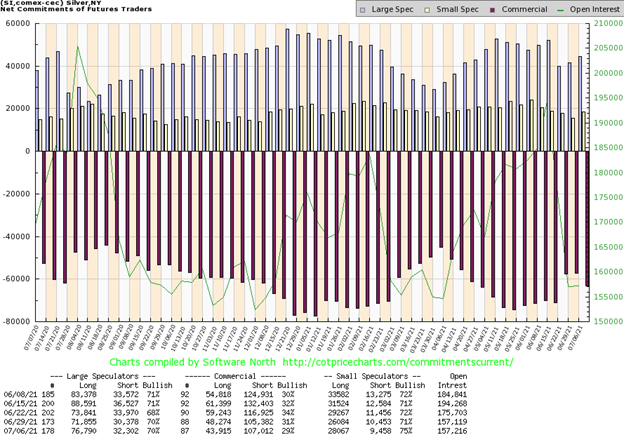
As with gold, a temporary hiccup or whatever rally occurred is soon to end. The commercial COT for silver fell this past week to 29% from 31%. Mostly it was a fall in long open interest as it dropped over 4,000 contracts. Short open interest rose just under 2,000 contracts. Overall, open interest was largely unchanged on a week that silver posted a small loss. It’s just one week but this is the second consecutive weekly decline for the commercial COT, having peaked at 34% three weeks ago. Still, the large speculators who are normally the most bullish are not yet particularly bullish.
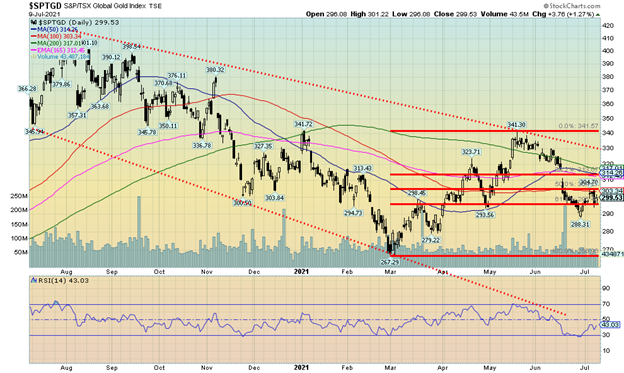
With gold up this past week but silver down, the gold stocks were decidedly mixed. The Gold Bugs Index (HUI) fell 0.5% but the TSX Gold Index (TGD) gained about 1.0%. Both indices have held above their recent lows but remain well off the most recent high seen in May and even more so off the August 2020 high. The HUI is still down about 26% from that high while the TGD remains down about 25%. For gold stocks, the current bear market continues. However, we continue to see signs of light. While we are down, we are up from the March low. The HUI is up 8.5% while the TGD is up 12%. This recent pullback appears to us as a potential test of the lows. So far, we have held levels around the Fibonacci 61.8% retracement level of the move from March 2021 to May 2021. On the other hand, we remain well away from breaking out. The breakout point for the TGD is above 330 and for the HUI above 315. Just to regain the 200-day MA, the TGD needs to break above 317 and the HUI above 295. We also need to start seeing the gold stocks leading both gold and silver. That would be a clear sign that a new up-move is under way. We have bounced from oversold levels but we are nowhere at levels that would have us saying “we are on our way.” Until then, the risk remains to the downside. We would not want to see the TGD break down under 284 or the HUI under 266. Okay, the HUI did with a low so far at 261 but the TGD did not confirm. The HUI failed to hold that low. While we remain positive on our outlook for gold and the gold stocks, the gold stocks in particular have considerable work to do to regain the confidence of the market.
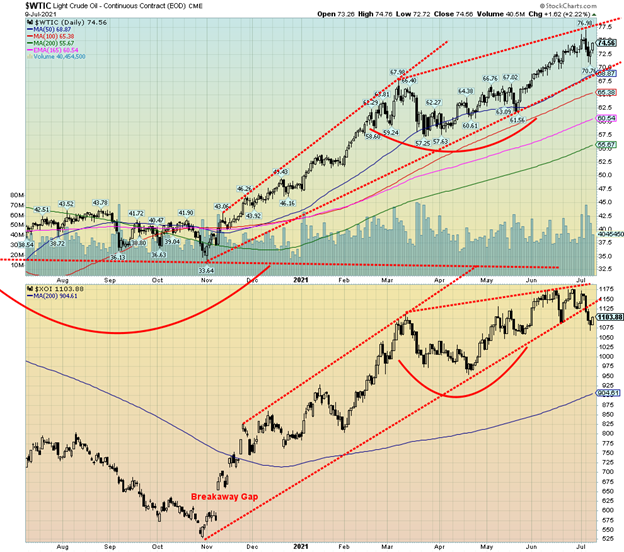
Is the oil rally over? We have to ask that question, given the sharp drop this past week in the energy stocks (Friday’s rally excepted) while WTI oil saw new 52-week highs for the move but closed the week down, losing 0.8%. A reversal. As to the energy stocks, the ARCA Oil & Gas Index (XOI) fell 4.7% while the TSX Energy Index (TEN) dropped 2.7%. Natural gas (NG) wasn’t completely spared. It didn’t gain but didn’t lose either, closing the week unchanged from the previous week.
Friday’s rally was sparked by stronger than expected U.S. fuel consumption. As well, there have been seven consecutive weeks of inventory draws. This past week consumption demand jumped 870 thousand barrels per day (bpd). The summer driving season, it seems, is heating up. It was the highest consumption levels since 2019. But uncertainty surrounds OPEC as some such as Saudi Arabia want to increase production while others, UAE, are reluctant to do so. Could OPEC split? Could a price war be set off if Saudi Arabia wins the day? It is not as if Saudi Arabia hasn’t pulled this one before. The 1980s and 1990s saw Saudi Arabia increase supply, thus pushing prices down as the Saudis’ low production costs allow them to remain profitable even at ridiculously low prices. They did the same following the 2008 financial crisis. They grab market share as high-cost producers (oil sands, shale) are pushed aside.
For WTI oil, a breakdown under $70 would confirm a top. On the other side, the ceiling right now appears to be around $77.50 with the recent high at $76.90. Recall we once set a potential target of $78 for oil. The energy stocks may have already potentially confirmed a top with a break of the uptrend line from a year ago November. A price war would be a benefit to drivers, as gasoline prices could then fall.
__
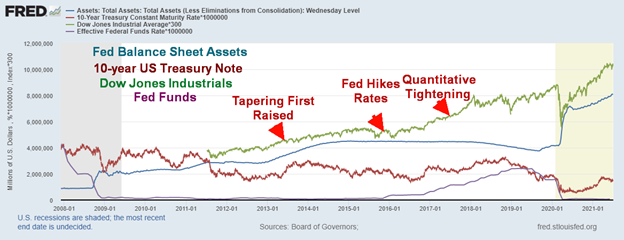
(Featured image by Aditya Vyas via Unsplash)
DISCLAIMER: This article was written by a third party contributor and does not reflect the opinion of Born2Invest, its management, staff or its associates. Please review our disclaimer for more information.
This article may include forward-looking statements. These forward-looking statements generally are identified by the words “believe,” “project,” “estimate,” “become,” “plan,” “will,” and similar expressions. These forward-looking statements involve known and unknown risks as well as uncertainties, including those discussed in the following cautionary statements and elsewhere in this article and on this site. Although the Company may believe that its expectations are based on reasonable assumptions, the actual results that the Company may achieve may differ materially from any forward-looking statements, which reflect the opinions of the management of the Company only as of the date hereof. Additionally, please make sure to read these important disclosures.
David Chapman is not a registered advisory service and is not an exempt market dealer (EMD) nor a licensed financial advisor. We do not and cannot give individualised market advice. David Chapman has worked in the financial industry for over 40 years including large financial corporations, banks, and investment dealers. The information in this newsletter is intended only for informational and educational purposes. It should not be considered a solicitation of an offer or sale of any security. Every effort is made to provide accurate and complete information. However, we cannot guarantee that there will be no errors. We make no claims, promises or guarantees about the accuracy, completeness, or adequacy of the contents of this commentary and expressly disclaim liability for errors and omissions in the contents of this commentary. David Chapman will always use his best efforts to ensure the accuracy and timeliness of all information. The reader assumes all risk when trading in securities and David Chapman advises consulting a licensed professional financial advisor before proceeding with any trade or idea presented in this newsletter. David Chapman may own shares in companies mentioned in this newsletter. We share our ideas and opinions for informational and educational purposes only and expect the reader to perform due diligence before considering a position in any security. That includes consulting with your own licensed professional financial advisor.


Biotech Booster: €196.4M Fund to Accelerate Dutch Innovation
The €196.4 million Biotech Booster fund in the Netherlands supports scientists and research teams to turn biotech innovations into market-ready...


Why the iGaming Industry Offers Some of the Best ROI for Affiliate Marketers
iGaming affiliate marketing offers high earnings through RevShare (up to 60%) and CPA ($50–$550), far exceeding e-commerce. Key advantages include...


Ripple and Mercado Bitcoin Expand RWA Tokenization on XRPL
Ripple advances its RWA ambitions with Mercado Bitcoin tokenizing $200 million in fixed-income and equity assets on XRPL. This deepens...


Soybean Market Reacts to Trade Hopes, High Stocks, and Global Price Pressure
Soybeans and Soybean Meal rose on hopes of a U.S.-China trade deal, though Soybean Oil fell. Lower Brazilian prices and...


Legal Process for Dividing Real Estate Inheritance
Dividing inherited real estate involves more than legal steps—it's strategic. Recent reforms ease probate and offer tax breaks, but proactive...
 |
|
 |  |
 |
|
-

 Crypto2 weeks ago
Coinbase Surges: Bernstein Targets $510 as COIN Hits Highest Price Since IPO
-
 Biotech19 hours ago
Biotech Booster: €196.4M Fund to Accelerate Dutch Innovation
-

 Markets1 week ago
Coffee Prices Decline Amid Rising Supply and Mixed Harvest Outlooks
-
 Crypto5 days ago
Caution Prevails as Bitcoin Nears All-Time High