Featured
The pandemic is just the trigger of an inevitable recession
So is the bear over? Many are proclaiming the bear dead because of this past week’s 20% plus rally. But as we note there are plenty of signs that this could be short lived. We also see that we have started what we believe is a new secular bear. The economic numbers this past week were stunning. The potential unemployment numbers could be staggering. Lurking in the background is a mountain of debt.

“The world is not really going to be the same anymore. This is such a fundamental change in terms of the economy; it’s almost revolutionary.”
Bernie Wolf, economics professor, York University’s Schulich School of Business
Astounding! Unprecedented! Unbelievable! The daily headlines in the newspapers leave us flummoxed and tongue-tied. The quote came from the main page of The Toronto Star, March 26, 2020. We used it because it said it all. One barely knows where to begin, let alone where to end. Rescue packages: $2–$2.5 trillion in the U.S., Cdn$125 billion in Canada. For the U.S., that represents roughly 11.5% of GDP; for Canada, only around 5% in Cdn$. To match the U.S. amount, Canada would have to bring forth a Cdn$275 billion aid package, with printing presses working overtime and deficits poised to soar.
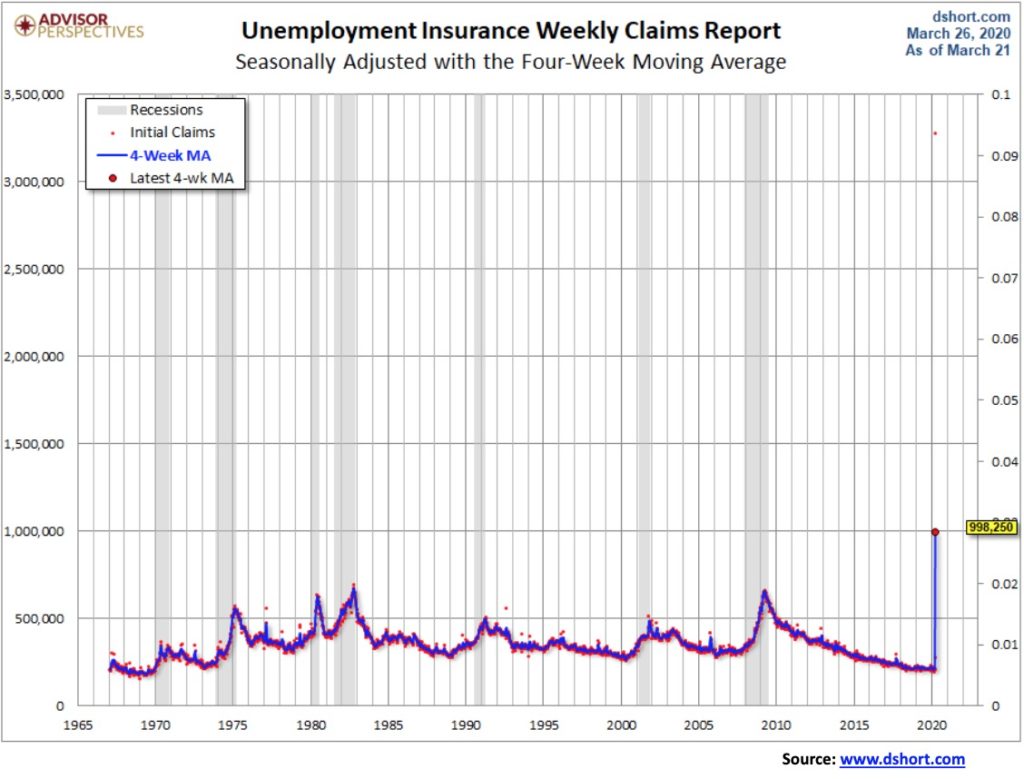
The numbers are numbing. The U.S. weekly initial job claims skyrocketed to 3,283,000, an increase of over 3 million from the previous week. It is the highest level of seasonally adjusted claims ever seen in the seasonally adjusted series. It was even worse than what was expected. The market consensus was 1.6 million. Our first chart below shows it seasonally adjusted with the 4-week MA, dating back into the 1960s. It shatters all records, even during the height of the Great Recession in 2007–2009. It gives true meaning to the phrase “off the charts.” And a reminder, the high during that period (2007–2009) came towards the end of the recession, not the beginning. Officially, we don’t have a recession yet although many economists believe one started this quarter. The only question on our mind is, will it eventually be called a depression, as in The Great Depression II. The odds are high that this will be more than just a recession.
Canada is expecting upwards of two million layoffs. That is roughly 10% of the entire labor force. Hardest hit are restaurants, gyms, entertainment venues, and salons. Travel has ground to a halt. Manufacturing firms are closing or suspending operations and malls are shuttered. As to forecasts, Canadian GDP is estimated to fall 10% in Q2 or 35% on an annualized basis. There are an estimated 3.3 million employed in firms that have closed or soon will and another 1.3 million in firms that are at risk of having to close. The unemployment rate could rise to 15%, hitting depression levels. The Government of Canada is expecting some 4 million to apply for financial aid. The problem with all of this is we don’t know how long this situation will prevail. However, the longer it goes on, the worse it will get. And that leads potentially to another problem—rising social unrest. Canada’s biggest riot was July 1, 1935, as unemployed workers were met by a force of RCMP.
In the U.S. the numbers are also staggering. Q2 GDP is estimated to fall by upwards of 40% annualized. Total employment could fall by 14 million and the unemployment rate could rise to at least 12%. Some estimates have suggested that upwards of 37 million U.S. jobs are at risk of at least short-term layoffs. Industries include restaurants, retail, travel, tourism & leisure, support services, education, membership organizations including charities, auto parts & dealers and maintenance, and real estate. Economists are busy trying to forecast a rebound in Q3, but that would seem to be dependent on the current COVID-19 crisis peaking and flattening out, allowing some return to normalcy. If the current COVID-19 crisis follows the example of China and South Korea, a peak may be seen sometime in April/May. However, given the level of unpreparedness of the Western economies, along with shortages of almost everything, this could easily extend into June before it ends and August before anything returns to anything resembling normal. Except a return to normal is unlikely to happen, no matter what. The numbers globally under lockdown, shelter in place, isolation, or whatever are estimated to encompass at least 25% of the global population. That’s estimated to be upwards of two billion people.
On the bright side, there are now firms crying for workers, mostly for deliveries and packing. We understand one of the biggest potential employers needing people is Instacart. Others such as Amazon and Walmart are also advertising for people. There is a shortage of truckers to haul goods. Warehouses are working overtime to keep stocks in place at food stores.
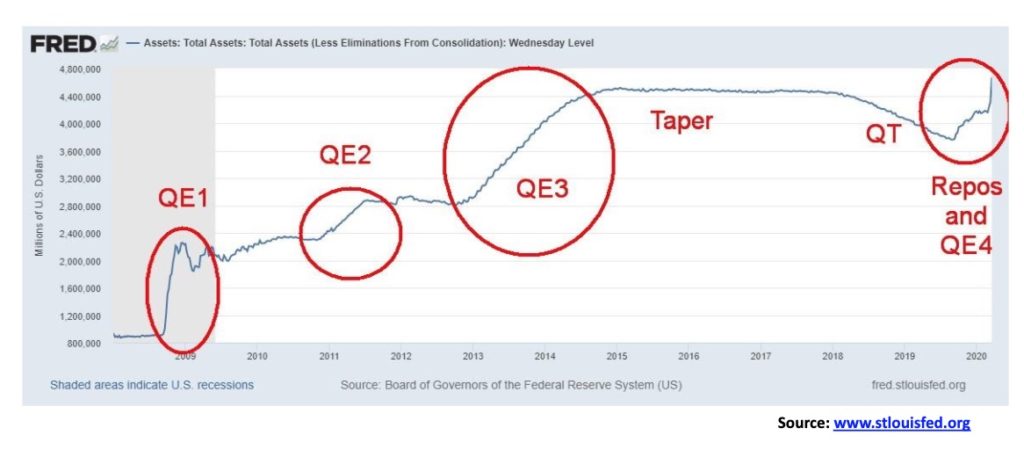
The Fed’s balance sheet has exploded. In last report, the Fed’s balance sheet stands at $4.7 trillion, up from $3.7 trillion in September 2019 (apparently over $5 trillion now but we don’t have the updated chart). This easily surpasses the high seen after the 2008 financial crisis. QE on steroids. But if this QE acts as it did after the 2008 financial crisis, the stock market should eventually respond positively to it. The Fed is buying all sorts of paper beside the U.S. treasuries including Mortgage-Backed Securities (MBS) and even corporate bonds, something they did not do before. The Fed’s balance sheet no doubt could cross $5 trillion sometime in early April.
If China is the measuring stick, the worst is yet to come for the Western economies. The number of cases didn’t start to flatten in China until well over a month after we first learned about the COVID-19 in January 2020. However, China was quick to shut down once the cases started mounting. The number of cases started to rise in the Western economies, primarily North America (U.S., Canada) and the EU only after March 1. However, they were slower to respond to the crisis and act on any lockdowns. This is why there is anecdotal evidence that the things won’t begin to flatten in North America and the EU until sometime in April at the earliest (unlikely) and possibly not until well into May or June. Yet Donald Trump is demanding that the U.S. be back at work by Easter April 12, 2020. Health officials are beside themselves.
The number of cases in the U.S. and Italy has now surpassed China. The U.S. has topped 120,000 cases and rising. To date there has been officially reported over 680,000 cases with in excess of 32,000 deaths in 199 countries plus two international conveyances, the Diamond Princess harbored in Yokohama and Holland America’s MS Zaandam floating around in the ocean. There are listed some 234 countries, including territories and dependencies. Notably absent in reporting is North Korea. It seems improbable that they would have escaped the COVID-19 crisis, given their position between China and South Korea.
The economic impact on China is already dramatic. Business activity slowed dramatically between January and February 2020. Our chart below of Chinese Industrial Production is dramatic for the collapse seen in February. Chinese industrial production fell 26.63% from January to February 2020.
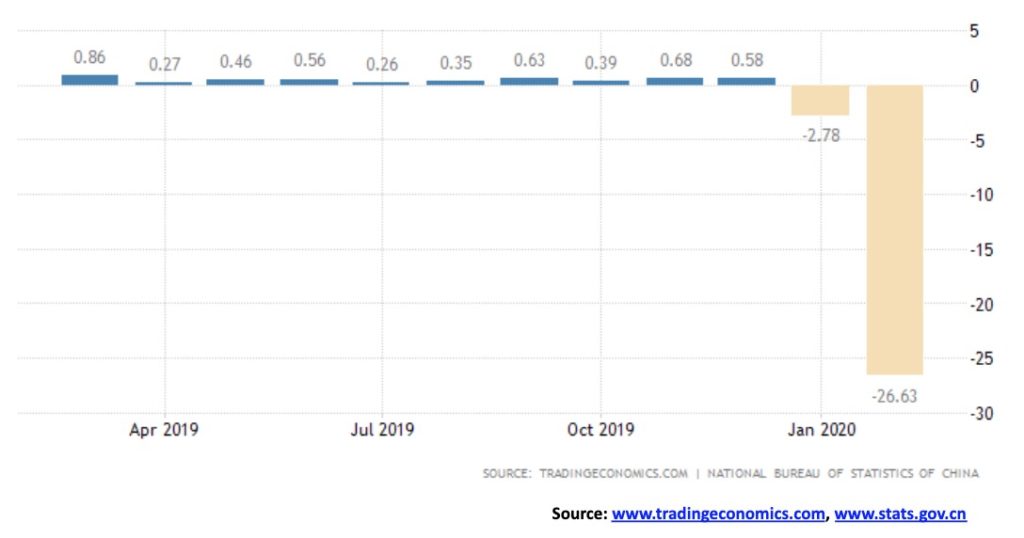
Other parts of the Chinese economy that saw dramatic declines from January to February 2020 include investment in fixed assets, down 24.5%; retail sales, down 20.5%; value of exports, down 15.9%; and services production, down 13.0%. Unemployment has soared from 5.2% in December 2019 to 6.2%. It doesn’t seem like much, but it is apparently a record. While China is getting back to work, domestic demand is languishing because people are afraid to spend and overseas demand is also suffering as so many stores have closed or are canceling orders, leading to an oversupply of goods. Economists are expecting China to experience a GDP contraction for Q1. It would be the first decline since 1976.
With the U.S. and Canada both largely on stay-at-home orders, this is severely restricting economic activity and, as we noted, it is resulting in widespread layoffs. The same thing is happening in the EU, particularly Italy, Spain, and the U.K. And it is now happening in India as well. All of this is troublesome for the EU’s largest economy, Germany. Germany’s exports are falling and they account for 47% of its GDP. And Germany, even if it could, is not necessarily in the mood to bail out all the other EU countries, particularly Italy which could collapse and default on its debt. Italy is the world’s 8th largest economy. Germany is the world’s 4th largest economy.
Could global growth turn negative in Q1 and even in Q2? The IMF is forecasting a global recession in 2020. Global income could fall as much as $2 trillion. To be somewhat cheery, forecasts are showing Q3 could see a strong rebound. But how long this crisis lasts will help determine that.
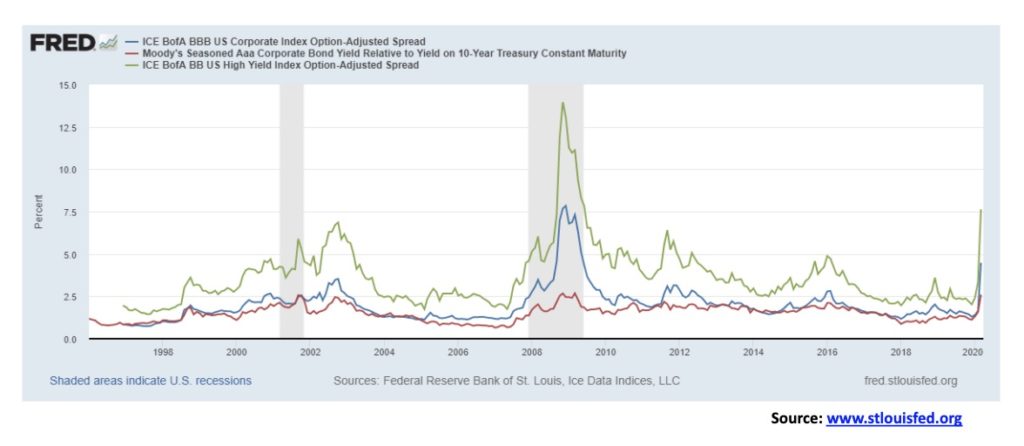
One of our main concerns remains the potential for a credit collapse. Spreads to U.S. 10-year treasury notes continue to widen. Since the end of December 2019, the Moody’s Aaa corporate bond spread over the 10-year U.S. treasury note has gone from 1.12% to 2.60%, a dramatic increase. For BBB-rated corporate bonds, the lowest investment grade, the spread has widened to 4.48% from 1.30%. For BB-rated corporate bonds (the highest-rated junk bonds), the increase is even more dramatic, moving from 2.02% to 7.63%. While this remains well short of the peaks seen in 2008, we note that this is early. Aaa corporate bond spreads peaked in March 2009 at 2.68%. It is noteworthy that they are already at 2.60%.
Distressed debt in the U.S. already tops $1 trillion (5% of GDP). This is approaching levels seen at the height of the 2008 financial crisis. These numbers include debt that is trading at least 10% above U.S. treasuries and is trading for less than 80 cents on the dollar. It has more than doubled in the past week or so which leads us to believe that the real number could be even higher. Trouble is being seen, in particular in the oil industry, and in corporations negatively impacted by the COVID-19 crisis. It is, according to Bloomberg the highest seen since April 2009.
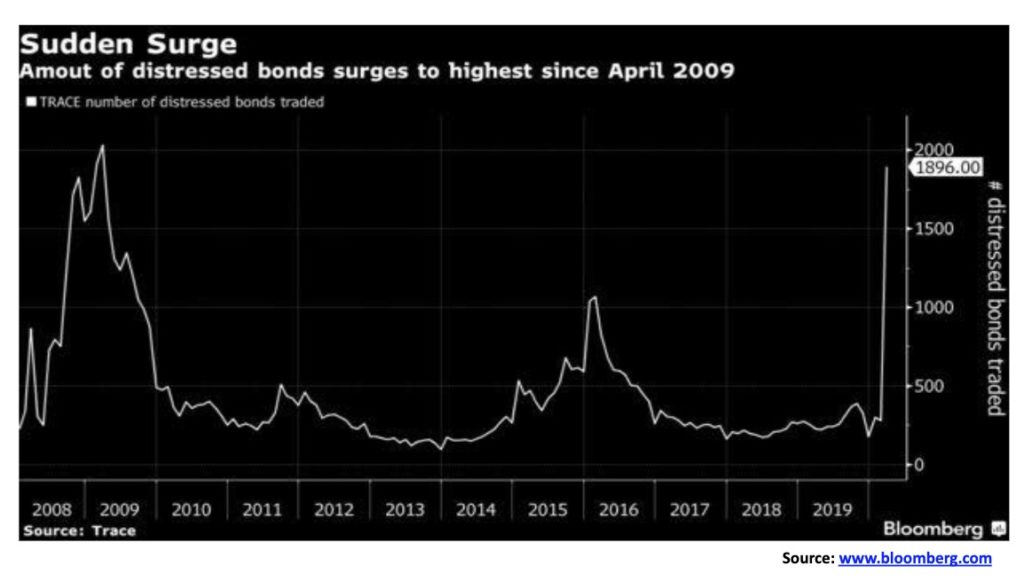
It is no surprise that the industry most impacted by bad debt is the oil and gas industry, making up at least 16% of the total. Other industries included are telecommunications, retail, entertainment, healthcare services, media, auto manufacturers, and commercial services. A comparable situation, no doubt, exists in Canada where corporate debt is the highest it has ever been. A notable downgrade has already been seen for Occidental Petroleum as its debt has been reduced to junk. Funds and ETFs that specialize in corporate bonds are seeing record withdrawals. We are beginning to hear of cuts to dividends from a wide range of companies.
But there are some potentially scarier things out there. Credit Default Swaps (CDS) are what nearly caused the collapse of the American International Group (AIG) in 2008. They were loaded with credit default swaps. When the credit market collapsed, they were unable to meet their obligations. Five banks in the U.S. have 85% of the derivatives market, totaling some $235 trillion notional (face value). These five are Citigroup, JP Morgan Chase, Morgan Stanley, Goldman Sachs, and Bank of America. And their counterparties are no angels, either. Deutsche Bank, effectively a walking zombie bank, is one of the largest banks in the world with derivatives. The collapse in 2008 led to the biggest Wall Street bailout in history. Any collapse now would pale what happened in 2008.
According to statistics from the Office of the Comptroller of the Currency two banks, JPMorgan Chase and Citibank have between them $2.96 trillion of exposure to credit default swaps (CDS) as of September 30, 2019. CDSs for all national banks in the U.S. is $3.7 trillion. This pales with what AIG had in 2008. JPM’s common equity capital has fallen almost 40% over the past month or so and Citibank has lost over 50% of its equity capital in the same time period. Could they become zombie banks? Between them, they have over $2.5 trillion in deposits.
The insurance companies are no better as many of them are counterparties with the banks, including many who are involved in CDSs. Large insurance companies whose derivatives may be toxic include Lincoln National, Ameriprise Financial, Prudential, Voya Financial, and once again AIG.
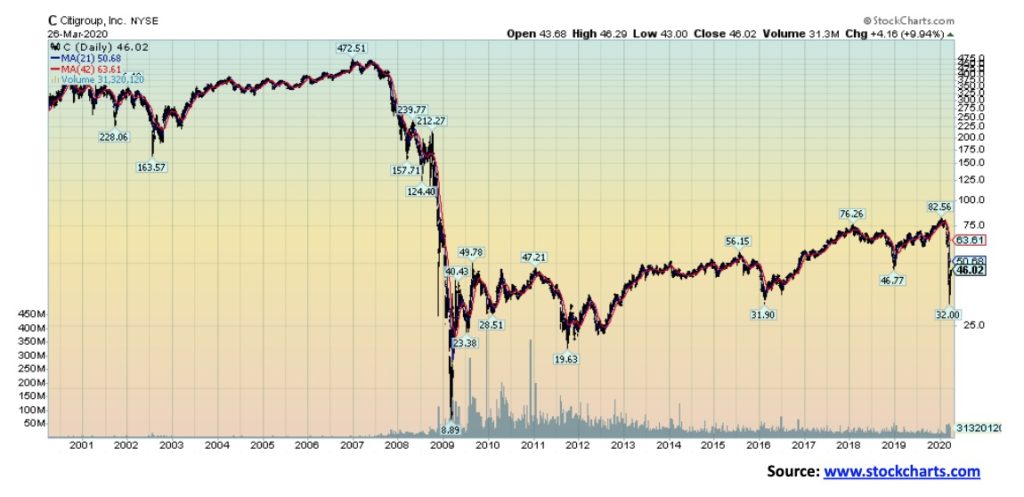
Our chart of Citigroup (C-NYSE) shows a company in a long-term collapse. Citigroup is trading today where it was in 1993. Since peaking at $472 in December 2006 Citigroup has fallen 90%. Citi is down 44% from its high in January 2020. If Citi were to break under the 2011/2012 lows near $20/$22, the odds favor it falling to 2009 low or lower. It is not surprising that the health of the entire U.S. banking system and even the global banking system rests on those five banks.
In the midst of all this gloom, it is probably not surprising that we are seeing recommendations that the market is the “buy of the century.” Well, maybe that’s an exaggeration. There is the old saying, allegedly credited to Baron Rothschild, an 18th century nobleman from the Rothschild banking family, that “the time to buy is when there’s blood on the street.” Apparently, he also added, “even if the blood is your own.” Well, there is blood. It was the fastest transition from a bull to bear ever seen. At the recent low, the S&P 500 was down over 35% in a mere 33 days. The latest rebound brought the market up 20% in three days. Some were quickly calling it a new bull market. So, is the bear over? Hardly. Friday saw the market go right back down. A bear market rally is more likely. Even the 1987 crash took 55 days from the top in August to the final low on October 19, 1987.
There is also another old saying: don’t fight the Fed. The Fed has lowered interest rates to zero and is pouring trillions into the market through repos and QE in order to provide liquidity. As well, they are also responding on the fiscal side with over $2 trillion designed, at least in part, to keep the army of newly unemployed at least somewhat afloat. Canada has followed as the BofC has cut rates to 0.25% and is now acting like the Fed, providing liquidity through bond buying (read QE). The Federal government is offering upwards of $2,000/month to the unemployed, self-employed, and freelancers negatively impacted by the collapse. The start of a basic income program? So, is that enough to spark the stock market? In an election year, a sinking stock market is not usually friendly to an incumbent president.
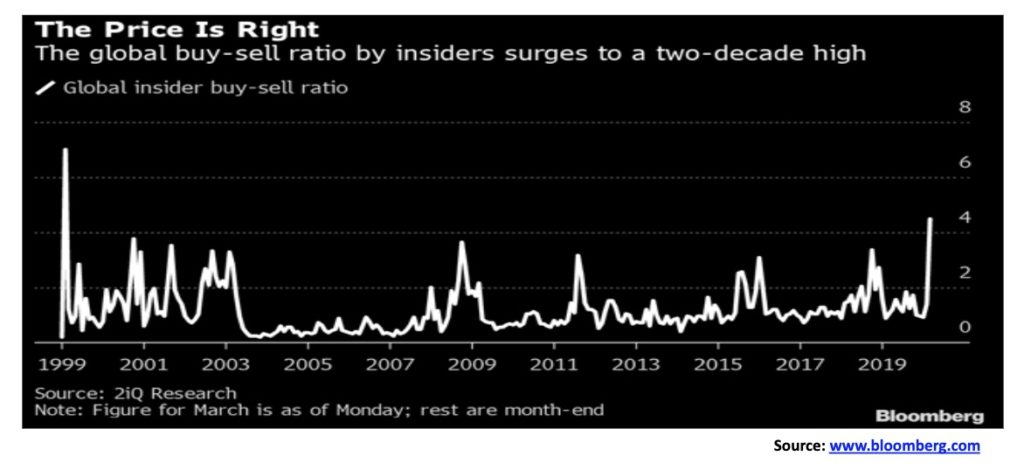
Other signs of a potential bottom include insiders and smart money investors such as Carl Icahn, Warren Buffett buying. Corporate insiders are buying stock in their own companies at a pace not seen in years according to a Wall Street Journal article and insider reports. There are a number of divergences between the technical indicators and the price that are often signs of an impending bottom. Usually, the price makes new lows while the indicators do not. Indicators diverging with the price is not uncommon, and while it may be a sign of an impending bottom, it does not necessarily mean that a bottom is in place. Divergences can carry on for some time before the market shifts. Insiders may like the value of their company at these levels but the company could get even cheaper. Claiming it is the buy of a lifetime could prove to be premature.
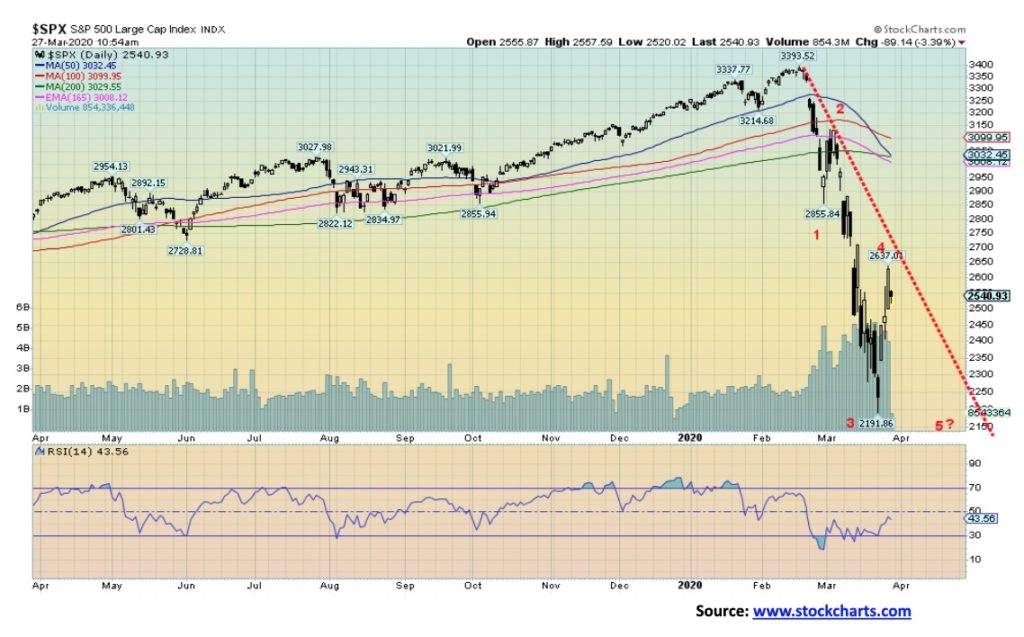
The S&P 500 is putting in an outside week, meaning it saw new lows and then made new highs above the previous week’s high. A reversal week in the making? Our chart of the S&P 500 below suggests we could now be starting wave 5 down. This is an impulse wave to the downside, not a corrective wave as we saw in October/December 2018. It is possible that wave 4 is complete, falling just short of a potential downtrend line from the top. How low could wave 5 go?
The Lehman Brothers’ crash low was seen 44% below the 4-year MA. The 2002 high-tech/dot.com crash low was seen roughly 38% below the 4-year MA. The low thus far was seen at only 16% below the 4-year MA. This could fall a lot further to between 1,500 and 1,600. The 2016 low was at 1,810 and the 2000 and 2007 top was at 1,553 and 1,576 respectively. A shallow 5th wave decline now could test the high of 2015 near 2,135. The high this week was at 2,637 and the 4-year MA is currently at 2,621. The S&P 500 successfully tested the 4-year MA before pulling back. To confirm a low, the S&P 500 would need to close over 2,750 and preferably over 2,850. We view a fall to the levels noted 1500–1600 as the extreme.
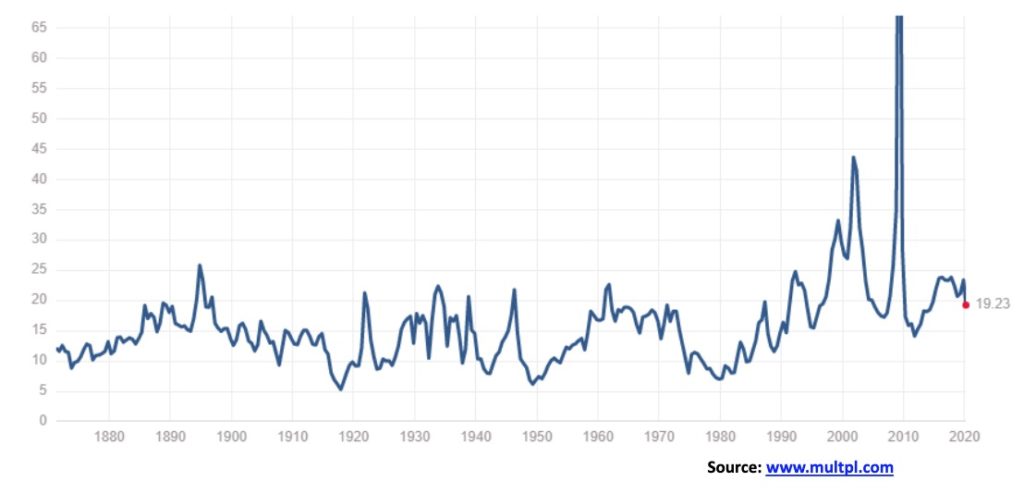
Another way of potentially measuring this is through the P/E ratio. According to the chart below, the current P/E is at 19.23. The median P/E is 14.82. According to a recent study, that would imply the S&P 500 could fall to around 1,970. That would give us a new low and most likely numerous divergences in the indicators, thus setting up a much better entry point for buying.
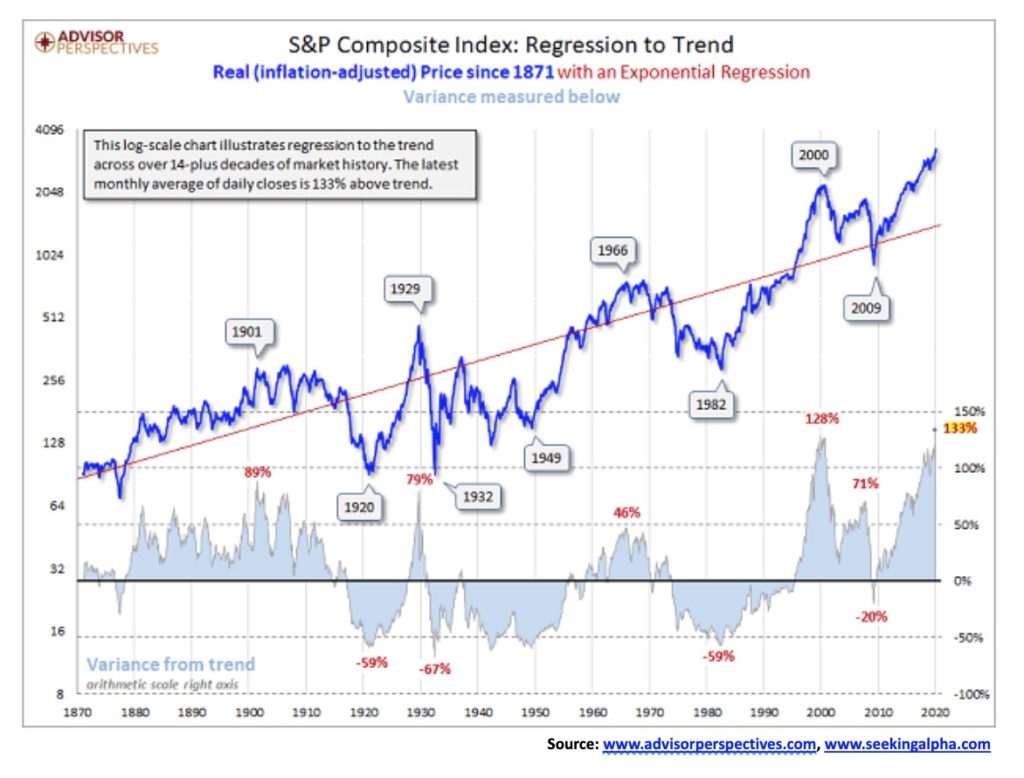
Our second chart below (next page) is even more interesting. It shows the S&P 500 over the past 150 years. The real S&P 500 has been inflation-adjusted with an exponential regression line. The S&P 500 could revert to what we call the mean. At the recent peak seen in January, the S&P 500 was 133% above the trend. At the peak of the dot.com bubble in 2000, the S&P 500 was only 128% above the mean. The final decline was the 2008 financial crisis as the S&P 500 reverted to the mean. As one can see, the S&P 500 has a history of rising above the mean and then typically falling well below the mean as it did in 1920, 1932, 1949, and 1982. Key peaks were seen in 1901, 1929, and 1966. A fall now to the mean would take the S&P 500 down to around 1,400.
No, that doesn’t mean it would fall there now, but it could fall to those levels at some point in the future. We note that bear markets are normally three-pronged affairs: a decline (the A wave down), a recovery (the B wave up), and the final collapse (the C wave down). If we are correct about this, we are working on the A wave down. It could also be an A wave as we saw in 2000–2002 which itself was a three-wave affair. It was followed by the 2002–2007 rally (B wave), then the final collapse into the 2009 low (the C wave).
Don’t expect this to be the last of the problems as we go into the 2020s. The pandemic may just be the start. We still have to go through a major debt collapse. But that could be a year or two out, even as the pandemic is going to trigger a multitude of debt problems. There is just too much of debt and every collapse in history has centered around debt collapse. Pandemics are merely the trigger, a potential black swan event that eventually brings everything down.
The bear is over—so many headlines declared. So, why do they think it’s over? Because markets rallied 20% from their lows. Oh, for sure. The Dow Jones Industrials (DJI) quickly gained 24% this past week. With a 20% move up or down, everyone rushes in to declare the bear dead. Long live the new bull. Well, okay, maybe. We confess though, that we’ve never seen a 40-day bear market. That was it from the high of February 12 to the low on March 23. The shortest we’ve ever seen was the 1987 market that topped in August and bottomed 55 days later on October 19, 1987. Maybe this one does beat it, but we doubt it. With expectations that, at minimum, the COVID-19 crisis will not peak for at least another two to three weeks and Trump threatening complete lockdown of New York, New Jersey, and parts of Connecticut, the odds of a new bull anytime soon seem premature and wishful thinking.
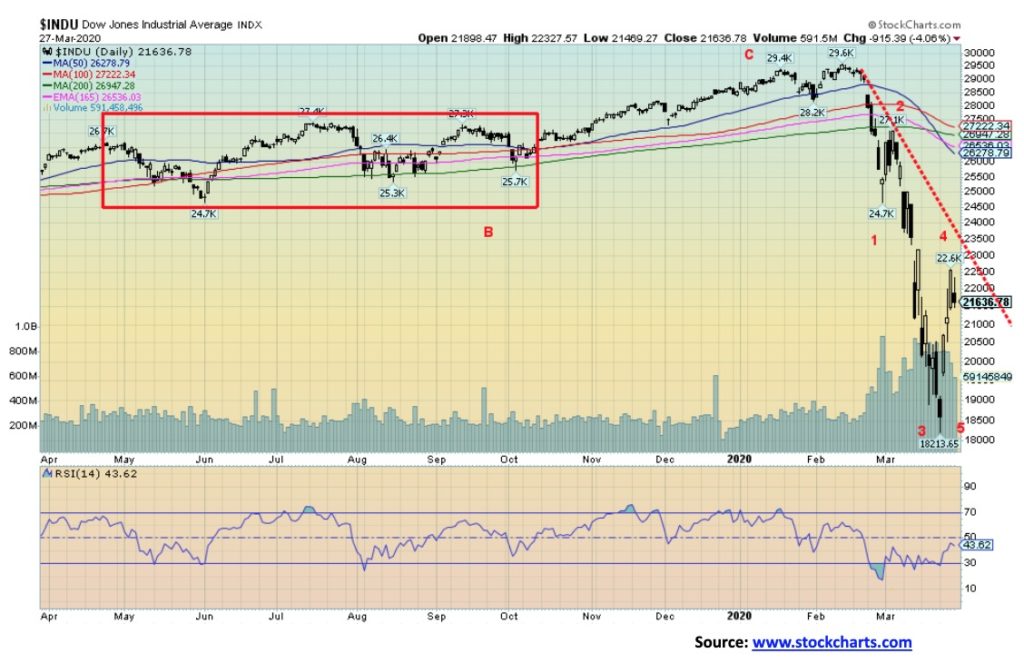
Oh, we know that a slew of indicators we follow are all flashing extremes or are diverging wildly between the indicator and the price action, but that does not necessarily signal a final low. Bear markets can be like that. Just when you think it’s safe to come out, the bear returns and slashes you to death. Besides, we like the impulse nature of that down wave and an impulse wave is 5 waves, not 3. Three appear to be complete and possibly the fourth. To come is wave 5 down. As we noted earlier with the S&P 500, our potential target zone is somewhere between 1,900 and 2,000. For the DJI, that could imply a decline to between 16,000–17,000. That would take us back to the vicinity of the 2016 lows. We believe that is a potential worst case.
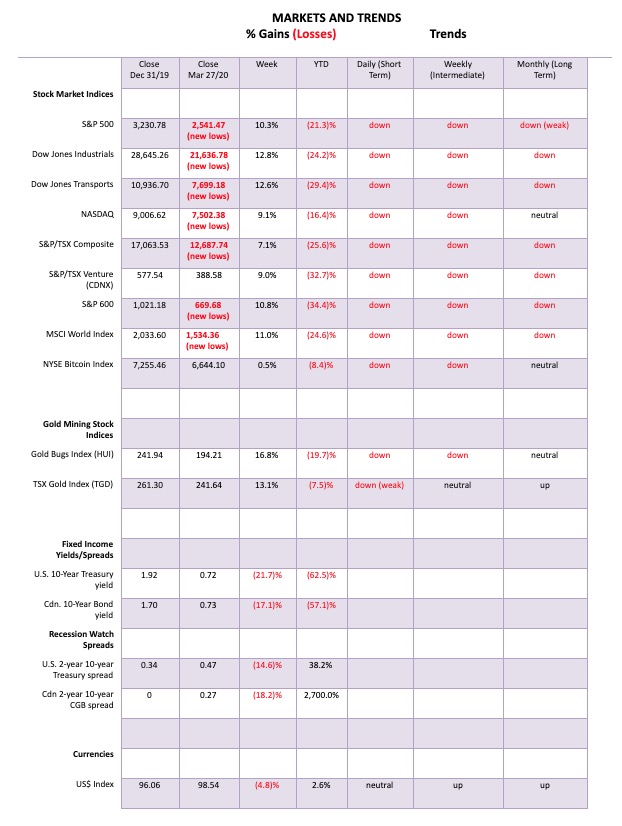
Everyone gained this past week. The DJI was up 12.8% on the week, the Dow Jones Transportations (DJT) gained 12.6%, the S&P 500 was up 10.3%, and the NASDAQ jumped 9.1%. The S&P 600 (small cap) gained 10.8%. But all remain firmly down on the year more than 20%, except for the NASDAQ which is down only 16.4% so far this year. Elsewhere, the TSX Composite gained 7.1% and the TSX Venture Exchange (CDNX) was up 9.0%. The MSCI World Index gained 11.0% and even Bitcoin managed to eke out a 0.5% gain. Overseas, the London FTSE was up 6.2% and the Paris CAC 40 gained 7.5% while the German DAX jumped 7.9%. China’s Shanghai Index (SSEC) was a poor performer, gaining only 1.0% but Japan’s Tokyo Nikkei Dow (TKN) jumped 17.1%. However, all remain in bear markets despite the gains.
Indicators diverging with the indices include the NYSE advance-decline line that is nowhere near where it was at the December 2018 low while the indices sliced through that low. The bulls love that indicator. The McClellan Summation Index (RASI) is at bearish extremes as is the S&P Bullish Percent Index (BPSPX). The percentage of stocks trading below their 200-day MA on the S&P 500 is at levels last seen in 2009. So, there are a number of potential bullish signs. The prime reason we think the bull call is right but it may be a bit premature. However, we are quite interested in the next low which could come in early to mid-April. That could coincide with some evidence that the coronavirus is slowing or has peaked.
All of that indicates we believe we are getting near a final low but we are not at it just yet. Then a significant bear market rally could get underway that could even take us to new highs before the third wave down commences into 2021.
For now, we remain cautious as the coronavirus numbers continue to soar. They now seem to be gaining by roughly 100,000 cases every 2 days. That implies we could cross a million cases sometime by Saturday, April 4. By mid-April, we could hit 1.5 million cases with over 50,000 dead. None of this is cheery, but we do see some light at the end of the tunnel and hopefully, it’s not a train.
The above scenario changes to a more positive one if the DJI were able to take out and close over 23,000. We’re are not counting on that to happen but remain cognizant. Otherwise, the trend remains down and we don’t believe we’ve seen our final low for this move.
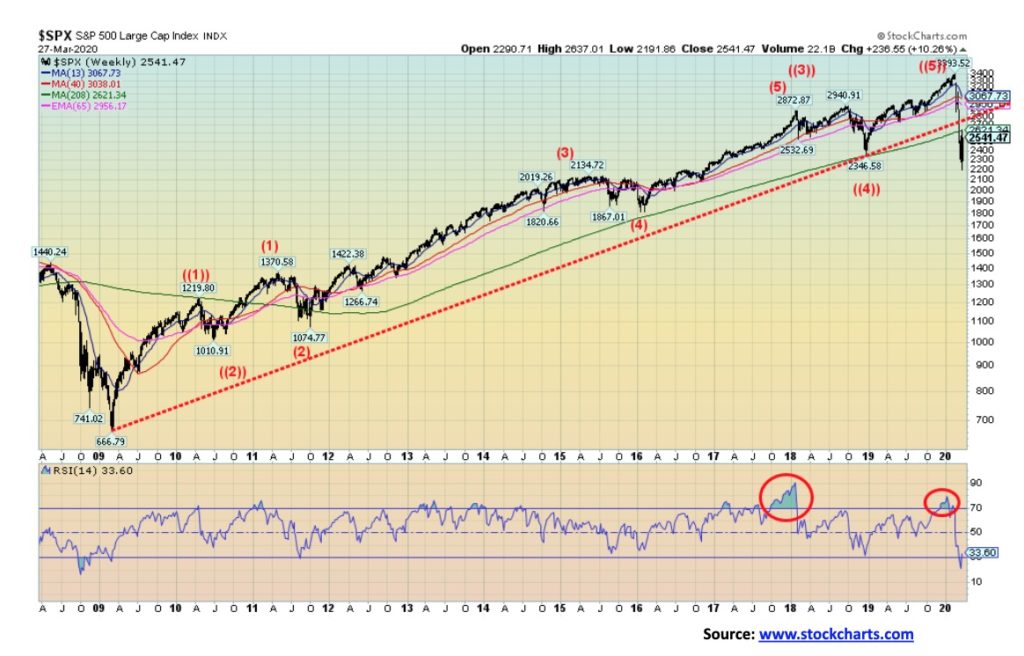
If there is any doubt that we have entered a potential major bear market it is this chart. The S&P 500 has broken down below the major trendline from 2009 low and it has broken down below the 4-year MA. The S&P 500 hasn’t been below the 4-year MA since 2011. After that, the 4-year MA acted as major support as witnessed by the test in 2016 and 2018. The nominal momentum top of this bull run was made in January 2018 even as the final top did not occur until February 2020. Extreme overbought conditions were seen in the indicators (RSI in this case) at the time of January 2018 high and the February 2020 high. While the weekly RSI is currently flashing oversold (below 30) it does not necessarily mean we have made a bottom. The RSI can go even lower. One has to normally await other signals. Solid closes above the 4-year MA currently at 2,620 might indicate a low is in place. It is interesting to note that during the 1987 stock market crash the S&P 500 tested the 4-year MA but it did not breakdown below it. The 1987 stock market crash proved to be a correction within a long-term bull market. That it has this time around broken below the 4-year MA, suggests to us that this is not a correction but the start of a secular bear market that could last years. Since 1900 we have experienced four secular bears. First the 1906-1921 bear through the panic of ’07, WW1 and the Spanish Flu pandemic; second the 1929-1949 Great Depression/WW2 bear; third the inflationary 70’s bear 1966-1982; and, fourth the 2000’s bear 2000-2009. The fifth is we believe underway.
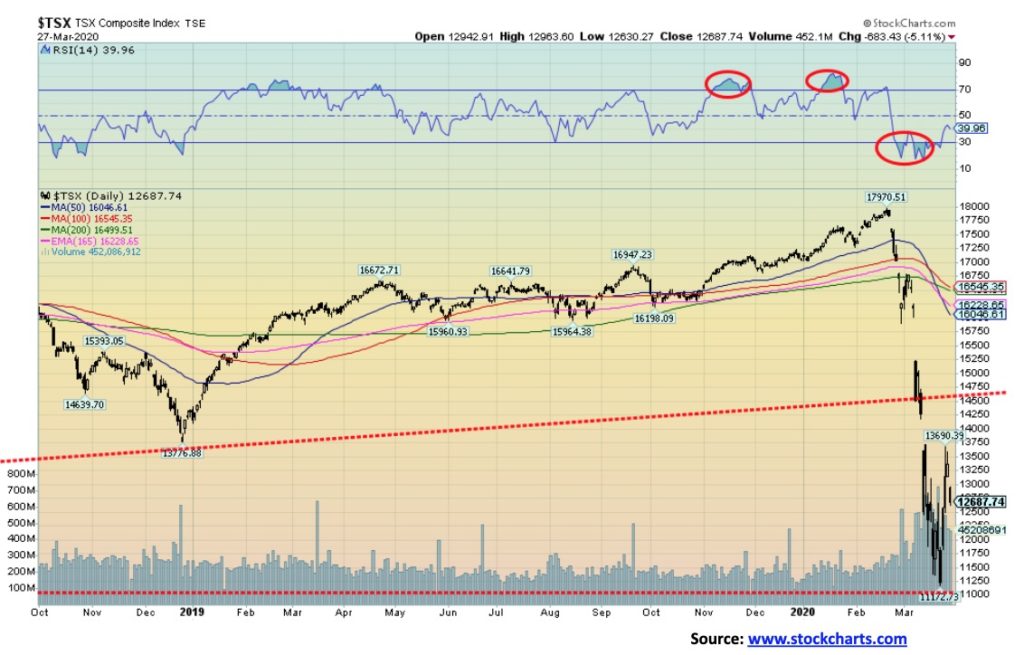
What can one say about the battered and bruised TSX? The TSX Composite, like other indices, bounced back this week with a gain of 7.1%. The TSX Venture Exchange (CDNX) fared even better, gaining 9.0%. Nonetheless, both remain down on the year with the TSX down 25.6% and the CDNX off 32.7%. The TSX sub-indices also had a good rebound week. With one exception: oddly, Consumer Staple (TCS) was off 1.0%. This is odd given the great position grocery stores are in. The best rebound was for Health Care (THC), up 15.3% followed by Golds (TGD), up 13.1%, Consumer Discretionary (TCD), up 14.4%, Metals & Mining (TGM), up 12.1% and Materials (TMT), up 11.7%. Everyone was up, even Energy (TEN), even though it was almost the weakest of the bunch, up 3.0%. Telecommunications (TTS) was up 2.5%.
The trends; short, intermediate and long, for the most part, are pointed down. Gold’s (TGD) long-term trend remains intact as does Information Technology (TIT).
In looking at the carnage amongst the TSX sub-indices, the best-looking ones appear to be Information Technology (TIT), Consumer Staples (TCS), and Golds (TGD). As we note further on, even the golds could become dicey, at least for a while. Most other sub-indices look toxic, although there may be gems amongst them particularly in Industrials (TIN) and Utilities (TUT). Financials, Energy, Health Care (surprising), and Real Estate look to be the worst.
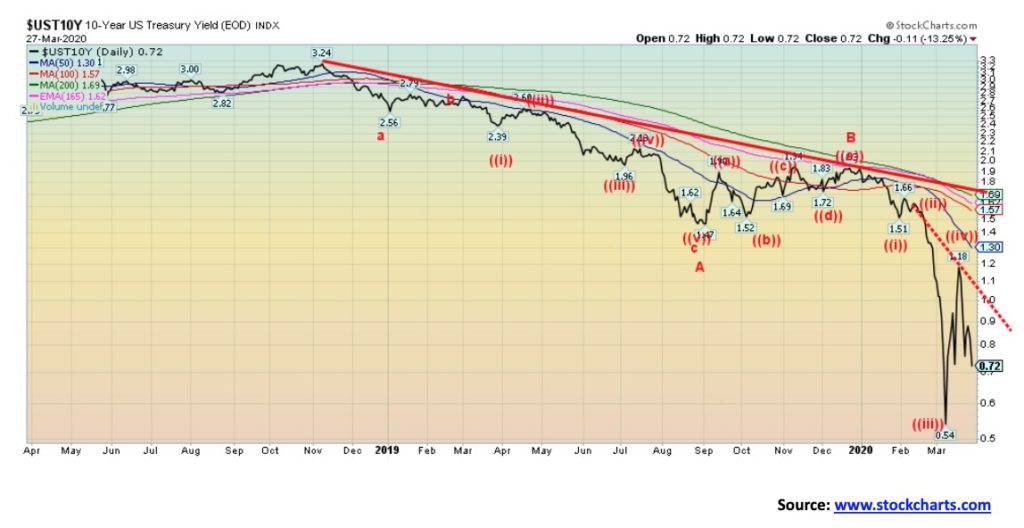
Everyone is cutting interest rates and that in turn is bringing the long rates down as well. This week the BofC joined the rate-cutting, lowering their key lending rate to 0.25%. Ten-year Government of Canada bonds (CGBs) fell to 73 bp from 88 bp. The 10-year U.S. treasury note dropped to 0.72% from 0.92% the previous week. Besides central banks dropping rates, they are embarking once again on a massive QE experiment. Even the BofC is getting into the fray on that one. The week’s economic numbers centered on the disasters, namely the huge jump in initial claims and the rapid fall of consumer confidence. Largely ignored were personal income and personal expenditures for February. Both rose with personal income, up 0.6% stronger than expected. Maybe they’ll need it as the coronavirus crisis deepens. The concern that treasuries are going to have out along the curve are the huge needs of the Federal government going forward to pay for all of this stimulus. One can ignore for the moment U.S. treasuries as a safe haven. That is obvious. But when the borrowings start, there may be a lack of available cash and higher yields may be needed. As well, the huge government needs will largely shut everyone else out of the market. The 10-year could fall down to the previous low near 0.54% once again to complete this down wave. If rates rise back above 1.00% it may be a sign that the fall in rates is over. Over 1.18% would confirm a low. After that, there is considerable resistance up to 1.70%.
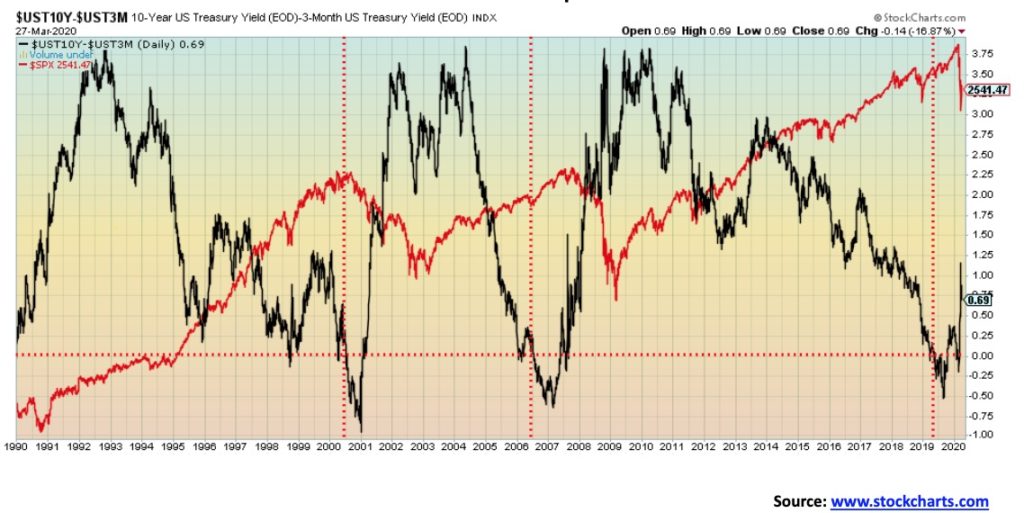
There is not much to say on the recession watch spread anymore. It first went negative in May 2019 and now, eight to nine months later, it’s very likely we are falling into a recession. Expect the spread to widen as it did during the 2000–2002 collapse and the 2007–2009 collapse. Getting back to 3–3.50 is probable. What that means is we expect the Fed to keep short rates artificially low and the pressure is on the long rates that rise.
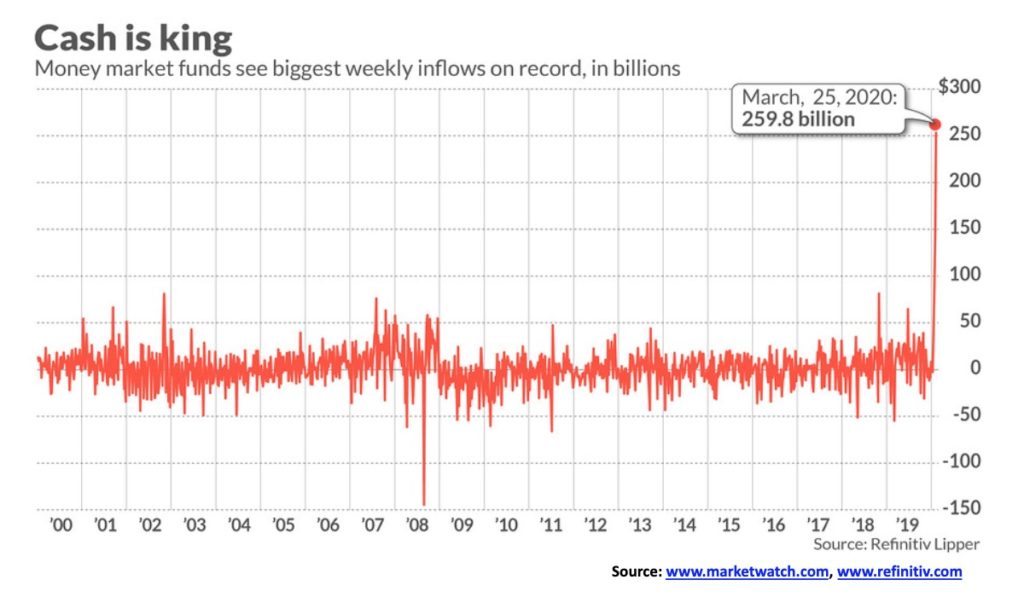
If investors are selling the stock market the fund inevitably goes somewhere and that somewhere is money market funds. Money market funds have soared in the U.S. (and probably here in Canada as well). For the past three flows into MM Funds have basically doubled every week and now sit at a record $259.8 billion. So, are MM funds safe? Well not quite as was shown during the 2008 financial crisis many MM funds had to be bailed out. As well they are not covered by FDIC or CDIC insurance as are bank deposits. The Fed has apparently already had to bail out the MM fund. In terms of market volatility, they are definitely safer than equities. But they are not the panacea everyone thinks.
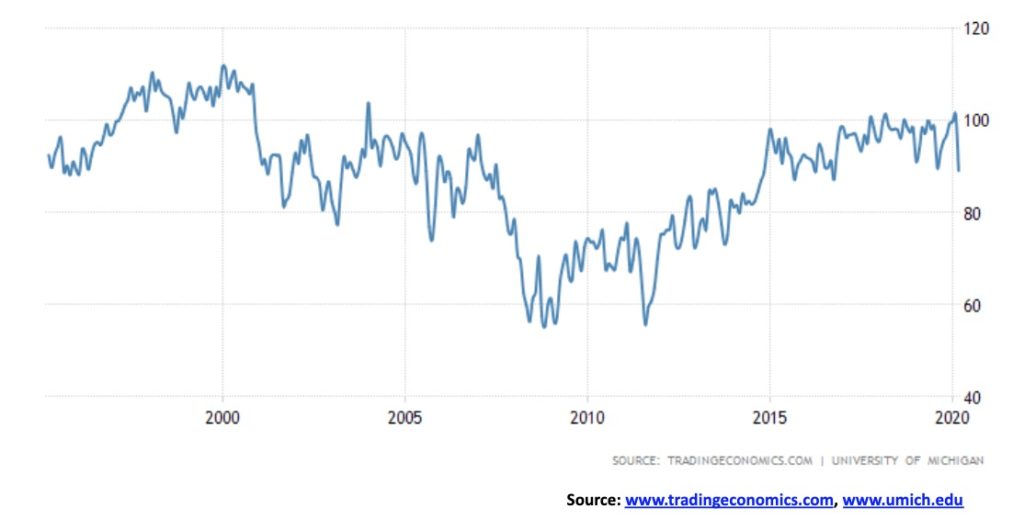
The University of Michigan’s Consumer Confidence Index had the largest one-month plunge since 2016 this month. The index plunged from 101.0 in February to 89.1 in March. It was the fourth-largest plunge in a half-century. Both current conditions and consumer expectations plunged as the stock market fell, and the COVID-19 gripped. Expect it to get worse, a lot worse. Eventually, a decline to the 2008–2010 levels is probable, maybe even lower. If the housing market starts falling as we expect, then it will help push the index lower.
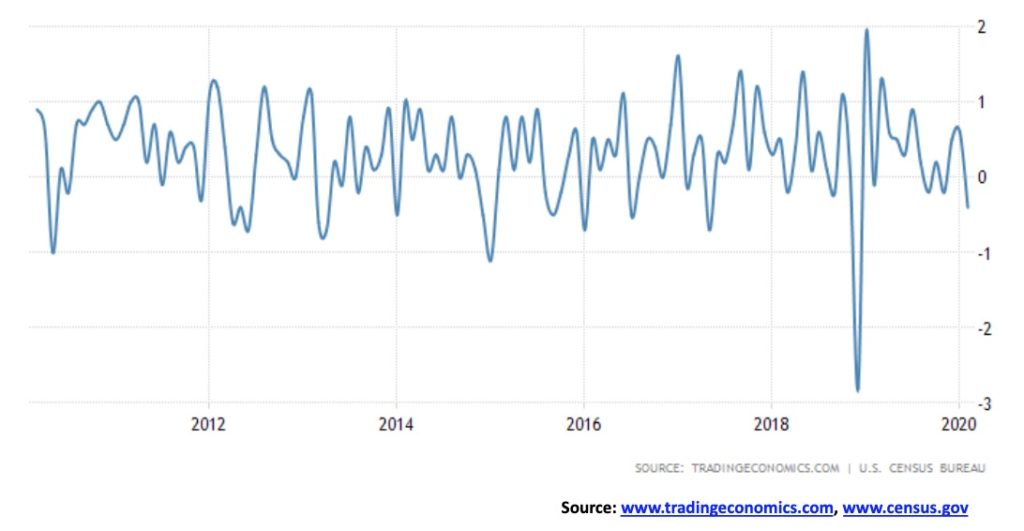
U.S. retail sales ex autos for February fell 0.4% after a revised 0.6% rise in January. Note this is for February. Expectations for March are that it will fall even more sharply. That downward spike relates to late 2018 when the stock market was falling and the trade wars with China were intensifying. Our expectations are that it will be taken out and we will fall to levels seen during the 2008 financial crisis when retail sales were falling 4%/month. Retail sales were already tepid at best for the economy.
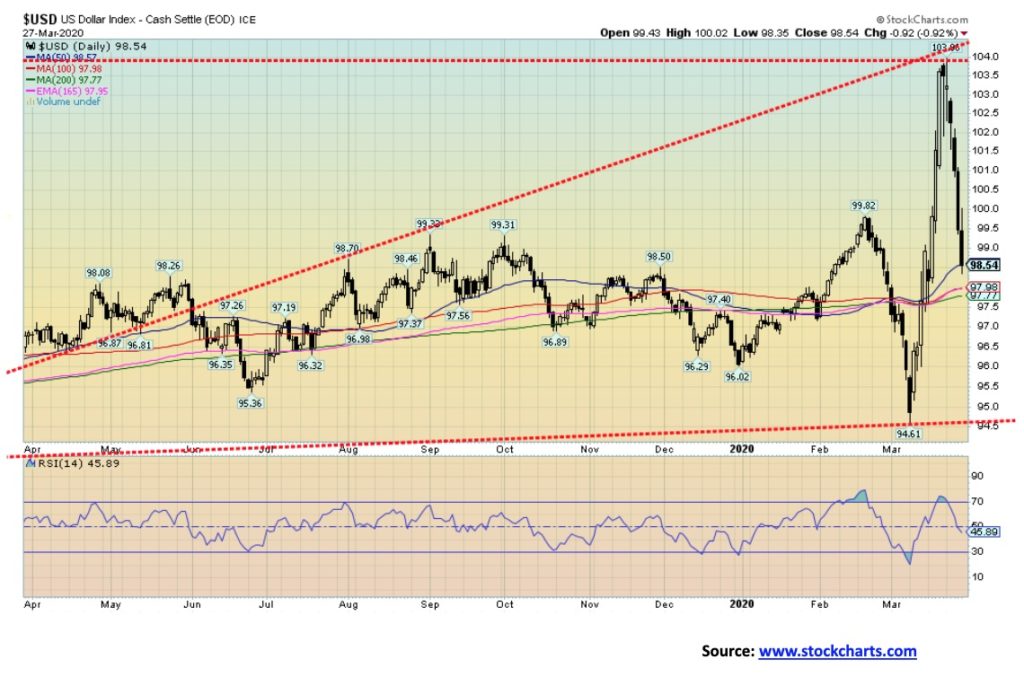
The US$ Index has had a wild March. Plunging to 94.61 by March 9, it then turned and shot up to a new high of 103.96 by March 23. Then it turned again and plunged this past week to close at 98.54. Talk about a wild ride. It shot up as capital fled China, the EU, and elsewhere, then collapsed as it realized the extent of the massive bailout taking place in the U.S as a result of the coronavirus crisis and a sharp deterioration in the U.S. economy. With the U.S. economy on shutdown, it is no wonder Jim Sinclair shouts QE to infinity and then the need to use gold to balance the balance sheets of the countries of the world. Okay, maybe, but not tomorrow.
The Fed has unleashed unlimited QE and huge lending programs to prevent the U.S. economy from completely going off the deep end. It may not succeed, but it’ll at least provide some cushion. The big problem with the high US$ Index was the huge amount of foreign debt denominated in U.S. dollars, making that debt considerably more expensive. The U.S. as well is showing early signs of falling into a recession with a collapse in consumer confidence and soaring unemployment claims. Recession, however, may turn out to be an understatement.
Technically, it is difficult trying to figure out where we are at. The failure near 104 came at the junction of two lines, one up from the lows of 2018 and the other one from old highs. The trouble is, the wave up from March 9 appears to have been an impulse wave A. This drop is corrective wave B. To come, another up-wave C that could take the US$ Index to new highs. We are not sure what might drive it. Granted, that changes if the US$ Index were to fall back under 97.50 and definitely under 96. There currently is considerable support down to 97.75.
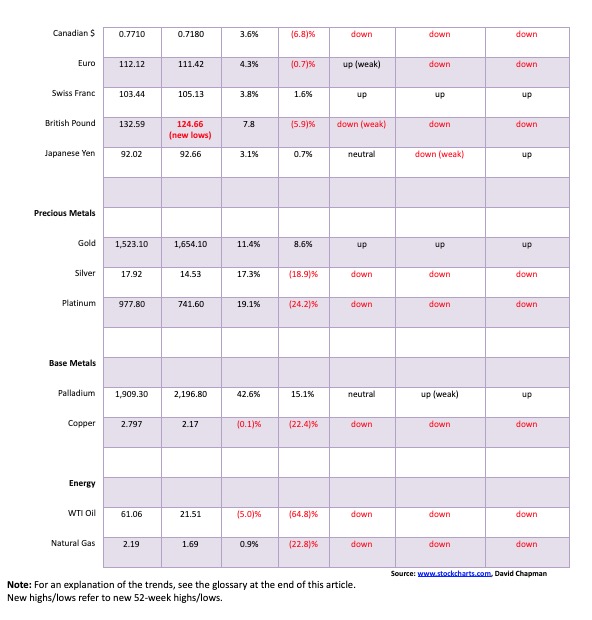
The US$ Index was down 4.8% this past week. That means other currencies were up with the euro up 4.3%, Swiss franc up 3.8%, pound sterling up 7.8%—impressive after making new lows—and the Japanese yen up 3.1%. The Canadian dollar gained 3.6%. However, for the most part, the other currencies remain in downtrends. The best currency outside the U.S. dollar is the Swiss franc. We remain gravely concerned about the survivability of the euro.
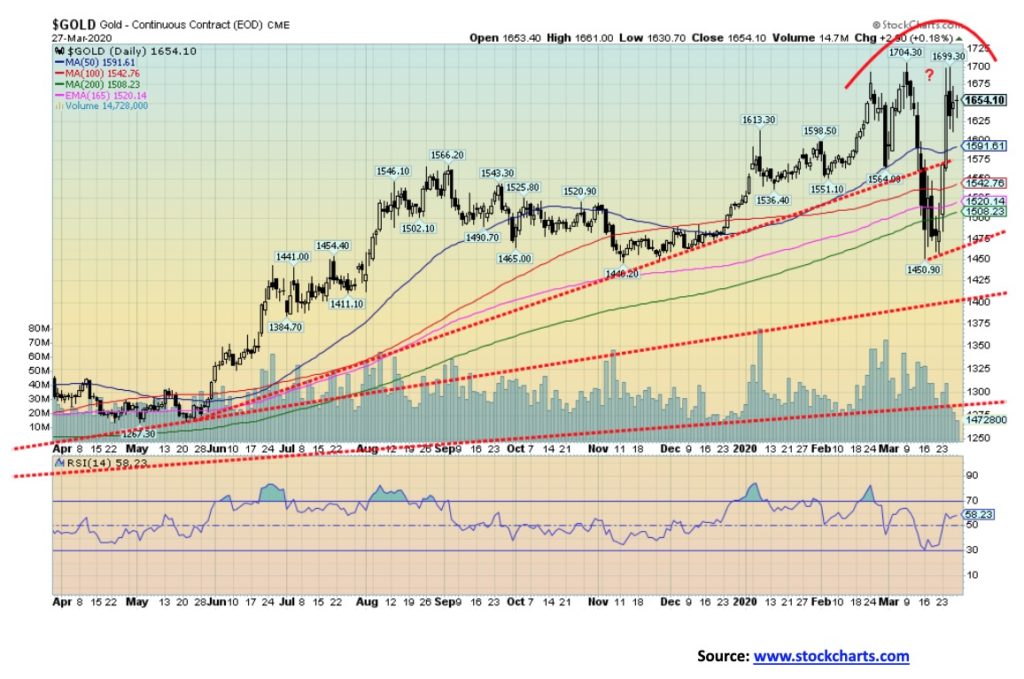
Gold needed to see new highs this week to avoid the potential of leaving what appears to be a double top on the charts. Naturally, we failed and we note that volume was not very impressive, suggesting this was a bear market rally. If it is a double top, the neckline is now down around $1,465. A breakdown under that level could imply a decline to around $1,210. At least that would be the first target. A subsequent target below that if that level failed to hold would be $1,055 and the 2015 low. We don’t want to think about that, but we can’t dismiss it. Elliott Wave International seems to believe by their wave count that we could go into a major meltdown for gold, taking prices below $1,000. We don’t want to dismiss it on one hand, but on the other hand, the bullish forecasts completely dominate any bearish forecasts. Gold (and silver) have gone into a slight backwardation with spot prices trading just above the first futures. This reflects the surge in demand for physical gold (and silver) bars and coins and a lack of supply. Spreads to spot for the purchase of coins and bars are as wide as we have ever seen. That is, if you can find any product.
This from the news wires (Commodity News Wires, March 27, 2020)—”gold prices on Friday fell back on reduced concerns about the availability of physical gold supplies after the London Bullion Market Association said gold suppliers are in talks to use chartered or cargo flights to transport gold to different delivery points across the globe. Gold prices earlier this week saw strength on tightness in the physical gold market. NY Comex gold futures on Tuesday jumped to the highest premium since 1980 against London gold due to the tightness of gold in the physical market. Switzerland’s gold refining industry, a major hub for processing gold into bars and coins, has largely shut down because of the coronavirus pandemic and airlines around the world have cut back on flights, leaving gold dealers unsure of whether they’ll be able to transport bullion around the world to satisfy delivery obligations.”
So, what does this mean? Well, we had heard rumors that the London Gold Pool was about to collapse. Its collapse in the 1960s led to Richard Nixon closing the gold window in August 1971 and then it led to one of the biggest gold rallies in history as gold prices soared from the fixed rate of $35 in 1971 to $875 by January 1980. Mind you, there were a few bumps along the way. So apparently the London Gold Pool is not about to collapse. Which is good. But if you really wanted higher prices it might put a damper on things.
Gold sentiment soared with the recent jump. Gold was up 11.4% this past week and, given it is up 8.6% on the year, it is the only real bright spot amongst a sea of despair. As to the cycles, we have no argument that we could be in the process of making our 31-month cycle low (range 26–36 months). We are now 19 months from the August 2018 low, the last pegged 31-month cycle low. So, we are too early. That puts the potential low out to at least September 2020. The next six months might be an irregular choppy decline.
Only one thing can keep this alive and that is new highs above $1,705 with an accompaniment of a pickup in volume. Overall, we achieved at least minimum targets. But we worry that the bullish sentiment is too high and silver still lags too far behind. And now the technicals look, at minimum, questionable.
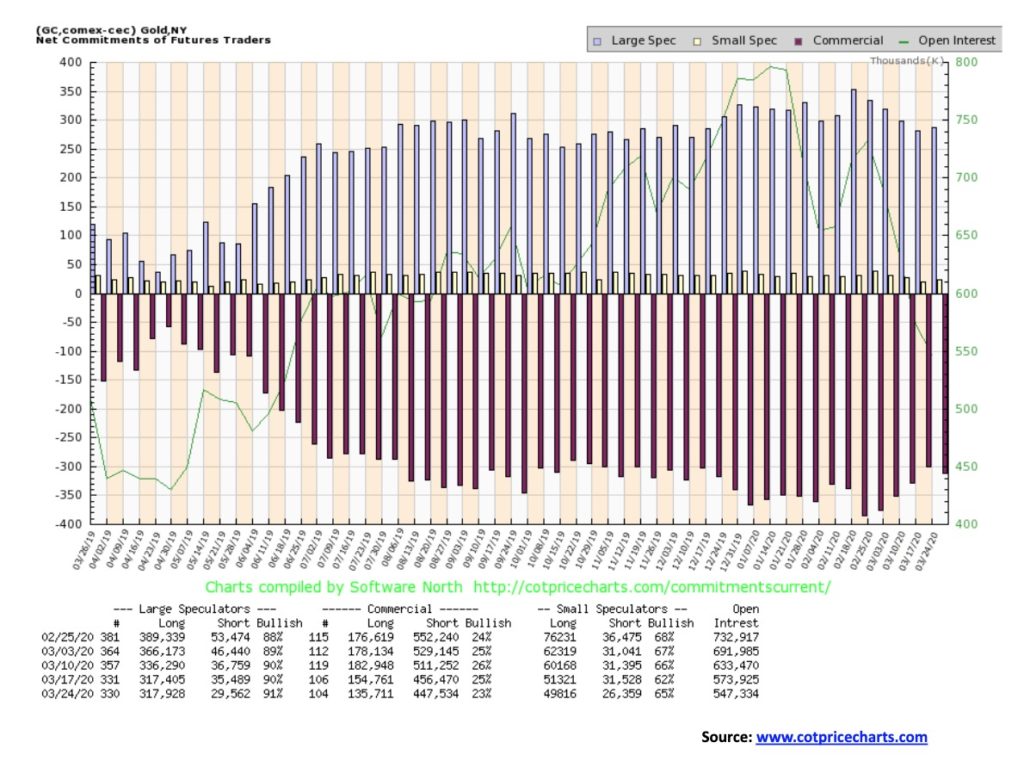
As gold soared this past week the gold commercial COT deepened, falling from 25% to 23%. Clearly, the commercial COT covered longs as long open interest fell roughly 19,000 contracts while short open interest also fell down roughly 9,000 contracts. The large speculators COT (hedge funds, managed futures, etc.) COT rose to 91% from 90%. That may be a record. It wasn’t as if their longs grew as it was relatively flat, but their short open interest fell roughly 6,000 contracts. While open interest continues to fall, suggesting that as the market goes higher it is all short covering or in some cases long covering, the COT remains bearish. In a rising market, you want to see long open interest rising and short open interest falling, but that’s not happening. With the volume down as well, it appears to be indicating at best a weak market.
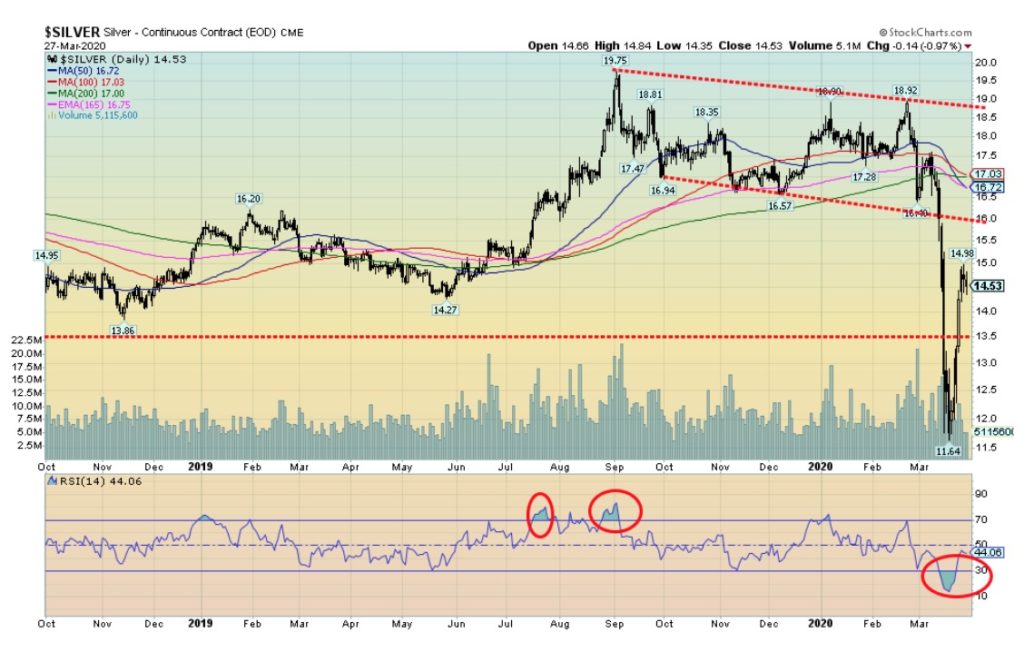
Silver continues its struggle back to the upside, but, so far, we haven’t even been able to regain the now falling 50- and 100-day MA, nor the flattening 200-day MA. Silver gained 17.3% this past week, one of its best weeks in months. If we treat our topping pattern as if it were a descending triangle, the potential target zone was $12.90. Well, we exceeded that point. The next target zone would be $10.95. At $11.64 we were getting close. And, while we are loath to say it, at least we’ll have it in mind if $10.95 were to fall; then the final target zone would be $7.75. Am I surprised to see Elliott Wave International predicting a fall in silver prices with a target zone of under $7? Elliott Wave International seems to be of the mind that we will make those major 7.83 years and 23.5-year cycle lows we have noted in the past now rather than later. Yes, it is possible. But we confess we didn’t think it would come this early. The last 7.83-year gold cycle low was December 2015 and the last 23.5-year cycle was seen in 2001. Silver follows what appears to be an 18.5-year cycle. The last one was seen in 2008, so that makes the next one due in 2023–2030. So, this is too early. However, silver also subdivides the 18.5-year cycle into three 6-year cycles. One was seen in 2014, so one this year would be in keeping with that cycle. $11.64 was the cycle low but, unfortunately, we can’t yet say that was our 6-year cycle low. At least not until silver regains first above $17.25 and then starts making new highs above $19.75. Volume has been falling on this rally, suggesting it is a bear market rally, not the start of a new up leg.
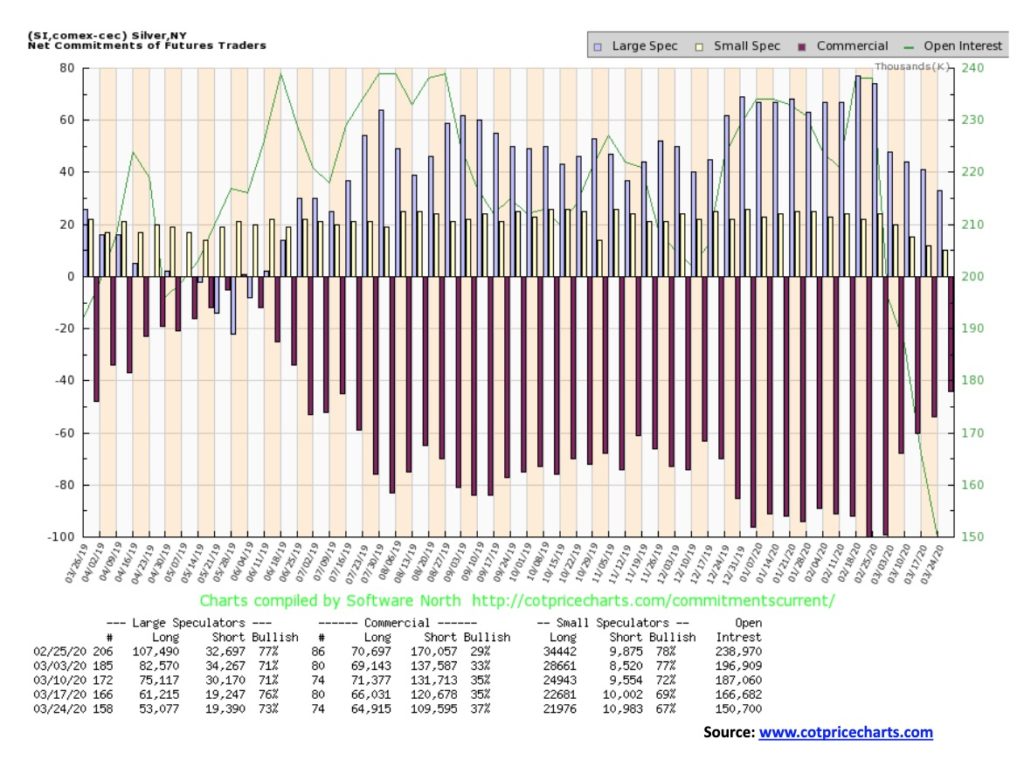
The silver commercial COT continues to improve, rising this past week to 37% from 35%. Long open interest fell about 1,000 contracts while short open interest dropped roughly 11,000 contracts. That is indicative of a weak market. The large speculators COT fell to 73% from 76%. So the price is rising but open interest and volume are falling. That is more indicative of a weak market.
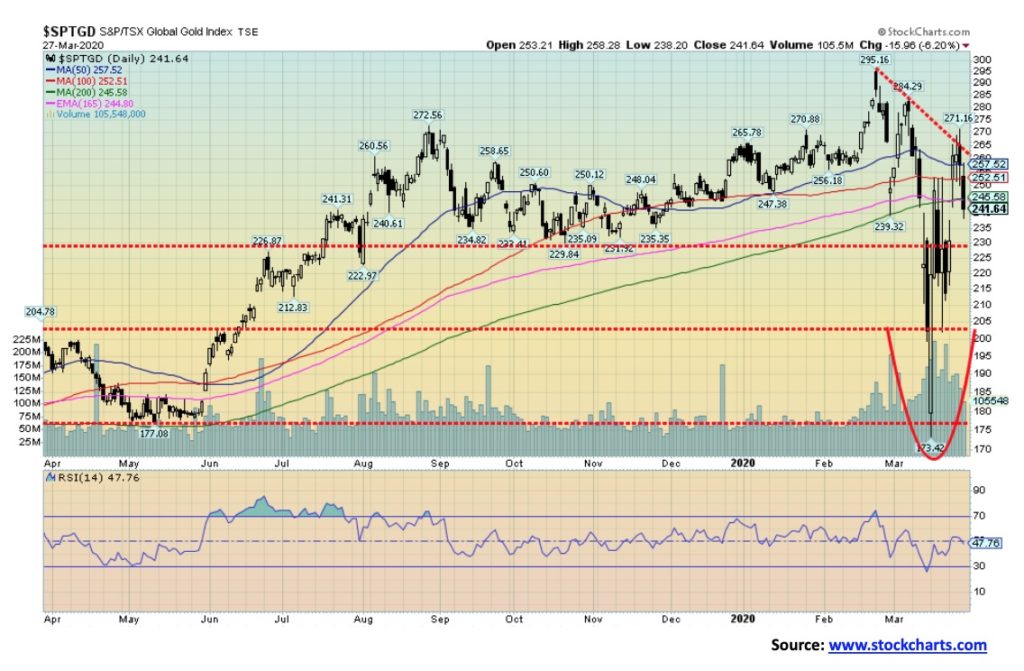
The TSX Gold Index (TGD) gained a healthy 13.1% this past week while the Gold Bugs Index (HUI) jumped 16.8%. Both remain down on the year, however, with the TGD off 7.5% and the HUI down 19.7%. Still, the gold miners have been one of the bright spots in the crashing markets. Of concern was that the TGD fell just short of levels that would have told us that new highs above 295 were highly probable. We did take out 266 which was our breakout number, but it failed to hold and we closed well below at about 242. That is at least a short-term negative. The question is, are we just going to go right back down or can we consolidate around these levels before making another upward assault? We have some support around 230, but below that, we could fall swiftly to 200. Below 200, new lows are possible. Despite the rapid upward move since the March 13 low, indicators are not overbought. The question for us is: was this a bear market rally, albeit a pretty strong one, or is this the start of a new up leg? Thursday’s new high followed by a downward reversal is a negative sign that again, at least for the short term, the market looks vulnerable to more downward selling. The entire pattern over the past 6–8 months now has the look of a top. The odd part is, the potential target for the top was around 165 and the recent low was seen at 173. Mission accomplished?
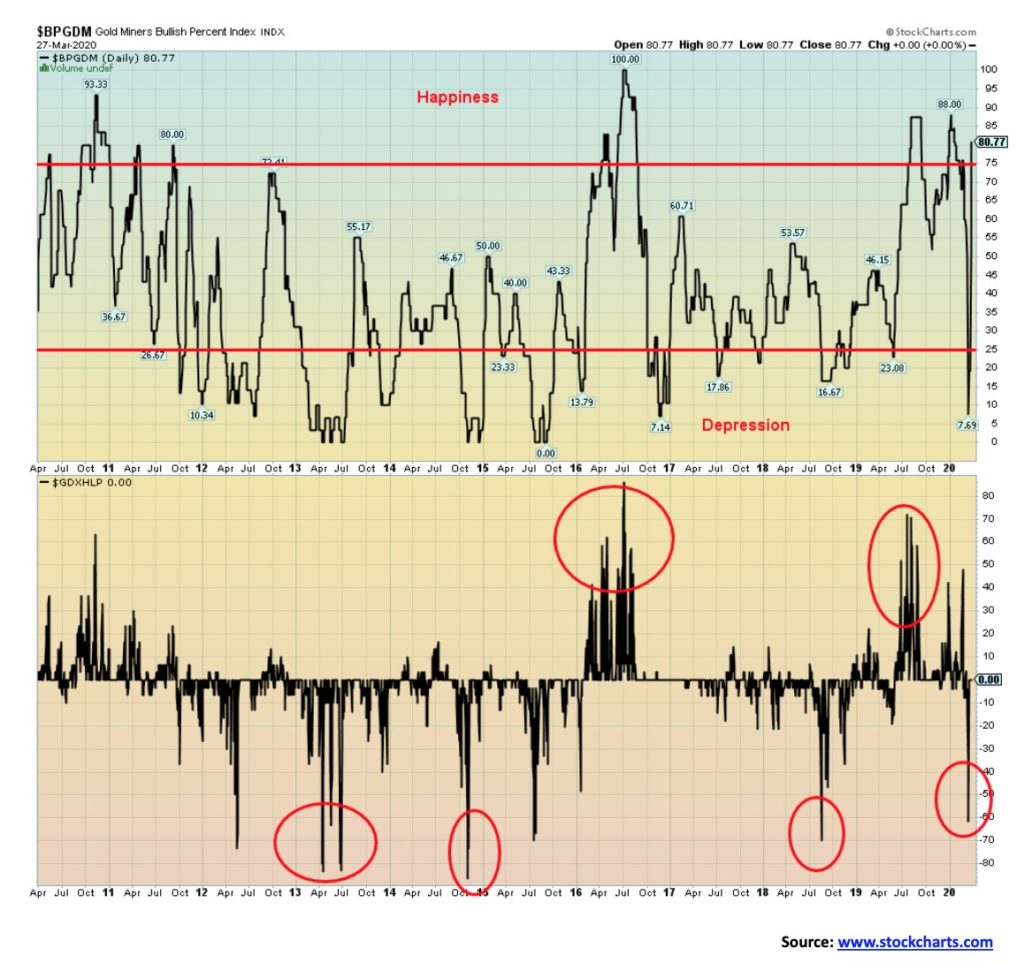
It is somewhat concerning that, given the rise for the gold stocks as represented by the HUI and TGD, the Gold Miners Bullish Percent Index (BPGDM) has soared from 7.69 to 80.77 in a heartbeat. Depression to happiness in 10 days. Something is not right. And it may well mean that gold stocks are going to pull back here as we saw on Friday. The Gold Miners New Highs – New Lows Index (GDXHLP) move was not as dramatic with it moving from negative 61.54 to 0 in 11 days. That the indicator is not at levels that might signify a top it is a divergence with the BPGDM. And it may also be a helpful divergence, depending on which one is right. That translates as the gold miners have room to move higher but we need a pause/pullback to help ease the BPGDM first.
It is somewhat concerning that, given the rise for the gold stocks as represented by the HUI and TGD, the Gold Miners Bullish Percent Index (BPGDM) has soared from 7.69 to 80.77 in a heartbeat. Depression to happiness in 10 days. Something is not right. And it may well mean that gold stocks are going to pull back here as we saw on Friday. The Gold Miners New Highs – New Lows Index (GDXHLP) move was not as dramatic with it moving from negative 61.54 to 0 in 11 days. That the indicator is not at levels that might signify a top it is a divergence with the BPGDM. And it may also be a helpful divergence, depending on which one is right. That translates as the gold miners have room to move higher but we need a pause/pullback to help ease the BPGDM first.
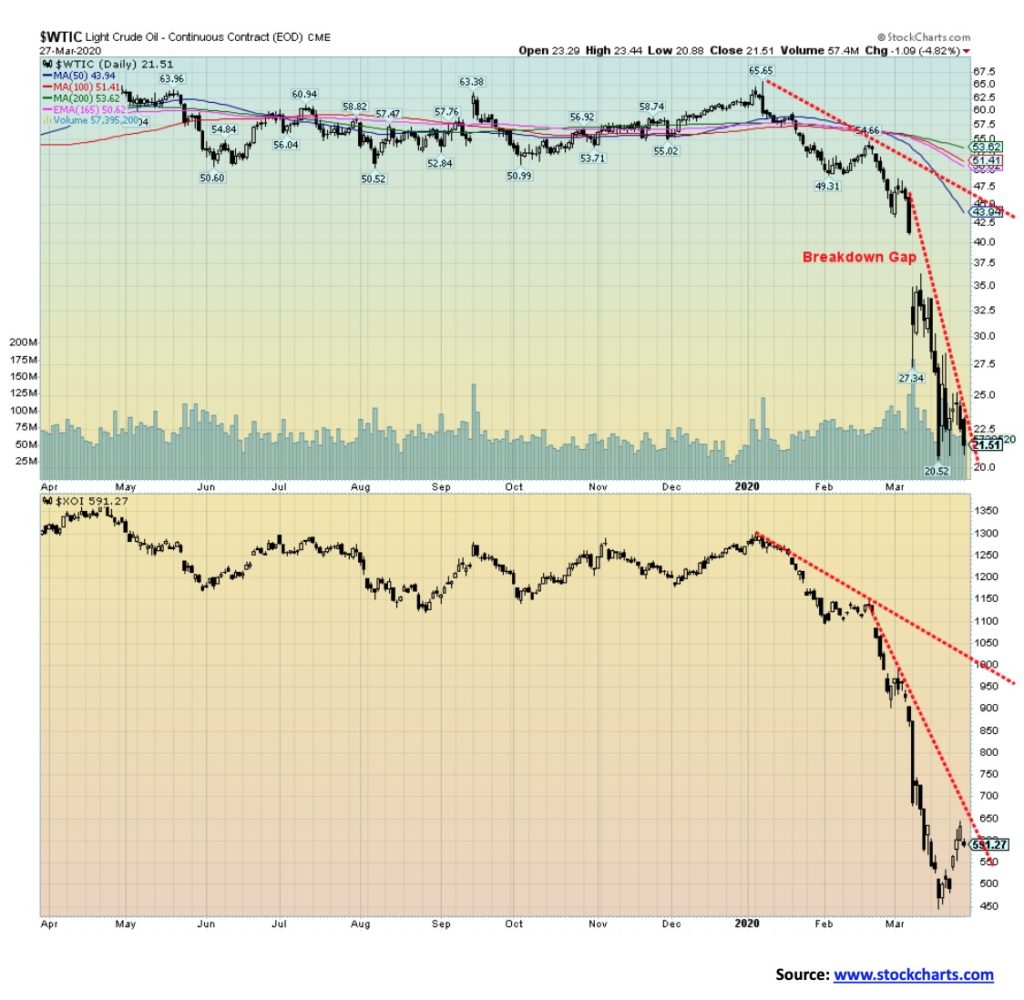
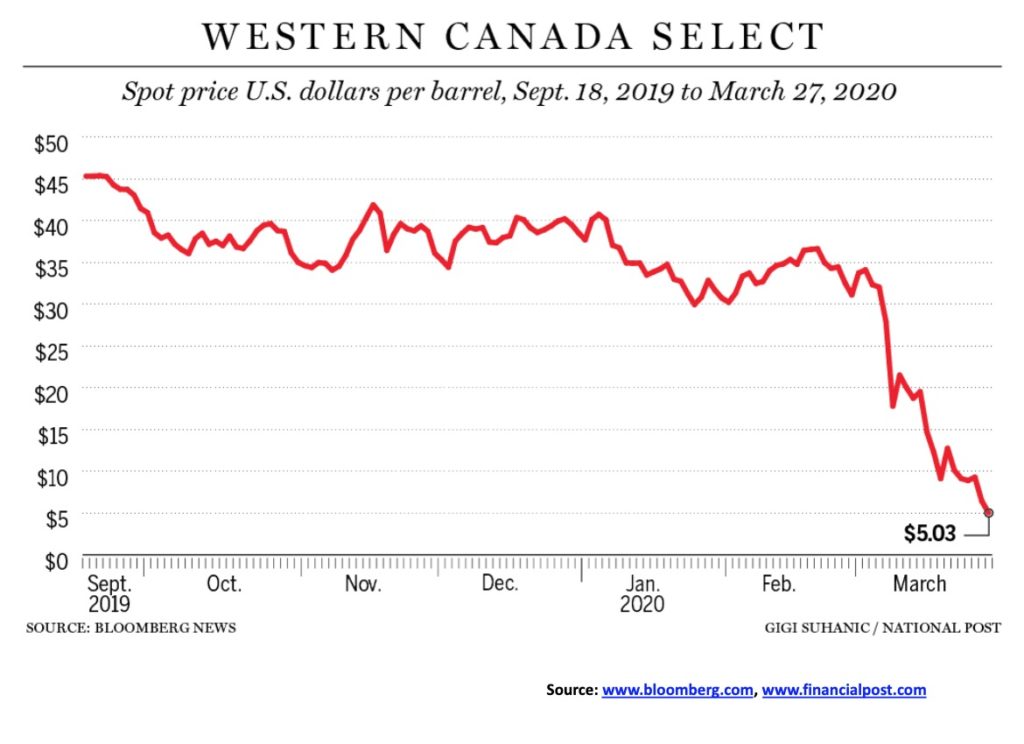
The global glut of oil continues to deepen. WTI oil fell to its lowest weekly closing level this past week at $21.50. Many are now expecting it soon to fall into the teens and some expect it to even fall eventually under $10. Maybe they are too pessimistic. But, then again…
There is no joy on the horizon for oil. Unemployment in the oil fields is expected to soar, taking away 10s of thousands of high-paying jobs. The U.S. Department of Energy was going to buy more oil for its strategic reserves but realized they didn’t really need it. The top five oil majors added $25 billion in debt last year and hiked dividends. Dividends are on the ropes to be cut and they still might need more debt which they will have a very difficult time in raising—and at what price. Apparently, over half of Latin America’s oil is now uneconomic. In Europe, their gas reserves are filled to the brim over 60%, the highest ever.
The U.S. and Saudi Arabia are sniping at each other. The oil war intensifies with some refiners and countries taking sides, and apparently Saudi Arabia is having trouble finding buyers for its oil. The U.S. has threatened to stop support for Saudi Arabia for the war in Yemen.
Shut in oil is a disaster. Bloomberg noted that Wyoming Sweet was down to $1.75/barrel. Alberta Western Canada Select was down to $5.03 (chart below) or about Cdn$7.30. The game Barrel of Monkeys costs Cdn$9.99. A liter of olive oil can be had for around Cdn$10.
Meanwhile, the oil war intensifies. However, we here in Toronto are now seeing gasoline under Cdn$0.70/litre. However, where can go? So, it’s moot.
We understand world oil storage is roughly 70% full. As storage maxes out major cuts will be required. There is no joy in oil land. Alberta’s GDP is projected to fall over 5% in 2020.
—
(Featured image by Pexels from Pixabay)
DISCLAIMER: This article was written by a third party contributor and does not reflect the opinion of Born2Invest, its management, staff or its associates. Please review our disclaimer for more information.
This article may include forward-looking statements. These forward-looking statements generally are identified by the words “believe,” “project,” “estimate,” “become,” “plan,” “will,” and similar expressions. These forward-looking statements involve known and unknown risks as well as uncertainties, including those discussed in the following cautionary statements and elsewhere in this article and on this site. Although the Company may believe that its expectations are based on reasonable assumptions, the actual results that the Company may achieve may differ materially from any forward-looking statements, which reflect the opinions of the management of the Company only as of the date hereof. Additionally, please make sure to read these important disclosures.


The TopRanked.io Weekly Affiliate Marketing Digest [The Top VPN Affiliate Programs Roundup]
Want to be let in on a little secret about two massive affiliate opportunities you can take advantage of today?...


Sustainable Finance Faces Hurdles as Green Asset Ratio Reforms Fall Short of Full Transparency
The Green Asset Ratio (GAR) measures banks' alignment with the EU Taxonomy but remains low due to methodological flaws and...


XRP Hits New All-Time High Amid U.S. Crypto Policy Shift and Ripple’s Expansion
XRP surged past its 2018 all-time high, reaching $3.65 amid renewed political support for crypto in the U.S. under Trump....


Germany Moves to Curb Medical Cannabis Abuse, Sparking Access Concerns
Medical cannabis imports in Germany have surged, but health insurance-covered prescriptions remain low. Easy online access raises concerns about abuse...


JPMorgan’s Data Fees Shake Fintech: PayPal Takes a Hit
JPMorgan Chase will charge fintechs for customer data, threatening business models reliant on free access. PayPal’s stock plunged 5.7% after...
 |
|
 |  |
 |
|
-

 Crypto2 weeks ago
XRP vs. Litecoin: The Race for the Next Crypto ETF Heats Up
-

 Crypto1 day ago
Crypto Markets Surge on Inflation Optimism and Rate Cut Hopes
-

 Biotech1 week ago
Spain Invests €126.9M in Groundbreaking EU Health Innovation Project Med4Cure
-

 Biotech4 days ago
Advancing Sarcoma Treatment: CAR-T Cell Therapy Offers Hope for Rare Tumors