Markets
The S&P 500 soared to new all-time highs last week
The S&P 500 made new highs this week, as did the NASDAQ, the Russell 2000 and the MSCI World Index. But the Dow Jones Industrials (DJI) did not having made its high four days earlier.

It was another quiet week for the markets even as the S&P 500 hit new all-time highs less than 25 points from 2,500. Investor focus continued to be on Trump and the goings-on at the White House. For months, years even, Republicans and Trump vowed that there would be health care reform by ending Obamacare and bringing in their own version. Tax reform was another part of the agenda that was top in investors’ minds. By week’s end, health reform lay in tatters and tax reform is becoming doubtful. Despite a number of iterations of repeal-and-replace Obamacare, in the end, they did not satisfy enough Republican senators to push it through the Senate. It went either too far or not far enough. In desperation, they went for a straight repeal and that one proved to be dead on arrival.
After six months of Republicans controlling the White House, Congress, and the Senate they have not been able to pass one piece of major legislation. While seemingly it has not weighed on the stock markets, it does appear to be weighing on the US Dollar as the US$ Index sunk to new 52-week lows. As to tax reform, well, that appears to be going nowhere either and deadlines loom at the end of the fiscal year September 30, 2017. The debt ceiling is looming once again as the Treasury is poised to run out of money in early October—unless, of course, they agree to extend it once again. The debt ceiling debate is becoming increasingly rancorous, but not between Republicans and Democrats—instead, between Republicans and Republicans. The White House is on one side and Congress on the other, with one wanting and recognizing the need to raise the debt ceiling while the other wants to slam on the brakes for their own agenda.
In economic news, as if anyone was paying attention given the attention on the White House, China reported a 6.9% gain in GDP for Q2 beating expectations. The news shored up confidence in the Asian giant. Oil prices received a shot in the arm with a larger withdrawal number than was expected and that helped push prices up a little. But the rally didn’t last long and oil prices quickly faded on the suggestion that OPEC might increase production. Oil ended the week in the red.
But focus continues to be on the sinking US$. If the US$ soared because of confidence in what Trump was going to do, it is now sinking on the realization that nothing is getting done and it may continue that way along with the growing Russian scandal that no one really knows what direction it will take. As well, the EU and Japanese economies are doing ok—well, just okay –and while the BOJ is not prepared to change course the ECB has hinted they might tighten. Tightening interest rates in the EU would be US$ negative if it turns out the Fed is just about done with their hikes.
No, the focus continues to be in Washington, DC and the markets and the economy appear to be just a sideshow.
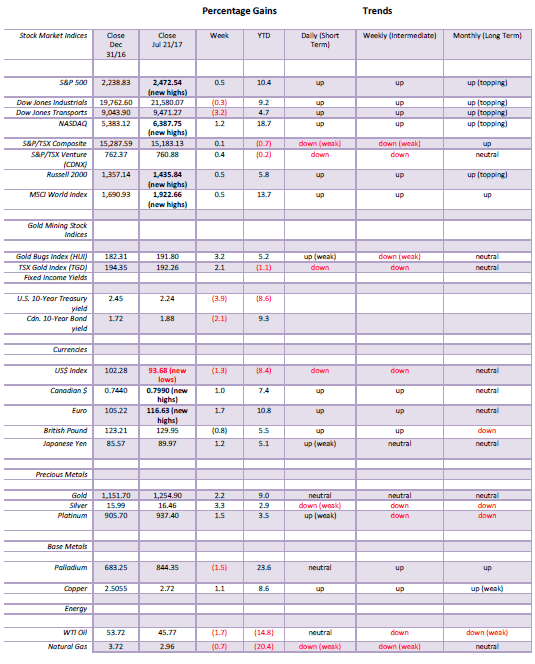
MARKETS AND TRENDS
© David Chapman
Note: For an explanation of the trends, see the glossary at the end of this article.
New highs refer to new 52-week highs.
(Source)
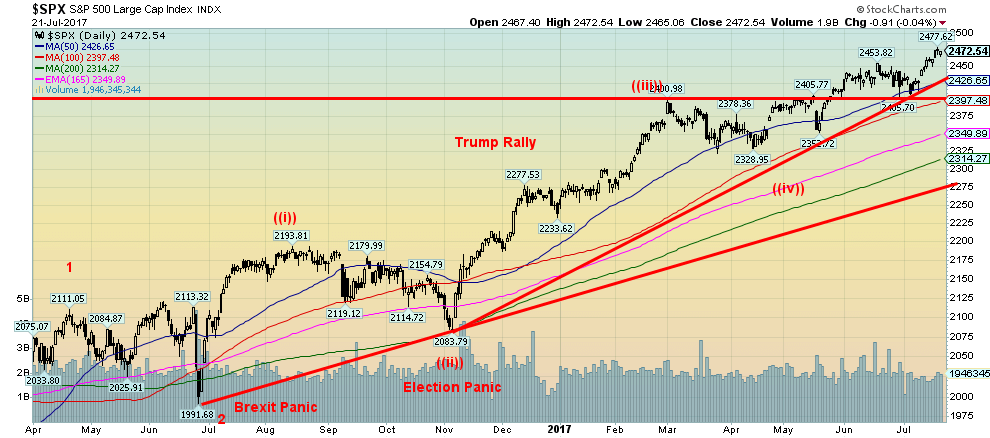
The S&P 500 soared to new all-time highs this past week within 25 points of 2,500 on a wave of optimism. We say a wave of optimism as apparently the Market Vanes Bullish Consensus hit levels this past week comparable to what was seen in October 2007. If we recall October 2007 was the last significant top before the 2008 financial crash unfolded. If the wave of optimism is correct then this could be the top of wave 3 up. A sharp pullback could follow, followed once again by another move to new all-time highs to complete wave 5. That in all likelihood would then complete five major waves up from the March 2009 low (see next chart).
The S&P 500 made new highs this week, as did the NASDAQ, the Russell 2000 and the MSCI World Index. But the Dow Jones Industrials (DJI) did not having made its high four days earlier. The Dow Jones Transportations (DJT) also did not make new highs this past week having made its high five days ago. Indeed, the DJT fell sharply this past week losing 3.2%. The DJI also had a losing week but it was small off 0.3% while the S&P 500 gained 0.5%.
So far the stock markets appear to be oblivious to the weekly follies in the White House as the Trump agenda meets failure after failure and the Russian investigation intensifies. So is the market beginning to pay attention? Well, it is too early to tell. We constantly read stuff about how the market is in a bubble, and it is, but the stories imply the greatest crash in history lies just around the corner. We may be bearish longer term but in the interim we see few signs that this market is finished although a minor pullback could get underway. After eight years to the upside, we suspect this market will end in a blow-off of some proportion. After a pullback, the final blow-off could get under way. Then again……
The current breakdown point is at 2,400. As long as the market stays above that level odds favor higher prices. A good sharp pullback for wave 4 would be to see the market drop to the uptrend line from the Brexit panic that connects with the election panic. That level is currently around 2,275. The 200-day MA is at 2,314. If the market not only holds above 2,400 but also above 2,430 then the odds are we will see higher prices.
(Source)
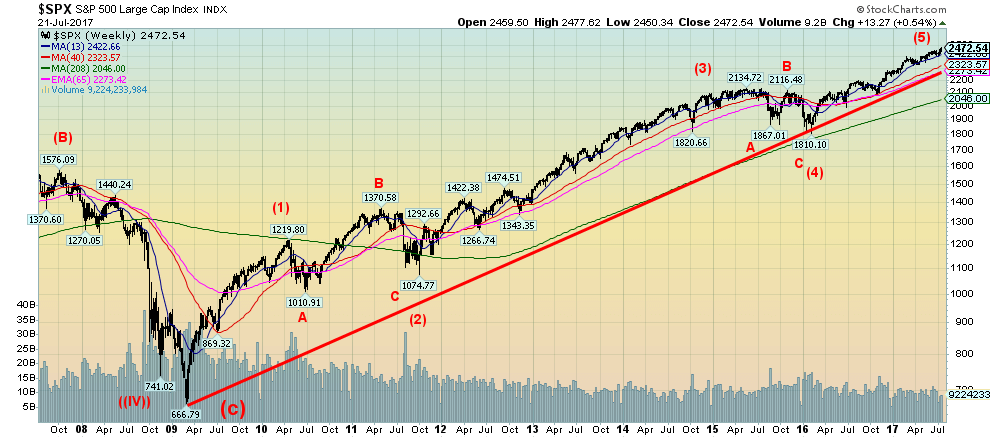
The bigger picture shows how five waves up are unfolding from the 2009 low. Wave 2 was the 2011 EU crisis centered on Greece while wave 4 was the end of QE. We know we are in a fifth wave to the upside and that it will be the final one before a more severe correction sets in. Our suspicion, however, is that the correction would not get underway until at least 2018 and may take a couple of years before the final bottom is seen. A normal correction could see it correct anywhere from 50% to 62% of the previous rise. That would imply a decline to at least 1,575 or further down to 1,360. Given the strength of the rise, we now doubt that any collapse would fall as far as the 2009 low at 667. Naturally, that assessment could change. A collapse in the market would, we suspect, coincide with a major political crisis in Washington.
(Source)
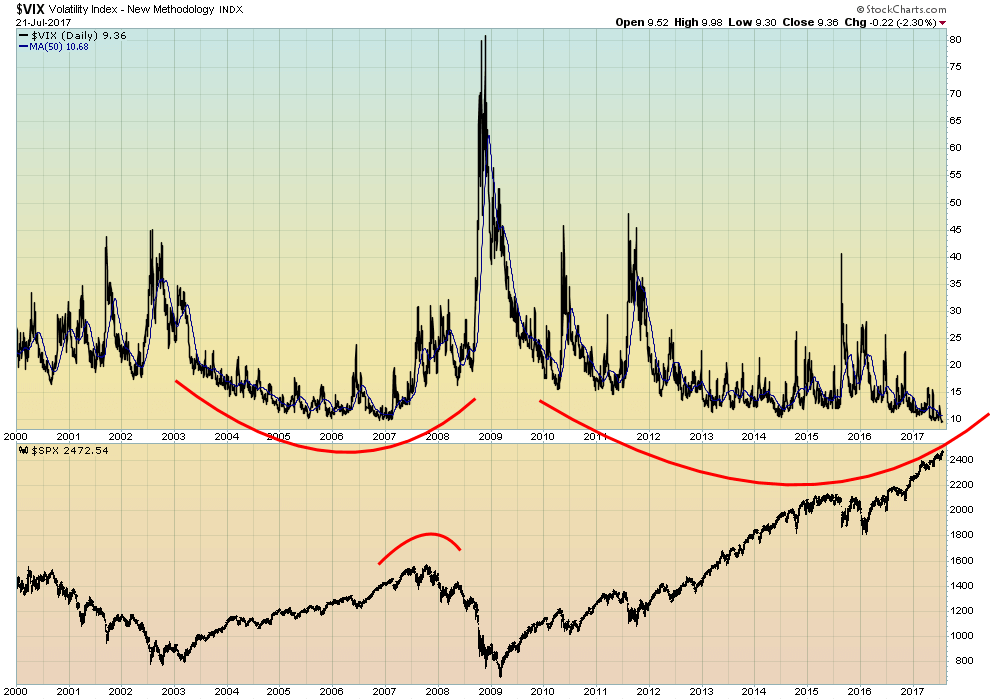
Hard to believe but the VIX volatility index is now lower than it has ever been since 2000, even below the lows of 2007. The VIX closed at 9.36 this past week as the S&P 500 hit new all-time highs. Fear in the market? What fear in the market? There is simply none. (The VIX moves inversely to the price of the S&P 500 and is a measure of volatility in the market and is a measure of fear and greed in the market. Currently, there is little fear but it appears there is lots of greed.)
Notice the spikes in 2011 and again in 2015/2016 when the market corrected. Of course, during the 2008 financial crisis, the VIX soared leaving all of the other spikes behind in the dust. Fear ruled! But as the chart demonstrates complacency and greed in the market can stay around a lot longer than most people expect. That usually translates into the fact that they are unprepared for eventual correction and the market over reacts to the downside spiking the VIX.
(Source)
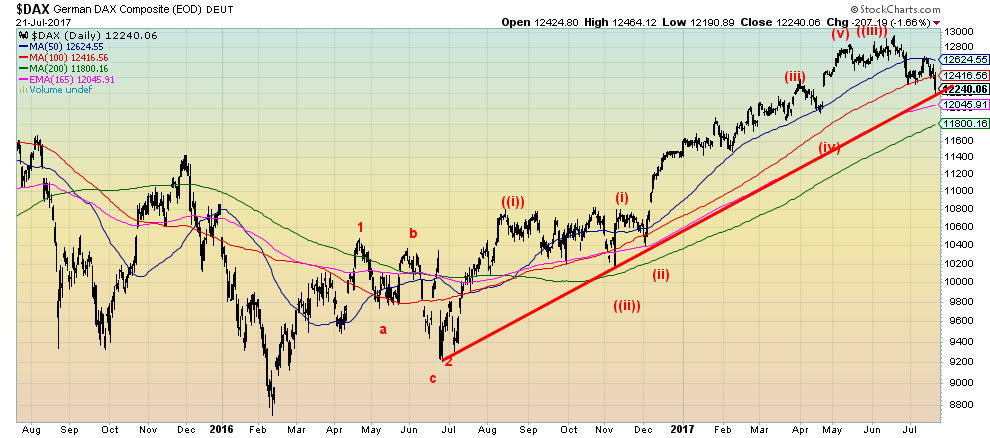
The European indices may already be in the process of wave ((iv)). The German DAX topped out in June and since then has started what appears to be a descent. Currently, the DAX is testing the uptrend line from the Brexit panic low in June 2016. It also appears to have seen three waves to the upside since that low. A breakdown under 12,240 should signal the start of a steeper correction to test at least the 200 day MA currently near 11,800. A decline to 11,500/11,600 would also not be surprising or abnormal. But, like the US markets, after this correction is over the DAX could rise to new all-time highs once again.
(Source)
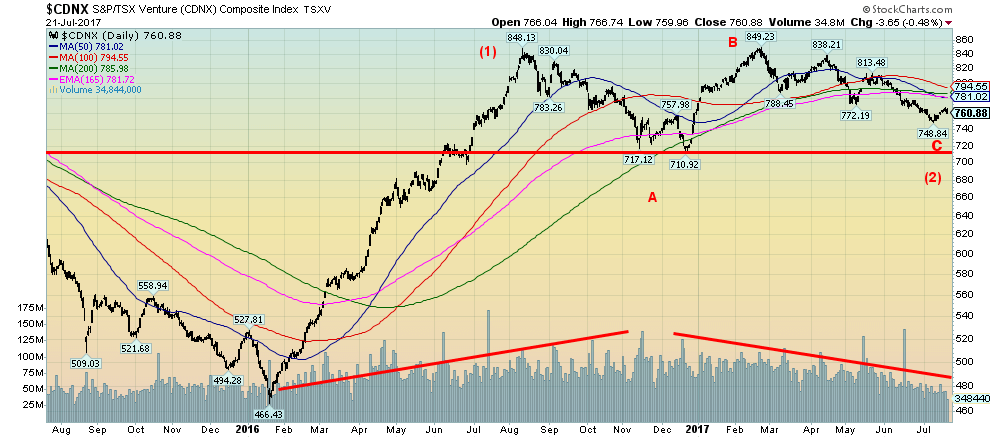
We are optimistic that the TSX Venture Exchange (CDNX) is nearing the end of what has been a year-long corrective pattern. Back in January 2016 the CDNX made what was really an all-time low at 466 surpassing any low that had ever been seen in the index since it came into existence back in the late 1990s following the merger of the old Vancouver Stock Exchange (VSE), the Alberta Stock Exchange (ASE), and the Montreal Stock Exchange (MSE). The junior exchange is dominated by mining stocks but also contains a large number of junior energy stocks, high tech stocks, biotech stocks and many more that are in the start-up phase. The CDNX enjoyed increasing volume during the rise that effectively doubled the index until the top in August 2016 but since then volume has contracted and interest has waned. This could soon be ending as the wave count suggests that once this long corrective phase is over another huge run-up could get underway. Wave one (1) up was 382 points and wave three (3) up could easily be anywhere from 600 points to 800 points higher. Hard to believe that this index hit a peak of 3,372 back in 2007 and even at the secondary top in 2011 it hit 2,465. The potential for the big up scenario remains in force as long as the CDNX stays above 710. The CDNX needs to regain above 800 to suggest higher prices.
(Source)
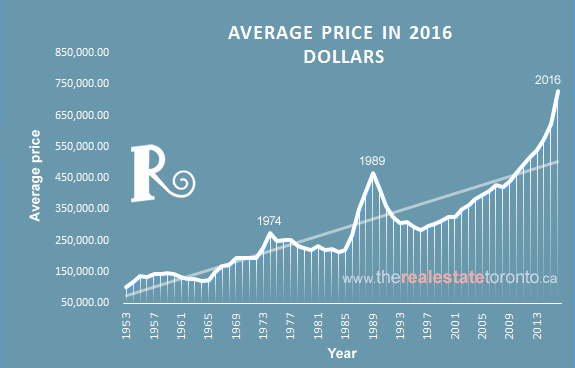
This is a chart of average housing prices from the 1950s in the City of Toronto. Notice peaks in 1974 and 1989 followed by significant corrections. We focus on that mean line and can’t help but notice that current prices have spiked well above the mean line. Every time that happened (1974 and 1989) a sharp correction followed that included a number years where prices performed below the mean. We can’t help but notice that prices peaked in early spring and since then sales have slipped as have prices. The overdue correction could be underway. Canadians consumer debt in relation to income is as high as it has ever been. Trouble in the real estate market could translate into rising delinquent loans and even bankruptcies especially if a recession hit. A recession is overdue and the talk from the Bank of Canada (BofC) is hiking interest rates following in the path of the Fed. Rising housing prices have been prevalent in the western economies and even in the Asian economies. A correction is overdue and it could be steeper than most people are expecting. With rising housing prices, it is not surprising that the mantra is the same as it was in 1974 and 1989, that housing prices go up forever.
(Source)
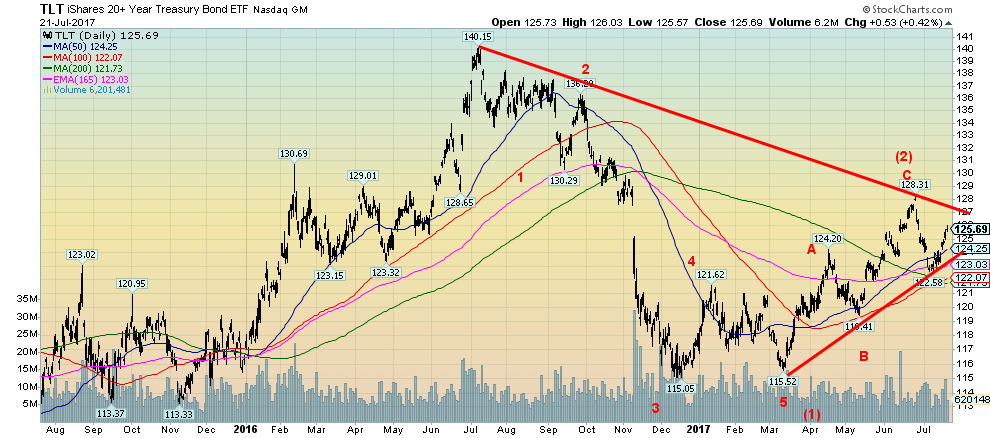
US bond prices fell sharply from the highs of July 2016 to the lows that were seen in late 2016 and the double bottom of March 2017. The target on the double bottom suggested a move to at least 128. The high of 128.31 seen in late June 2017 may have satisfied the target. We have now completed what might be one wave to the downside and for the past couple of weeks or so we have been making a corrective up move. As long as the high of 128.31 holds and the bonds as represented by the iShares 20+ year Treasury Bond ETF (TLT) should resume its downtrend. Support is seen just above 123. A break under that level and especially under 122 should start the next move to the downside. (Prices move inverse to yields so as prices fall, yields rise.)
(Source)
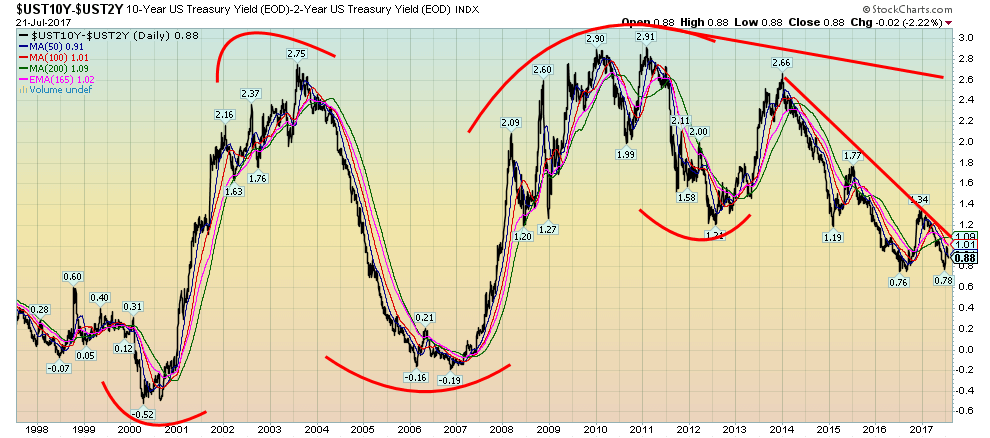
Spread watch. The 2 year-ten year spread narrowed slightly this past week to 0.88 down from 0.98 the previous week. The most recent lows were seen at 0.76 and 0.78. A breakdown under that level could suggest a move for the spread to fall to 0.18. That would be interesting and put us considerably closer to a negative spread. We have noted and will continue to note that when the spread turned negative in 2000 and again in 2007 it presaged the coming collapse and recession. We will monitor the spread closely going forward.
(Source)
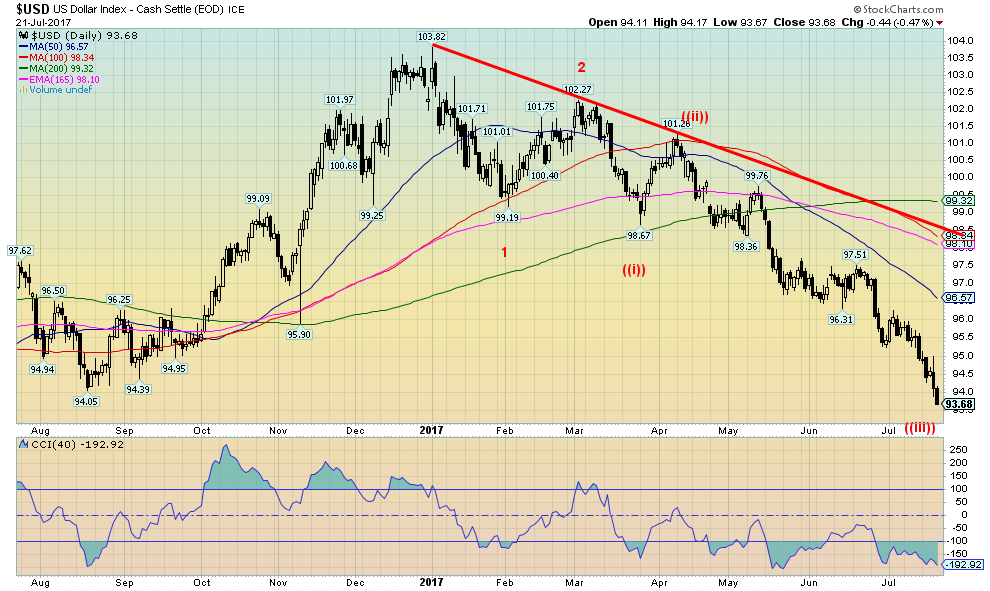
Down, down, down. The US$ Index keeps falling this past week to new 52-week lows. Last week we noted that US$ had the potential to fall to the 94 zone. Sure enough, not only did it fall to 94 it went through making a low of 93.68 where it closed. The other side of this down move saw the Euro and the Cdn$ rise to new 52-week highs. The US$ Index has been in a downswing since early 2017. Just as the US$ Index is called for a bottom it moves even lower. The US$ Index rose on a wave of enthusiasm for the election of Trump and his potential business friendly agenda. Trouble is the Trump agenda has thus far been all smoke and mirrors and there has been no major piece of legislation passed since he took power in January 2017. With the Russian investigation getting deeper and the absolute failure of the Republicans to repeal and replace or just outright repeal Obamacare, confidence is fading. It seems irrelevant that the Fed has been hiking rates but its talk that it may be about done has helped push the US$ Index lower. It also seems irrelevant that US$ bulls are down to about 8% levels that would normally suggest a potential low followed by a rise in the value of the US$ Index. The index may be overdue for at least a correction. We believe the move since April has been a wave ((III)) to the downside. To come would be a wave ((IV) and wave ((V)). With the break of the most recent target of 94 we believe the next move to the downside could take it to 91. Any rebound should remain under 96 although in a strong rebound we could get back to 98, but we doubt it.
(Source)
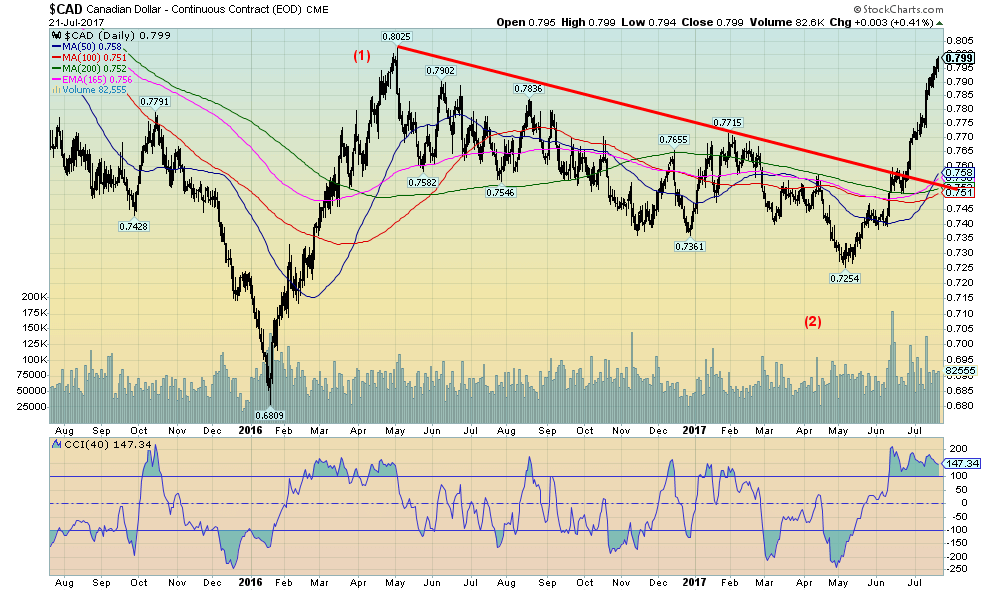
The Cdn$ soared to new 52-week highs this past week. It marks the best price for the Cdn$ vs. the US$ since May 2016 when it hit 80.25. We believe the current target could see the Cdn$ move to at least 83. Ultimately the Cdn$ could move as high as 88. That is a long way from the 68 that was seen in January 2016. The Cdn$ has a history of wide swings against the US$ both up and down. Everyone probably forgets that the Cdn$ was at almost 106 back in 2011. Could the Cdn$ be headed back there? A strong Cdn$ is welcomed by cross-border shoppers and snowbirds. It is hated by exporters. But the current up move, on strong volume, suggests to us that odds favor a higher Cdn$ vs. a Cdn$ that is going to fall back to the lows of early 2016. A strong Cdn$ is a vote of confidence in the Cdn economy as well.
(Source)
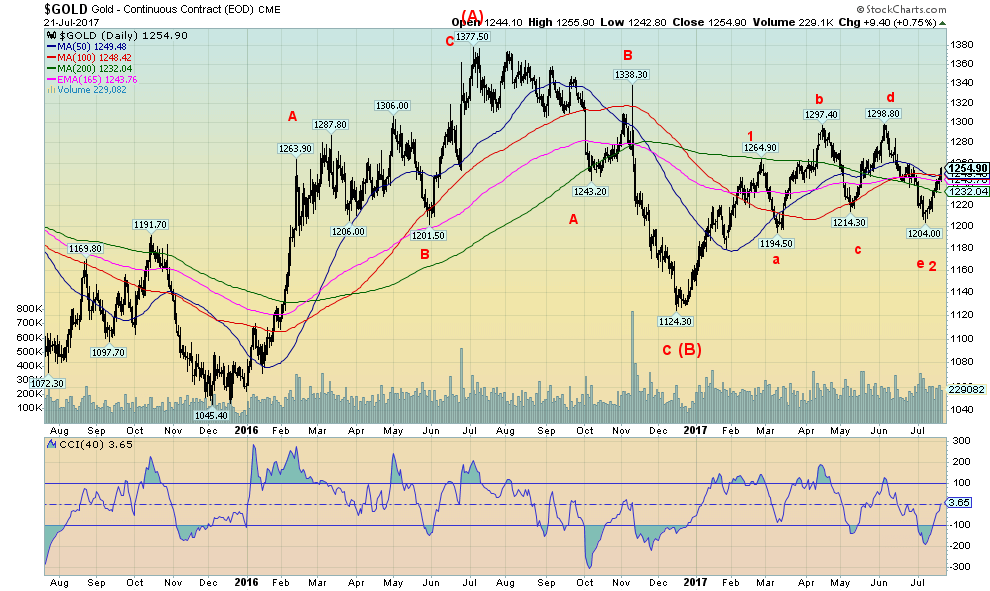
Gold prices jumped about $28 or 2.2% this week, putting in their best week since April. In closing at $1,255 gold closed over the 50, 100 and 200 day MA and the 165-day EMA. We would like to see a close over $1,260 to feel more comfortable. But the close this week was encouraging and is going some ways to confirm that a low may be in at $1,204. Gold has traced out a five-wave rally from the $1,204 low suggesting that this is an impulse wave to the upside. Over $1,260, we believe a move to $1,300 should get underway. Above $1,300, a move to challenge the July 2016 high at $1,377 should unfold. Seasonals are turning up that could take us into a top in late September or early October. The US$ is cooperating by falling. And in the background, a political crisis is unfolding. Gold, after all, is a hedge against government and if the political crisis deepens, which is showing every sign that it will, the gold prices could be in for a very sharp up move in the remainder of 2017. Some are calling for $1,400 and even $1,500 this year. Both are possible if the political crisis deepens. And the rise in gold might be accompanied by a drop in the stock market. Support should now rest at $1,230 and we would not want to see a return under that level. But we are encouraged by the action and believe we are in the early throes of a significant up wave.
(Source)
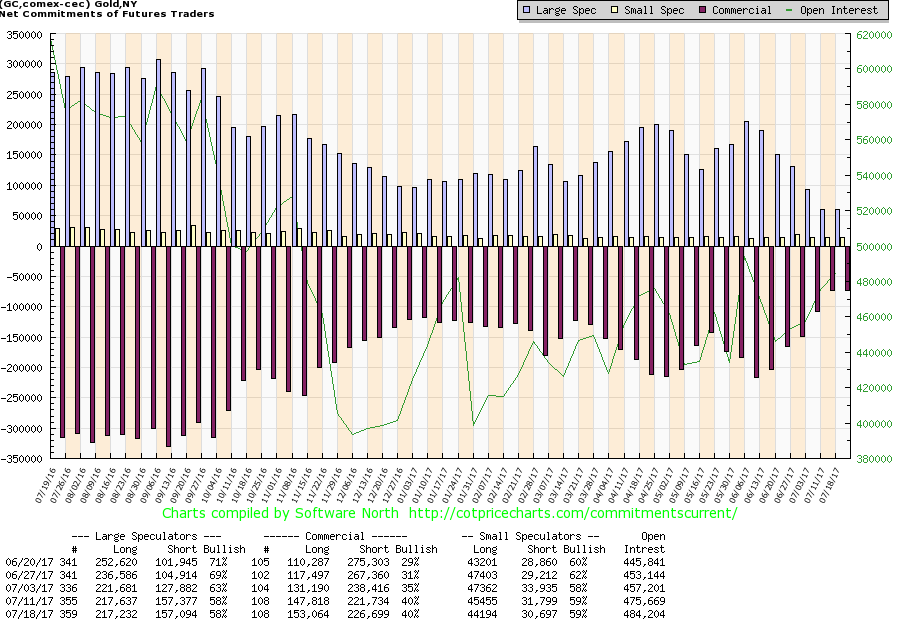
The gold commercial COT held steady this past week despite a rise of about 5,000 contracts in short open interest. It was offset by a rise of just over 5,000 contracts for long open interest. That helped to keep the commercial COT at 40%. The large speculators COT (hedge funds, managed futures, etc.) also held steady at 58% with little movement in either long or short open interest. The commercial COT continues to be the best we have seen in a number of months. That should bode positively for gold prices going forward.
(Source)
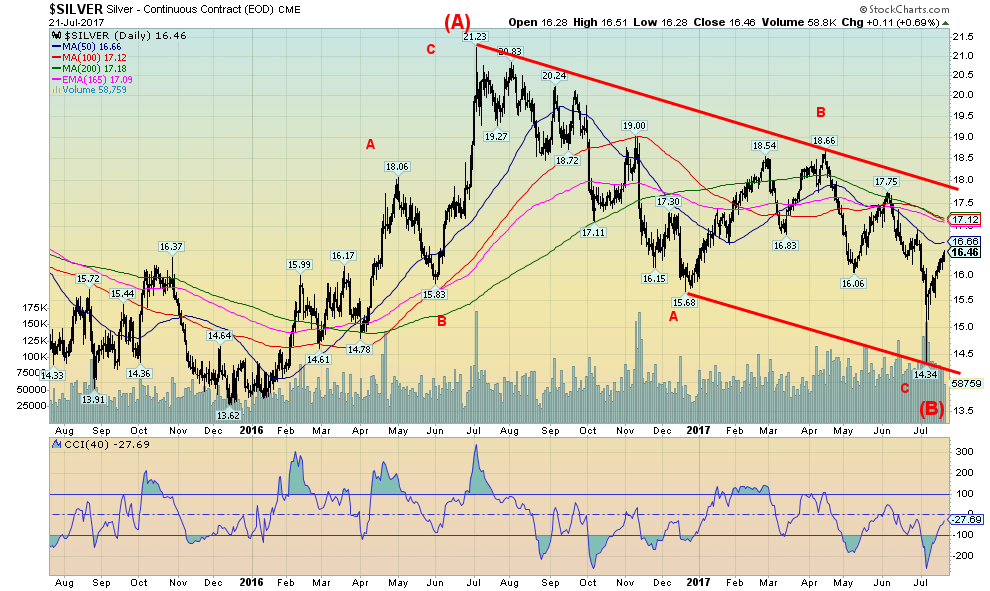
Silver prices continue to rise from the spike low of $14.34 seen on July 7, 2017. That day saw an impressive reversal following what may have been an erroneous “seller” or as they term it “a fat finger.” That day silver closed over $1 above the low or almost 8%. Despite the 3.3% gain for silver this past week, silver has not as yet cleared the hurdles to suggest that a low can be confirmed. We will feel more comfortable once gold has cleared above $17. A move over $18 could suggest that silver could be on its way back to the highs of July 2016 at $21.23. Silver has now been up for six consecutive days although volume has not been overly impressive. The heavy volume occurred to the downside on what may have been the C wave of a large ABC correction that got underway following the July 2016 top. Silver is just below a 50-day MA at $16.66 and just below a trend line connecting lows in May and June. The 100-day, 200-day MA’s and the 165-day EMA all converge around $17.10 to $17.20. This is the hurdle we need to break out over to confirm a low. $16 should now be support and preference is we hold above that level.
(Source)
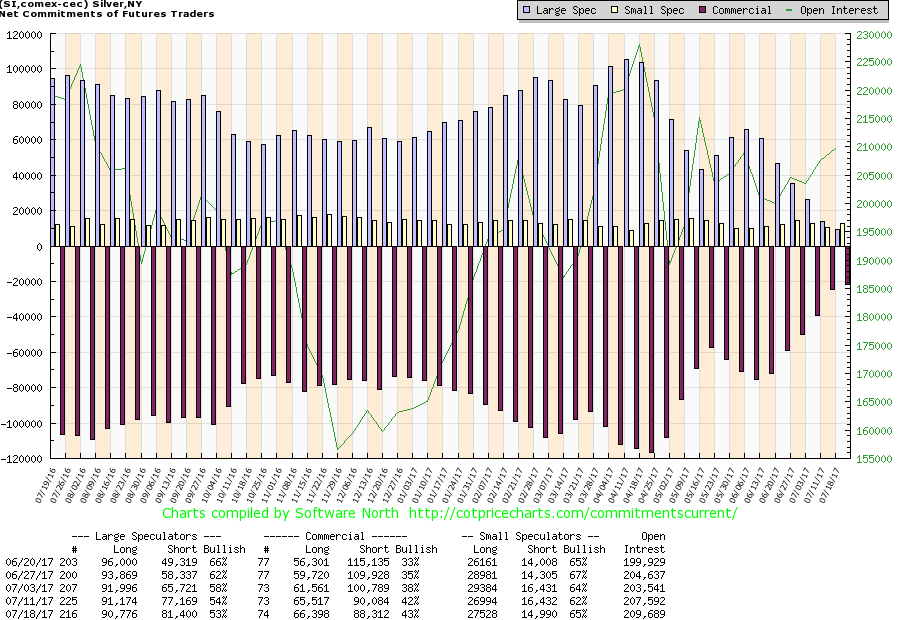
As with the gold commercial COT, the silver commercial COT improved slightly this past week to 43% from 42%. Short open interest fell roughly 2,000 contracts while long open interest rose about 1,000 contracts. The large speculators COT continued its decline falling to 53% from 54%. Nonetheless, the long open interest has remained historically high currently at just over 90,000 contracts. This is encouraging as typically it falls sharply in sell-offs. The fact that it is holding high suggests that the large speculators such as hedge funds and managed futures are looking long term that silver prices should rise. The decline this past week in the COT was a roughly 4,000-contract rise in short open interest.
(Source)
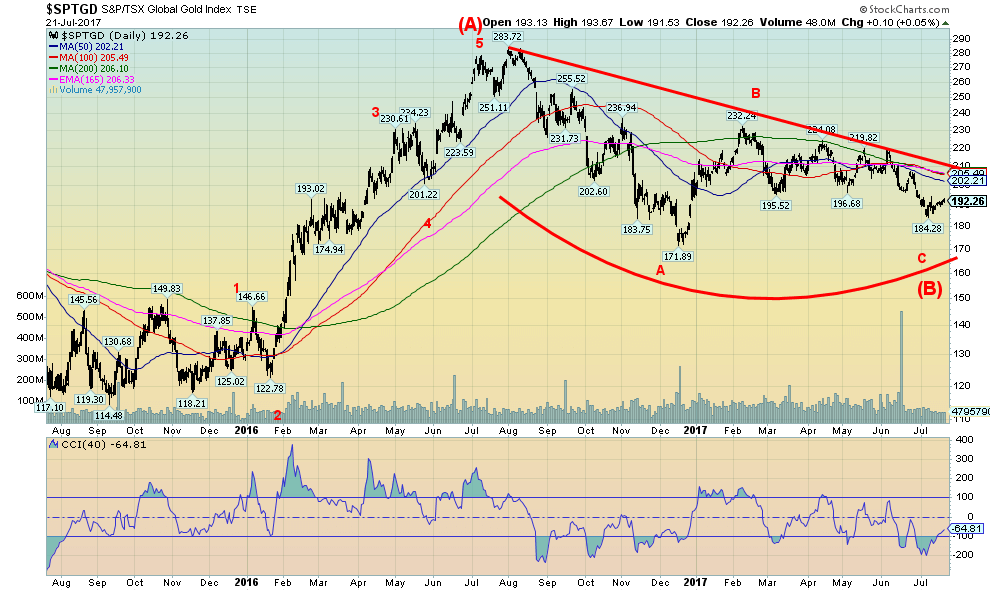
Frustration, thy name is gold stocks. Yes, the Gold Bugs Index (HUI) jumped 3.2% this past week and the TSX Gold Index (TGD) was up 2.1%, but the gains were rather muted against the backdrop of a 2.2% jump in gold prices and a 3.3% gain for silver. It has not been unusual for the gold stocks to triple percentage-wise the gains for gold and silver in a week. Of course, that works the opposite way as well in down markets. The best that can be said for the gold stocks is that the December 2016 low at 172 is holding. The most recent low was 184. That may be an awkward double bottom, or, it might signal the end of the C wave of the ABC correction that got underway from the top in August 2016. Either way, we still have a ways to go to confirm a low. The breakout level appears to be around 205/210 for the TGD. Above 210 and especially above 220 odds favor a stronger move with potential targets up to 320. Naturally, it is important that the recent low at 184 holds and especially the December 2016 low at 172.
(Source)
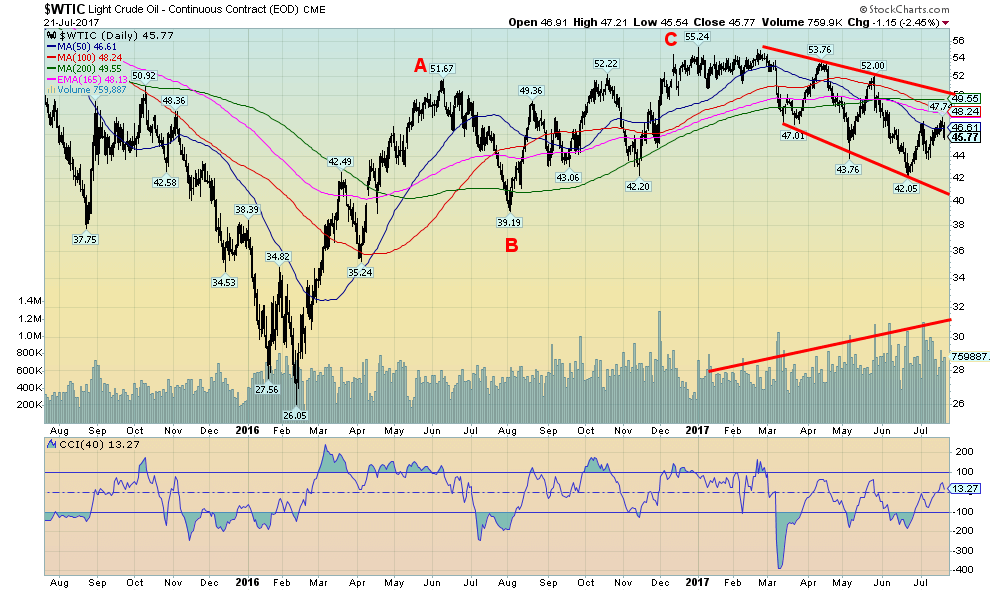
One of the things that struck us with oil prices is the jump in volume that occurred as oil prices began to fall once again in 2017. This suggests to us that we could be in the throes of another sharp down wave that may even return to test the lows of 2016 near $26. After seeming to start rallying again following the release of a somewhat bullish drawdown, oil prices fell sharply on Friday when it was learned that OPEC is going to keep up the pressure on oil prices by not cutting production. Oil prices fell $1.15 on Friday. The bottom of the current channel is near $40 and that appears to us to be a likely near-term target. The decline thus far is quite volatile with sharp ups and downs. The expectation is that the volatility could continue. The heavy volume has occurred on down waves. Lower volume on up waves. That tells us the trend is to the downside.
(Source)
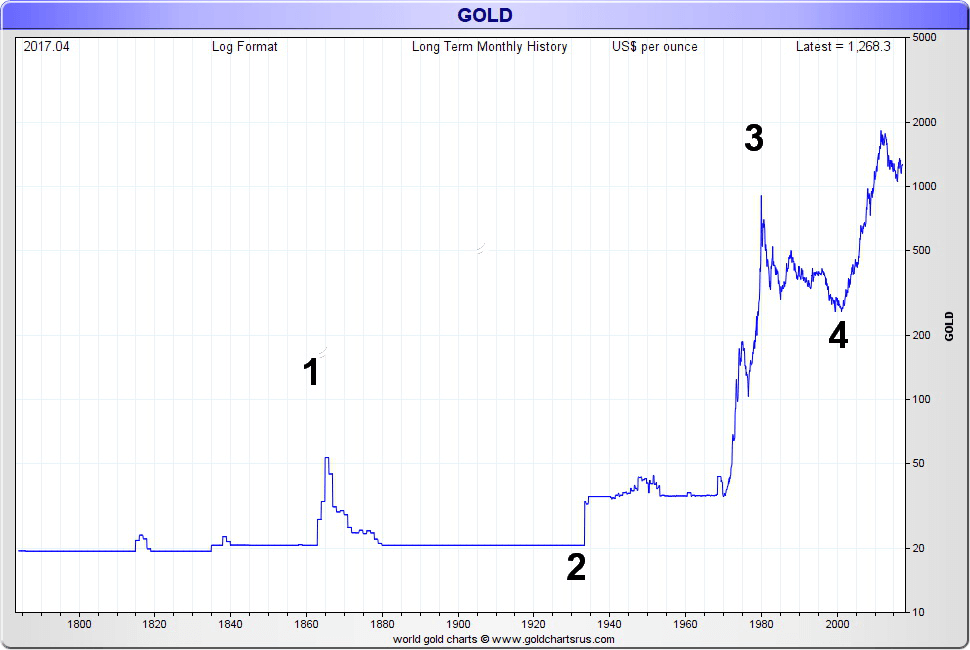
Bonus Chart! Above is a really long-term chart of gold prices dating from the late 1700s. We were struck by what appears to be Elliot waves even in a very long-term chart. Okay, we are doing our best here. Wave 1 appears to end in the 1860’s at the height of the US civil war and its aftermath. The government, to pay for the war, issued what was known as “greenbacks,” paper money not redeemable in gold. It took gold out of circulation and there was essentially a flight to quality buying gold and the price rose sharply. After the war, President Grant wanted to return the economy to pre-war monetary standards and US bonds would be repayable in gold or its equivalent. But a group of speculators led by two guys named James Fisk and Jay Gould came into the market trying to corner it. In September 1869 President Grant put an end to it breaking the gold ring by releasing gold to buy US bonds and prices crashed. Eventually, gold was set at $20.67 where it effectively remained until the 1930s when President Roosevelt devalued the US$ by hiking the price of gold to $35 and taking it out circulation through confiscation. That ended wave 2 (a down wave).
Wave 3 peaked in 1980 with the oil and inflation crisis of the 1970s until Fed Chair Paul Volcker hiked interest rates to over 20% crashing the gold price. Gold was on a downward trajectory for the next 20+ years bottoming in 2001. The current up wave should unfold in 5 waves (as did wave 3). The correction that started in 2011 and bottomed in 2015 (thus far) appears to us as wave 2. We should now be in the early throes of wave 3 to the upside.
GLOSSARY
Trends
Daily – Short-term trend (For swing traders)
Weekly – Intermediate-term trend (For long-term trend followers)
Monthly – Long-term secular trend (For long-term trend followers)
Up – The trend is up.
Down – The trend is down
Neutral – Indicators are mostly neutral. A trend change might be in the offing.
Weak – The trend is still up or down but it is weakening. It is also a sign that the trend might change.
Topping – Indicators are suggesting that while the trend remains up there are considerable signs that suggest that the market is topping.
Bottoming – Indicators are suggesting that while the trend is down there are considerable signs that suggest that the market is bottoming.
—
DISCLAIMER: This article expresses my own ideas and opinions. Any information I have shared are from sources that I believe to be reliable and accurate. I did not receive any financial compensation in writing this post, nor do I own any shares in any company I’ve mentioned. I encourage any reader to do their own diligent research first before making any investment decisions.


Sustainable Restoration of the Haus Hövener Garden in Brilon
The Brilon Construction Workers Association is restoring the Haus Hövener garden into a cultural community space, funded through a €10,000...


Temenos to Acquire Additiv to Boost AI Wealth Management
Temenos is acquiring Zurich fintech Additiv to strengthen its digital wealth management and expand AI-driven financial orchestration. Additiv’s platform connects...


EFPIA Warns Limited SPC Reform Could Weaken EU Pharma Competitiveness
EFPIA supports the EU Biotechnology Law and a 12-month SPC extension but warns the current proposal is too limited. A...


EU Approves €23B Italian Renewable Energy Plan to Boost Climate Goals
The European Commission approved Italy’s €23 billion aid scheme to boost renewable energy and meet 2030 climate goals. Supporting wind,...


Institutional Bitcoin Buying and LiquidChain Presale Signal Market Optimism
Institutional Bitcoin buying, like Strategy’s 1,550 BTC purchase, signals confidence, stabilizes prices, and may trigger bullish momentum. Meanwhile, infrastructure projects...
 |
|
 |  |
 |
|
-

 Crypto2 weeks ago
Crypto Market Mixed as Bitcoin and Ethereum Slip Amid Rising Volatility
-

 Biotech3 days ago
TG Therapeutics Advances Subcutaneous Briumvi With Strong Trial Results and Rising Sales Momentum
-

 Crypto1 week ago
Altcoins Show Mixed Performance as Bitcoin Weakens
-
 Fintech21 hours ago
Temenos to Acquire Additiv to Boost AI Wealth Management
You must be logged in to post a comment Login