Featured
Tracking gold and silver in the coming bear market
What a difference a week can make. These past few weeks I’ve been complaining about the Dow Jones inability to do something to the up or downside.

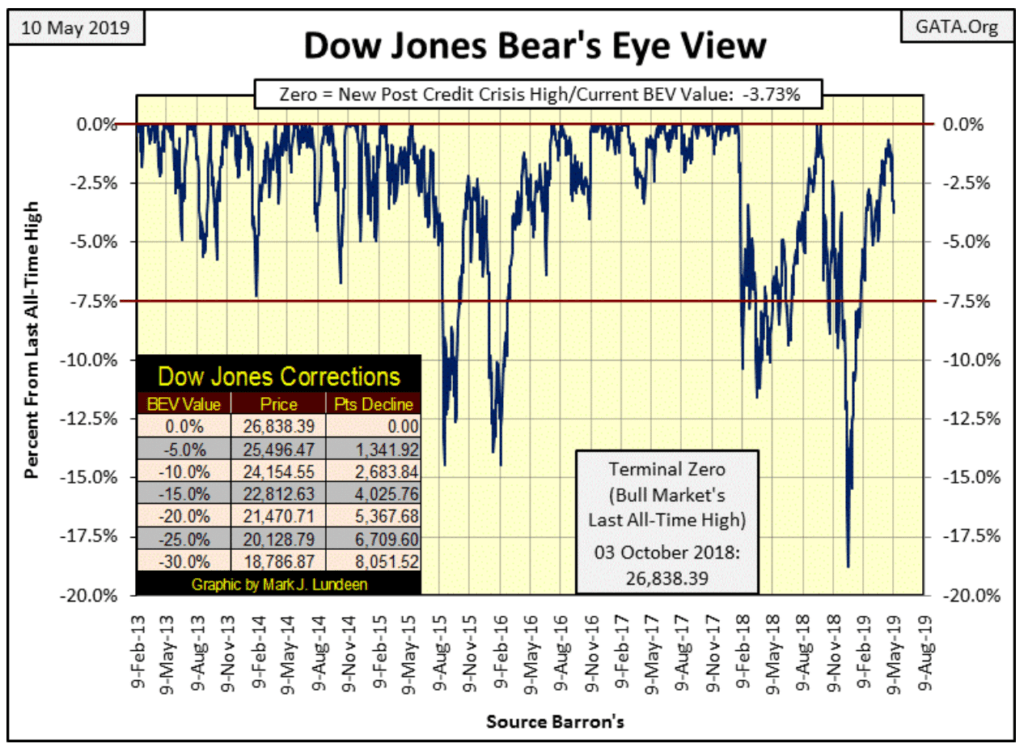
This week the Dow decided to do something; like going down 563 points (-2.12 percent) from last Friday’s close. The net effect of this week’s market decline is easily seen in the Dow Jones Bear’s Eye View (BEV) chart below.
So, is this the beginning of the resumption of the 2007-09 bear market? Well if, and the operative word is IF this decline continues it could very well be.
©Mark Lundeen
I can’t say a market event on the scale of the Great Depression crash is at hand, but my reason for tying the future bear market with that of the 2007-09 sub-prime mortgage bear market is as follows. In the later stages in a big bull market:
-
-
Market valuations inflate to extreme levels.
-
Banks make loans, and corporations take on debt for reasons they will ultimately regret.
-
In the following bear market, Mr. Bear deflates market valuations by an appropriate percentage as he forces banks, corporations, and everyone else to clean up their balance sheets by shedding debt. A new focus is created in the minds of people. Where before people were thinking of what benefits could be had by increasing their debt loading, which stimulates economic activities, the new focus is on cutting current consumption to pay off past debts, which dampens economic activities. Orders for goods and services decline along with employment opportunities, and the bigger the previous boom, the bigger the following bust.
During historic bear markets, like the Great Depression’s, many companies don’t survive the deleveraging process; individuals may lose all their worldly wealth and become homeless.
That’s what troubles me so much about the 2007-09 Credit-Crisis Bear Market. Though the Dow Jones did see its second largest percentage decline since 1885, Mr. Bear failed to deleverage the financial system. Many companies that should have gone under, like most of the big Wall Street financial houses, are still with us. The financial system and general population learning nothing from the experience, are once again using credit and debt recklessly.
Under the theory of what can’t go on won’t go on, my big view of the markets is that in the coming bear market, Mr. Bear isn’t going to be deflected from his purpose in life: cleaning up over-leveraged balance sheets. From 2002-07 when the subprime mortgage market was inflated with the reckless expansion of credit, it created the potential for another Great Depression Crash all by itself, a crash that was thwarted by Washington and Wall Street with the reckless expansion of even more credit and debt.
I doubt that trick will work next time Mr. Bear comes calling on Wall Street.
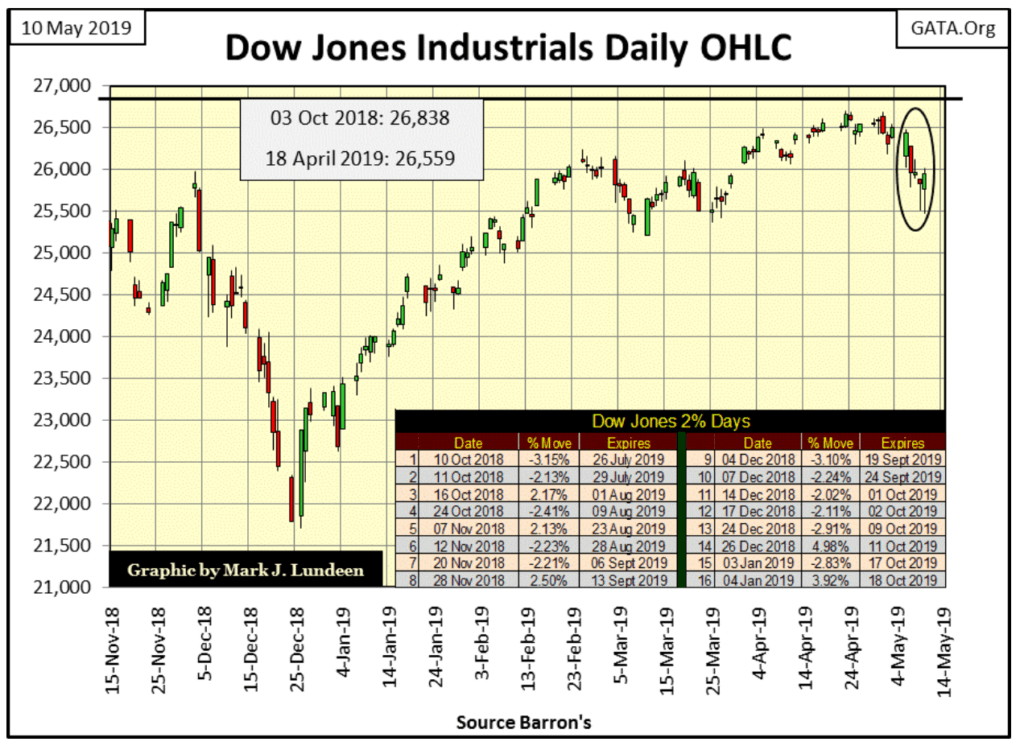
We aren’t there just yet. Still, in the Dow Jones daily bar chart below, it’s obvious this past week is one the stock market hasn’t seen since last winter. Fortunately, we didn’t get a Dow Jones’ day of extreme volatility, a Dow Jones’ 2 percent move from one day’s closing price to the next.
©Mark Lundeen
I placed a table at the bottom of the chart listing the sixteen 2 percent days currently in the Dow Jones 200 count with their expiration dates. The first 2 percent day in the 200 count occurred on October 10th of last year and will expire on July 26. Note: the days in the count are only trading days. Weekends and holidays are not included in the 200-day sample. So, failing any additional days of extreme volatility in the coming months, the Dow Jones’ 200 count below (Red Plot below) will begin declining in late July.
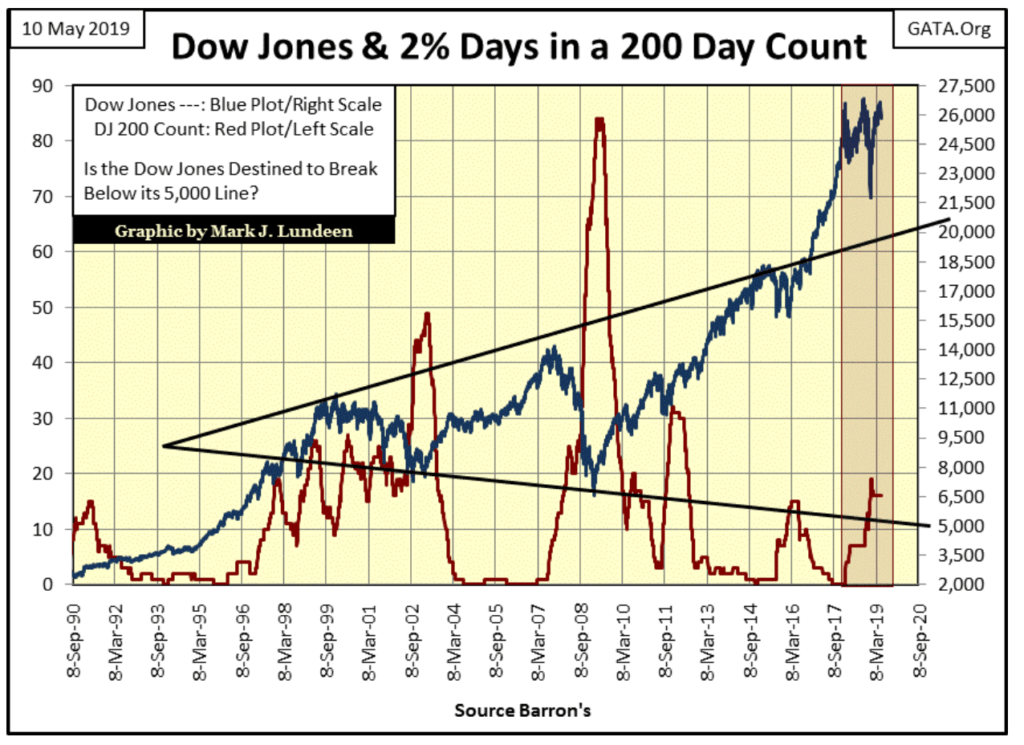
Currently, the 200 count stands at 16, and all of those extreme days occurred from early October to January when the Dow Jones saw its 18 percent correction. During the high-tech bear market, the Dow Jones’ 200 count increased to 49 and spiked to 83 during the subprime mortgage bear market. Do you remember how painful that was?
In the summer of 1932, at the bottom of the Great Depression Crash, the 200 count peaked at 103. In other words, in the final liquidation phase of the Great Depression Crash, the Dow Jones experienced daily moves of 2 percent or more, from one day to the next, every other day during a 200 day period. People who lived through the experience never forgot it. It wasn’t until the 1970s when the baby boomers came of age before the public began returning to the stock market in any significant numbers.
©Mark Lundeen
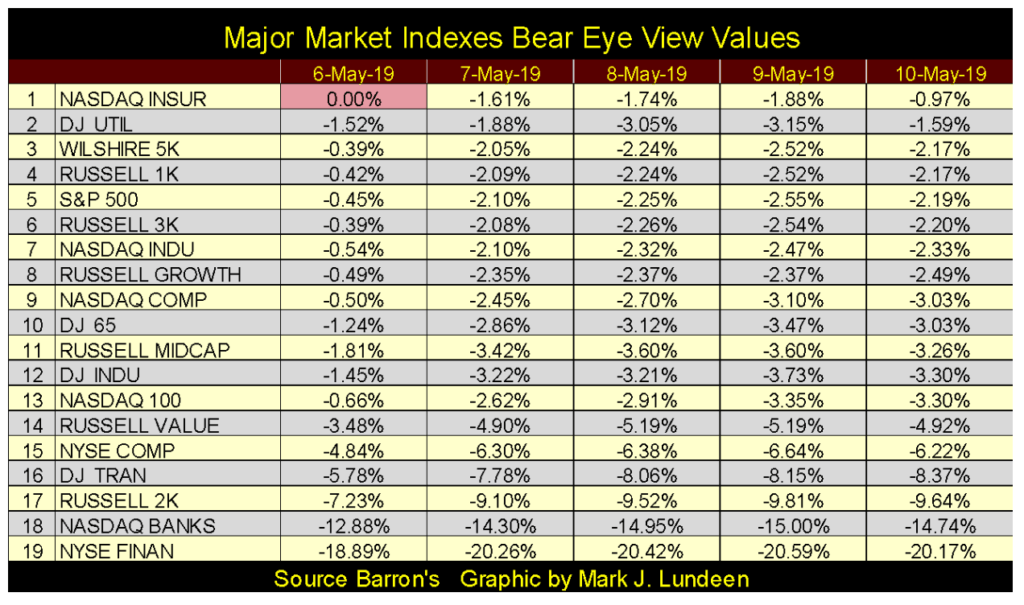
Here is my table for the Major Markets daily BEV values, data sorted on Friday, May 10th. Only one new all-time high and that was on Monday. Looking at the data as of Friday, fourteen of these indexes remain within 5 percent of their last all-time highs, which includes the Dow Jones (#12).
©Mark Lundeen
As I see it the stock market was taking a bit of a breather last week. Yes, the market was spooked by the apparent break down in the trade talks between China and the United States. A trade war wouldn’t be good for the market, but I wouldn’t be shocked should we see more BEV Zeros in the table above before June rolls around.
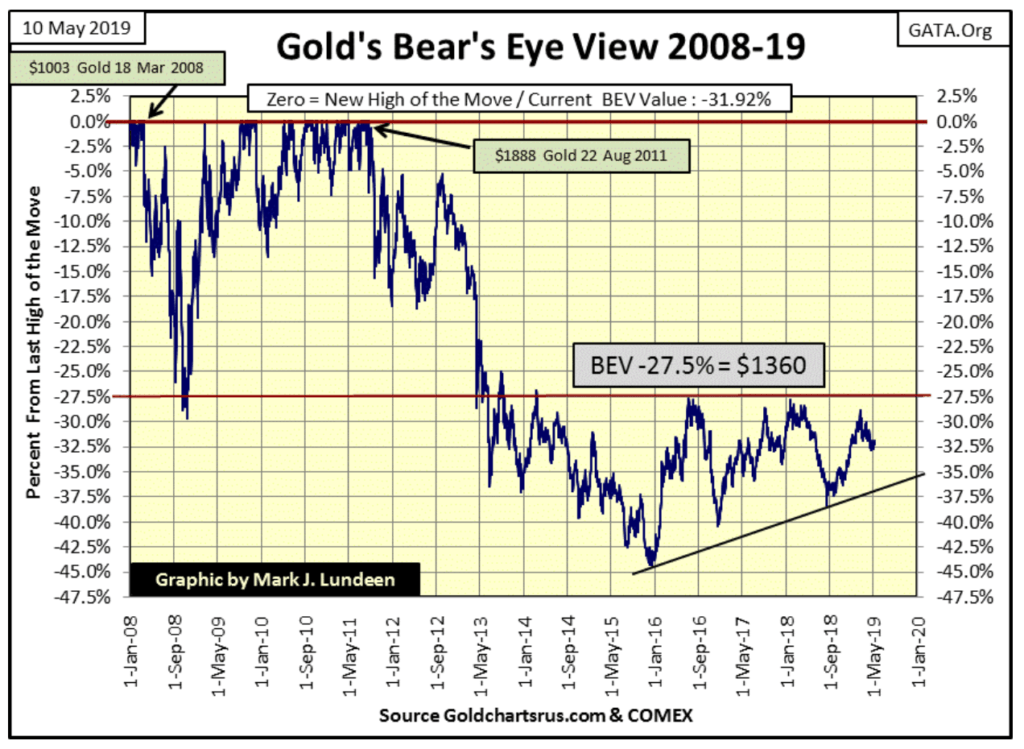
Gold was up about seven bucks this week. I know, nothing exciting, but gold in its BEV chart below remains “attractive” and that counts for something in my way of thinking. What the old monetary metals, those metals that used to circulate as money need is something the Dow Jones saw this week; an increase in daily volatility.
Periods of market volatility in the stock market are always bearish, and sometimes can be for gold and silver, as was the case during the first few years of the 1980 to 2001 bear market. But bull markets in precious metals are also volatile market events, as gold and silver prices are being inflated by flight capital fleeing deflation in the financial markets.
©Mark Lundeen
The current calm seen above in the price of gold is telling us things on Wall Street are under control. But should the Dow Jones continue deflating as it has this week, and should bond yields and interest rates begin to rise, the daily advances seen in gold and silver could become shocking. Our time is coming; it’s just not here yet. In May 2019 patience is a virtue for us gold bulls.
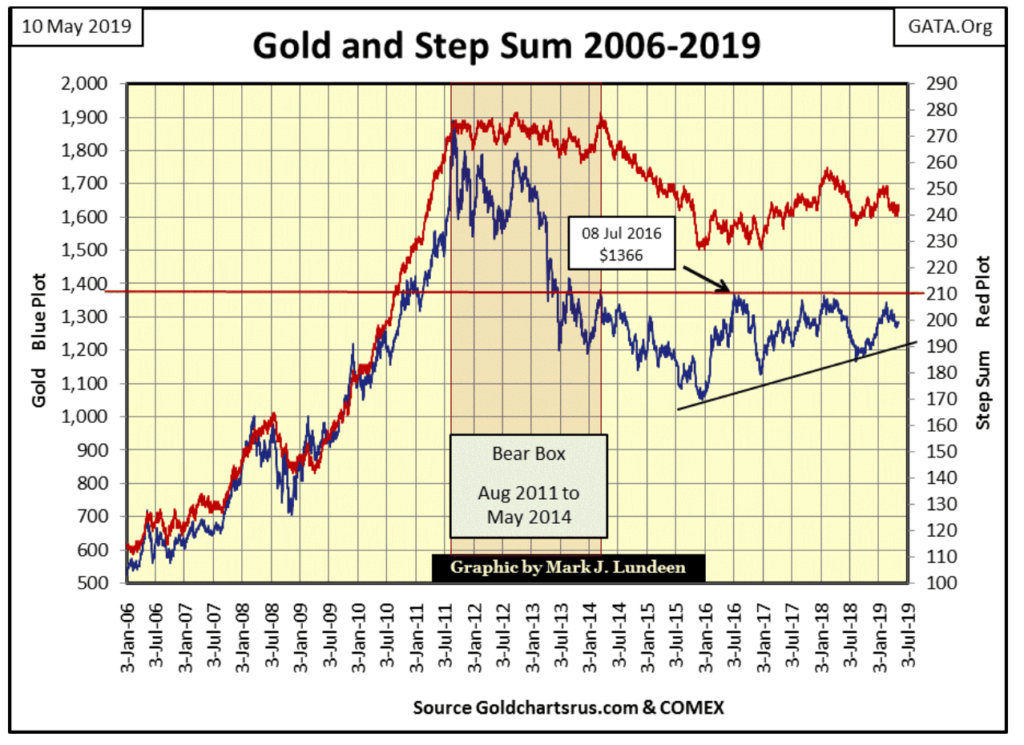
And what will gold and its step sum look like when the bull market is resumed? All we need to do is look at what these plots did from 2006 to 2011 in the chart below. It’s been eight years since gold and its step sum enjoyed a prolonged period of steady advancements. Eight years is a long time.
There are plenty of reasons for the prices of gold and silver to resume their advances toward new all-time highs. When these reasons become factors the financial markets must once again struggle with, we’ll see the old monetary metals resume their now long-stalled advances.
©Mark Lundeen
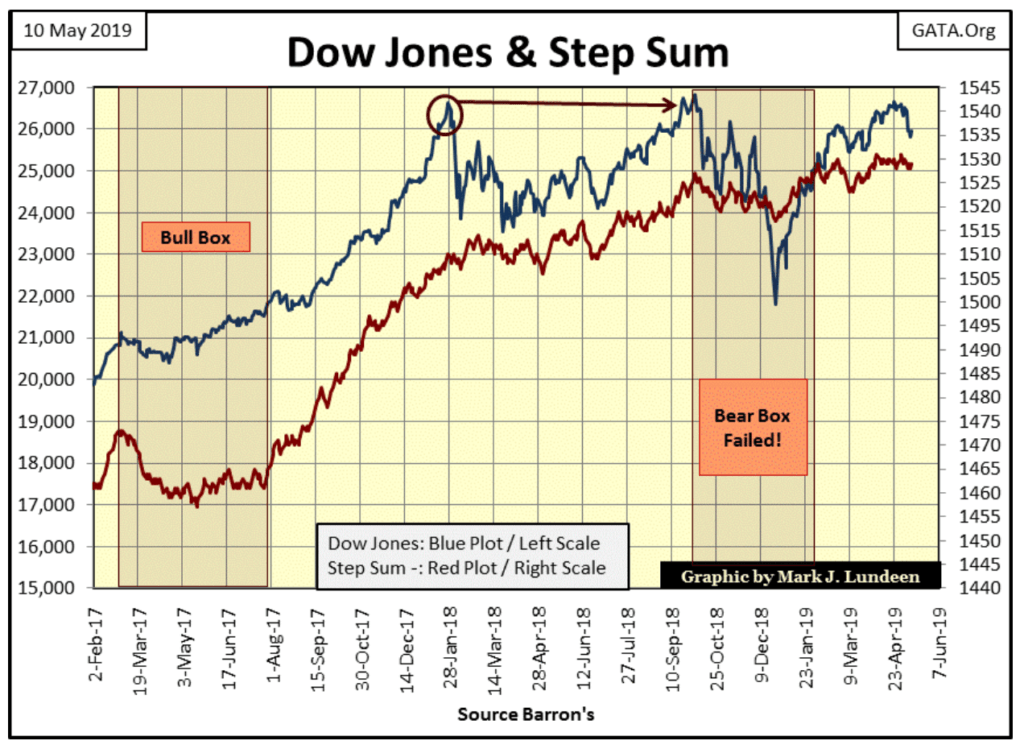
In the Dow Jones step sum chart below, this week the Dow Jones took a significant decline with little reaction from its step sum.
©Mark Lundeen
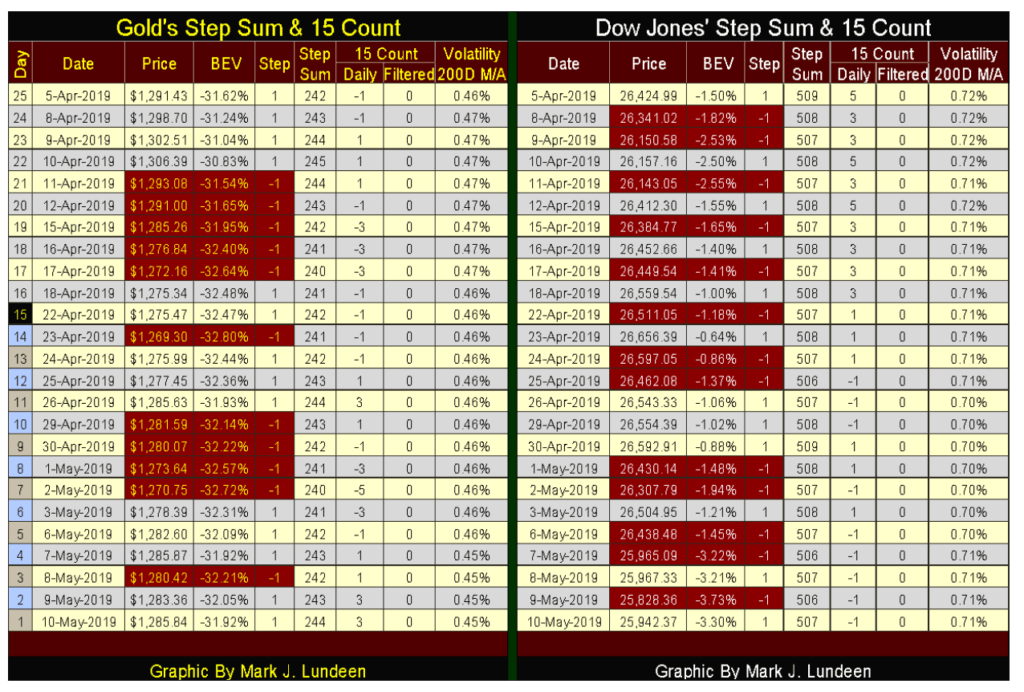
The reason for that can be seen in the Dow Jones step sum table below; of the five trading days for the week, two of them saw the Dow Jones advance from the previous day’s close leaving the step sum on Friday where it was on Monday; 507 but down one from last Friday’s 508.
©Mark Lundeen
Something big could come from this; the beginnings of a historic bear box. But nothing should be concluded based on only one week’s market action. Should the Dow Jones continue declining for the next eight weeks as its step sum refuses to follow it down, then we’ll have something.
Gold in its step sum table is looking up. Only one declining day in the past six; but as noted before with the current low volatility now dominating the precious metals market, those five advancing days only advanced the price of gold by about seven bucks.
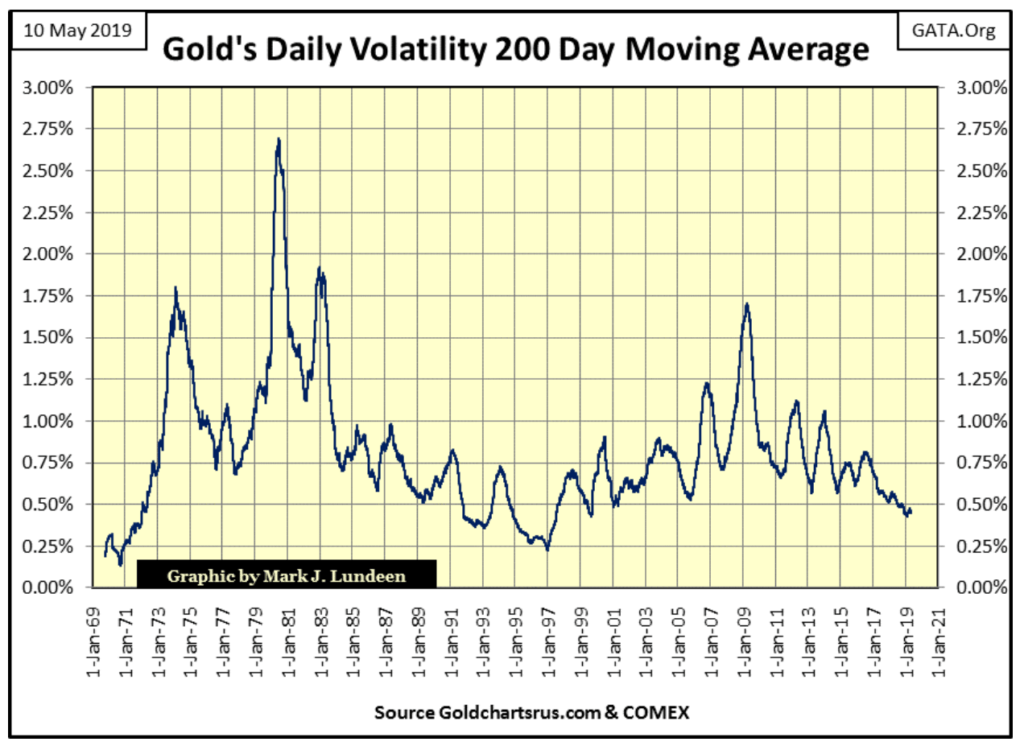
The problem can be seen in the chart below plotting gold’s daily volatility’s 200-day moving average; daily volatility has declined to levels seen at the end of the 1980 to 2001 bear market.
Look at the spikes in volatility in 1973 & 1979, those were good years for gold and silver! The spike in 1983 occurred in a price rally during the bear market. Since 2001, when the price of gold began rising from its 1980-2001 bear-market bottom, daily volatility in the price of gold had greatly attenuated from what it was from 1969–83.
Let’s face it central banks don’t care for the competition gold in a free market would give to their fiat currencies. So, what we are seeing below is one of the effects of their continual manipulation in the precious metals market – constrained daily volatility.
“Central banks stand ready to lease gold in increasing quantities should the price rise.” Alan Greenspan: Congressional Testimony 1998
When the “policy makers” lose their grip in the markets, expect big things, historic daily volatility in the old monetary metals.
©Mark Lundeen
I get feedback on my positive coverage of the mining sector. Some of my followers don’t like miners for understandable reasons. Specifically; why during a crisis-in-credit should gold and silver mining prosper as everything else struggles for survival? With the understanding that I don’t have a crystal ball to see the future with, that’s a good question I have a good answer to.
Currently, everything else trading in the financial markets has been soaking up the “liquidity” flowing from the Federal Reserve System. Stocks, bonds, real estates are all over dangerously overvalued, and the companies managing these financial assets are leveraged as if the good times will never end.
But taking another look at the BEV chart for the BGMI I published last week (Below), gold mining is currently near its lows of the past 100 years! The only people owning gold mining companies today are true believers; people who most likely purchased them after the 85 percent decline from 2011 to 2015.
The prospects of seeing gold mining shares declining with everything else in a coming bear market are slim to none in my opinion; they already had their bear market as valuations in everything else inflated. The survivors in the precious -metal mining industry who have survived this bear market are lean and mean!
Also, I don’t believe finding funding for their future operations in the coming bear market will be difficult. The banking system is going to have massive problems with loan defaults in the years to come, but that is just half of their problem. They are also going to have difficulty finding new clients for loans within the economy who have above average chances of actually servicing these new loans to term.
Within the context of a bull market in gold and silver, gold and silver mining is going to be one of those areas of the economy that will be eager to take on new loans to expand their operations as everything else is shutting down theirs. And I wouldn’t be surprised if the bankers aren’t the ones calling around seeking new, and profitable business opportunities in precious metals mining.
Should this not happen; if things get so bad that credit creation ceases completely, existence in the Industrialized West is going back to the dark ages that followed the end of the Roman Empire. In a situation like that, what’s a million dollars an ounce gold going to do for you in a world with no electricity or running water for your home or apartment, or flat for my UK readers.
I’m a big bad bear on the stock and debt markets, but I’m not that bearish to believe in a total collapse of the global economy to the point where the lights go out. It’s just a fact that the coming bear market will force the banking system to seek new sources of demand for their credit, and making loans for gold and silver mining would be an excellent beginning.
Here’s a chart from Zero Hedge; in our “booming” economy about 37 percent of the companies in the Russell 2000 aren’t profitable (Gold Plot).
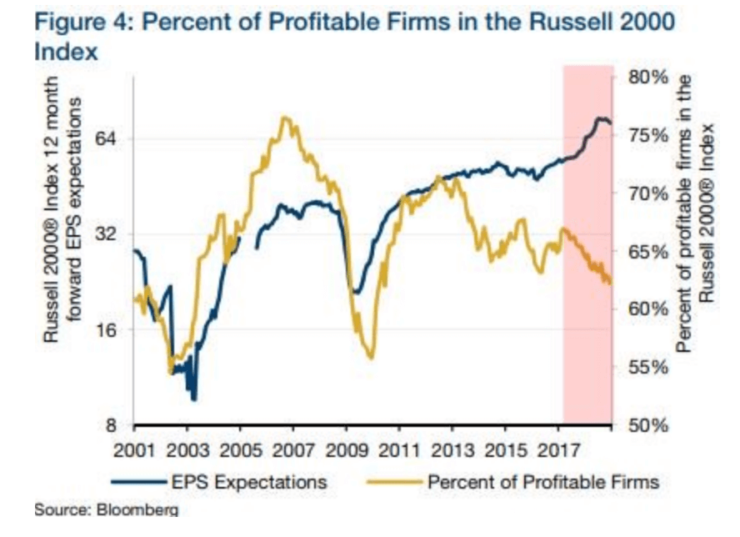
©Mark Lundeen
What will this percentage of unprofitable companies do when the economy enters a recession? I say it will increase as debt service must be a huge part of the problem. Here’s a video on zombie companies, companies with billions in market capitalization who can only service their current debt by taking on even more debt. This is a short-term solution that only makes their long-term problems more intractable.
Decades ago (pre-1970) this situation would have been impossible, as banks and bond buyers would have refused to allow things to come to this. But today decisions such as bond prices and yields are decided by the idiot savants sitting around the conference table at the FOMC. So it’s no surprise seeing this happen in the post-credit-crisis markets.
As far as the FOMC is concerned, having one’s company operating in a near state of bankruptcy isn’t any reason for shutting it off from the flows of credit from the Federal Reserve System in the 21st century.
The Fed Funds Rate (Blue Plot Below) was reduced to below 0.25 percent for years as the Federal Reserve executed three rounds of quantitative easings as they bloated their balance sheet to over four trillion dollars. Bond yields (Red Plot) declined to levels not seen since the 1950s.
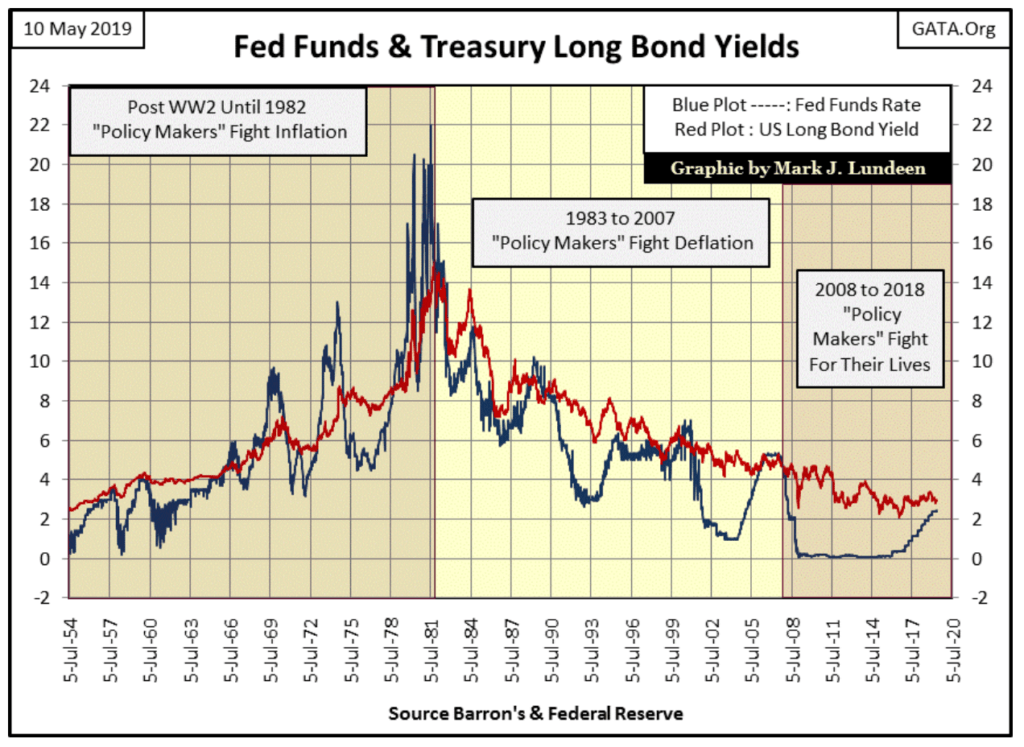
©Mark Lundeen
Given so many companies struggling to stay afloat to service their debts, one would think corporate bond yields would be considerably higher. That’s how it should work. But in our “regulated” markets valuations are managed, and you need no more proof of that than looking at current low corporate bond yields in the chart below.
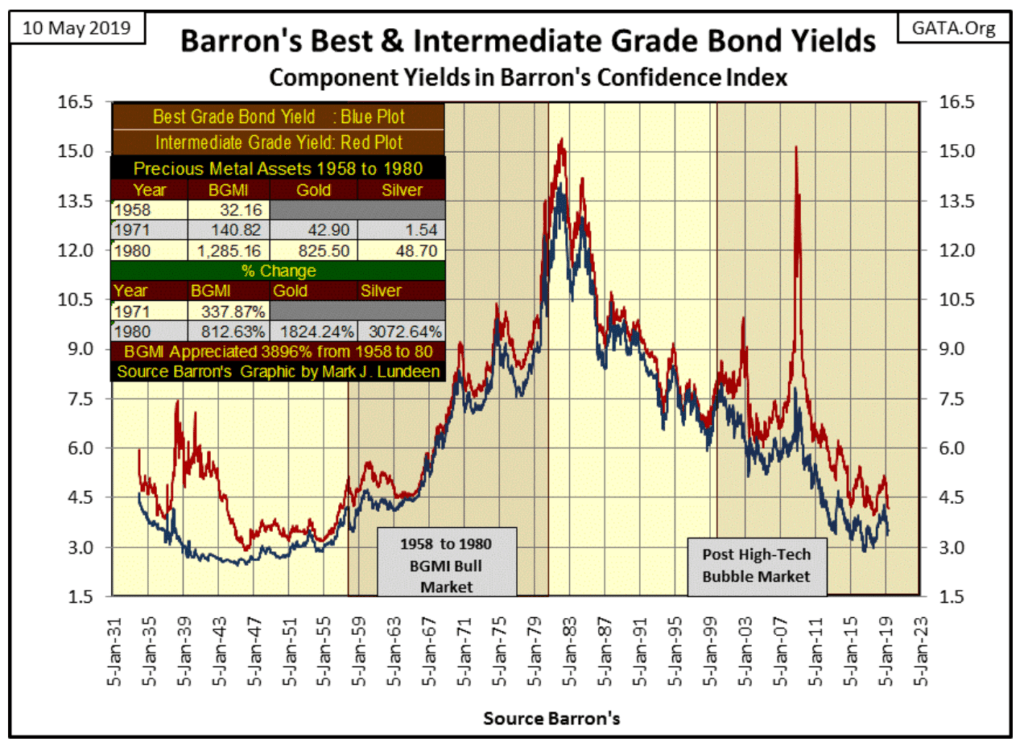
©Mark Lundeen
I placed a table in this chart to prove that gold, silver and the mining shares actually benefit from rising bond yields, as was the case from 1958 to 1980. The argument against holding gold as bond yields and interest rates increase is that higher yields make bonds more attractive than dead assets like gold and silver which pay no income to their owners.
What this argument totally ignores is that from 1958 to 1981, as bond yields increased from single to double digits, the bond market endured a horrific bear market in valuations. Any market suffering from collapsing valuations, as was the case in bonds from 1958 to 1981 isn’t going to attract increasing flows of investment capital.
The reason why bond prices collapsed as gold and silver prices enjoyed a huge bull market was that consumer prices (CPI Inflation) during these years also increased from single to double-digit annual percentages. Today, people who shop for their own groceries and pay their own bills know CPI data from the Labor Department are far below the reality of today’s rising costs of living.
Someday we’ll once again see bond yields increase as they did from 1958 to 1981, and as they do, flight capital from the debt markets will be one of the driving forces behind the coming bull market in gold, silver and the gold mining companies.
—
DISCLAIMER: This article expresses my own ideas and opinions. Any information I have shared are from sources that I believe to be reliable and accurate. I did not receive any financial compensation for writing this post, nor do I own any shares in any company I’ve mentioned. I encourage any reader to do their own diligent research first before making any investment decisions.


Bitcoin Stalls Near $60K as Strategy Moves, ETFs Outflow, and EU MiCA Rules Take Effect
Bitcoin hovers near $60,000 with ETF outflows, while Strategy boosts reserves, sells BTC, and raises dividends to reassure investors. Ethereum...


Cannabis Dominates Global Drug Use: Trends, Risks, and Shifting Markets
Cannabis remains the world’s most widely used illicit drug, with 256 million users in 2024, surpassing all others combined. Growth...


Italy Approves First Hydrogen-Powered Train for National Rail Network
ANSFISA has approved Italy’s first hydrogen-powered train, the Alstom HMU214, for use on the Brescia–Iseo–Edolo line. Capable of 140 km/h,...


Cotton Market Weakness Persists Despite Brief Rebound
Cotton prices fell to new lows last week before a modest rebound. USDA data shows crop conditions remain worse than...


Eli Lilly Hits $1 Trillion Valuation Amid Strong Bullish Momentum
Eli Lilly stock hit a record high, surpassing $1 trillion market value after strong product demand. Shares surged over 7%,...
 |
|
 |  |
 |
|
-

 Africa2 weeks ago
Remote Work Reshapes Sales Management: Key Lessons for Moroccan Leaders
-

 Biotech6 days ago
Gilead HSV Plan Could Transform Market Outlook
-

 Crypto2 weeks ago
Crypto Market Stays Stable as Bitcoin and Ethereum See Mild Declines
-
 Impact Investing17 hours ago
Italy Approves First Hydrogen-Powered Train for National Rail Network