Featured
Trade wars and interest rate hikes continue to be major risks in stock markets
While the market did not buckle from events such as Italy’s budget woes and the Kavanagh hearings, trade wars, Fed rates hike, rising US dollars and more continue to be major risks for a market crash.

“The job of central banks: to take away the punch bowl just as the party is getting going.”—William McChesney Martin, Federal Reserve Chairman, 1951–1970
“If banking institutions are protected by the taxpayer and they are given free rein to speculate, I may not live long enough to see the crisis, but my soul is going to come back and haunt you.”—Paul A. Volker, Federal Reserve Chairman 1979–1987, Chair Economic Recovery Advisory Board, 2009–2011
“I know you think you understand what you thought I said, but I am not sure you realize what you heard is not what I meant.”—Alan Greenspan, Federal Reserve Chairman, 1987–2006
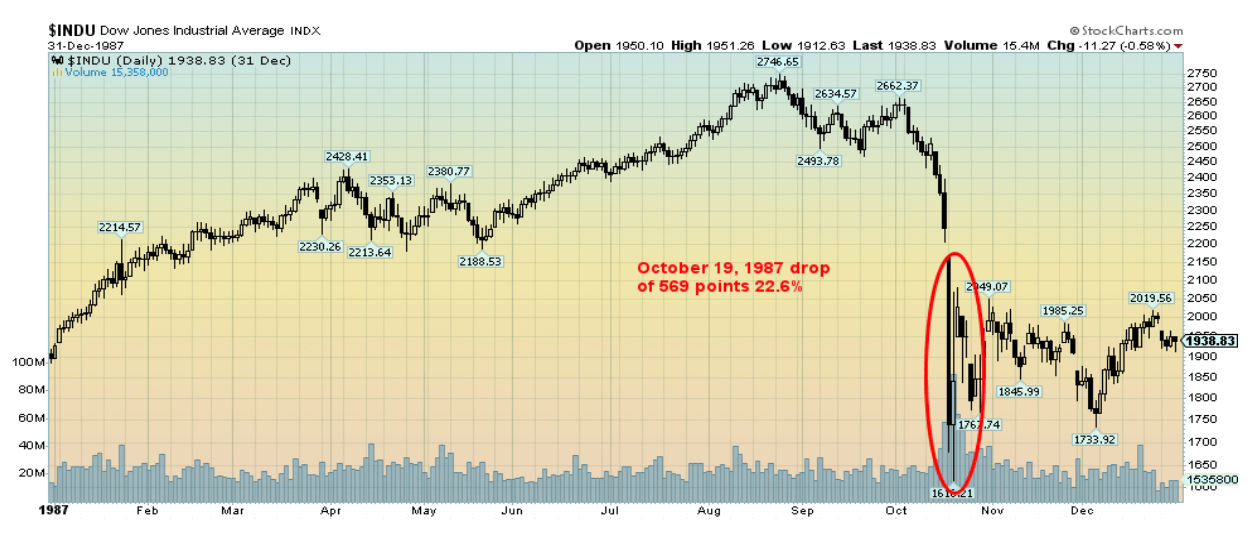
It’s October. It’s scary. Yes, Halloween happens on October 31 every year. It is the time of haunted mansions, black cats and Michael Myers. It is also the month of stock market crashes. If you have been around long enough, you may have even experienced one of them. And they have dark names—Black Tuesday and Black Thursday in October 1929 live on in infamy. Then there was Black Monday, October 1987. And for good measure, there was the Panic of 1907, October 1907. But there were also lesser known ones like the 554-point drop in October 1997 and the back-to-back October massacres in 1978 and 1979. There was also Friday the 13th in October 1989.
© David Chapman
We were working on the trading desk of a large financial institution during Black Monday, October 19, 1987. It was, we freely admit, a nerve-wracking experience. We were also around for the crashes in 1978, 1979, 1989, and 1997. We were also around for the bear markets of 1973–1974, 1980–1982, 1987, 2000–2002, and 2007–2009. So, we have seen a few. But October is also known as a month of bear market killers. Since WW2 there have been twelve significant bear markets see their end in October including 1946, 1957, 1960, 1962, 1966, 1974, 1987, 1990, 1998, 2001, 2002, and 2011. The Lehman Brothers crash of 2008 happened in September and made its first good bottom in October 2008, although the final low was not seen until March 2009. Ironically, the top of the 2007–2009 bear was seen in October 2007. It was the first time a top was seen in October.
The crash of 1987 was interesting. If that crash were to take place today, the Dow Jones Industrials (DJI) would fall as much as 6,000 points. Now, that would grab some attention. Could it happen?
Anything, of course, is possible. But are the conditions present that could cause a crash? There are many things happening. Trade wars are intensifying. But have they hit the point where they could tip markets over? Probably not. Despite all the so-called “bad news” of tariffs, the stock market keeps going up. That doesn’t mean they haven’t become intense. China and the U.S. keep trading barbs. The trouble for the Chinese is that they export more to the U.S. than they import. Still, the Chinese tariffs and boycott of U.S. soybeans have hurt U.S. farmers—that is, until Trump bailed them out. Then came the Trump accusation at the U.N., where China was accused of meddling in U.S. elections—except no proof was offered.
Many analysts view the trade wars as the possible tipping point to move the stocks markets into a bear market. Canada and the U.S. may be at odds over NAFTA. But Canada and the U.S. have faced trade disputes in the past dating back to the 18th century. These disputes have dominated politics, turned elections, and have forced Canada to walk a fine line between independence and total economic integration.
The U.S.-China trade wars are not new either. The U.S. has faced challenges to their economic dominance in the past. Think back to Japan in the 1970s and 1980s. And Japan was considered an ally of the U.S. Not so China. China poses a challenge to the dominance of U.S. global hegemony. China is pursuing its own global hegemony with the building of the “New Silk Road” and building the yuan as a potential new reserve currency. The U.S. and China have been engaging in a series of one-upmanship of tariffs. As we noted, the U.S. has a lot more goods they can target. China as $1.1 trillion of U.S. Treasuries that they could begin to unload. China can also lower the value of the yuan, which they have, but they only want to take it a bit lower and not send the yuan into a free fall. Trade wars are a lose-lose proposition. China has made it clear that they won’t talk trade under threats.
But the U.S., through tariffs and sanctions, is at war with many. The list is lengthy and some, such as the sanctions against supposed ally and fellow NATO member Turkey, are just bizarre. Even its allies are rebelling against the U.S.’ hegemony as the EU, Russia and China are joining forces with a mechanism called a “Special Purpose Vehicle” (SPV) to allow payments to get around Iran sanctions. That the EU is willing to join Russia and China shows how the U.S.’ relations with the rest of the world are deteriorating. Irrespective of this, the U.S. could also target the SPV, putting its feasibility in doubt. In trade wars, there are no winners. The 1930s proved that.
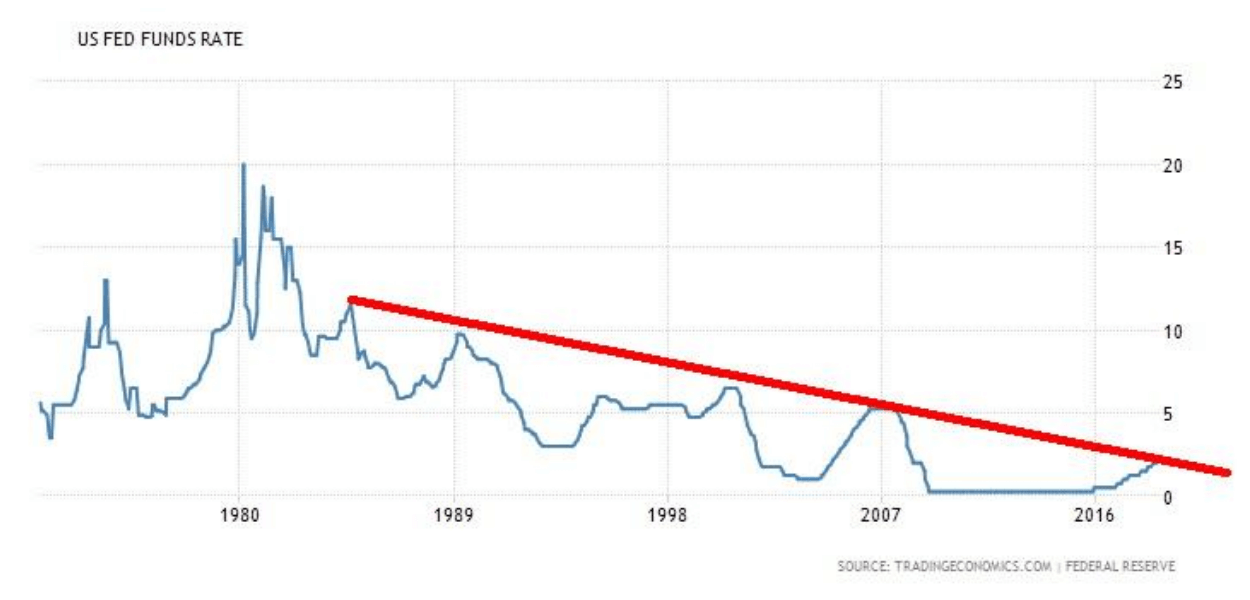
Interest rates are rising. Yes, the Fed is taking away the “punch bowl,” but there are few signs that the “party” is over. The U.S. economy remains relatively strong and unemployment is low. As was fully expected, the Fed hiked its key rate to the 2 percent to 2.25 percent range at their September 25–26 meeting. As well, the Fed dropped the word “accommodative” from its statements. The Fed targeted further rate hikes in December 2018 and three more in 2019. The Fed has a long history of starting to hike rates too late and continuing with them too long. Soft landings following rate hike cycles are extremely rare.
© David Chapman
Our chart of the Fed funds rate suggests the next move by the Fed would break the long downtrend that has been in place since the mid-1980s. While this particular chart doesn’t show recessions, it should be noted that following each peak in the Fed funds rate a recession followed. And, should we mention that President Trump likes lower interest rates.
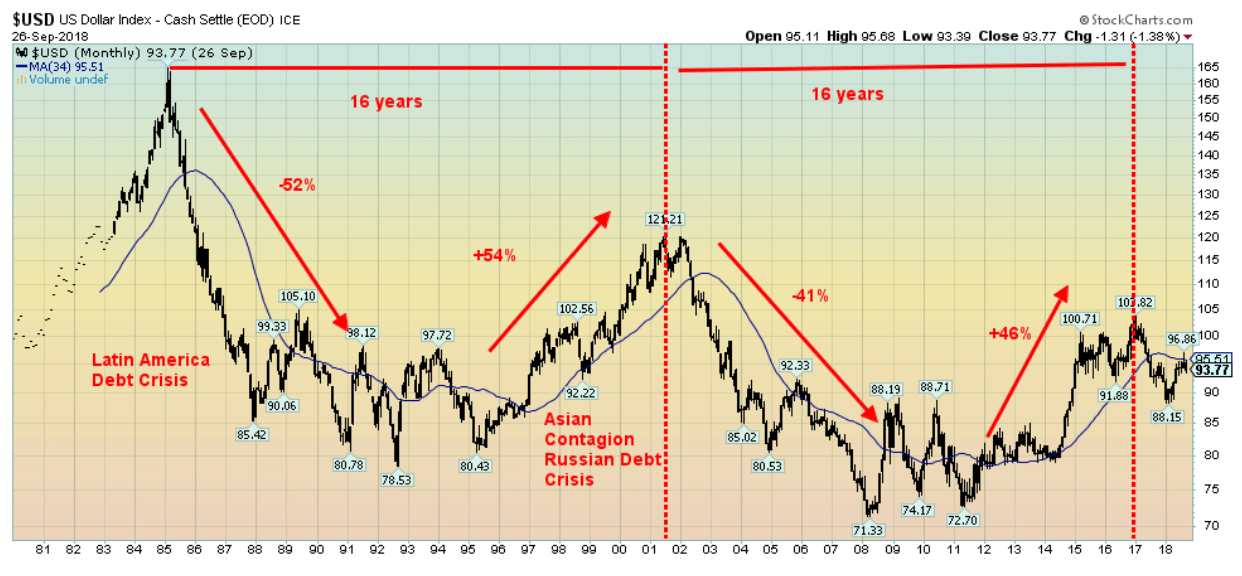
The U.S. dollar has been rising and that, in turn, puts pressure on U.S. dollar-denominated debt in foreign countries. There are sovereign debt concerns about Venezuela, Argentina, Turkey, Italy, China, even India, and others. The concerns in Italy and China are with their banking system. A collapse in one entity could lead to contagion and a systemic banking crisis similar to the ones in 1998 and 2008. Sovereign debt crises are not new. History is littered with them. This would merely be the latest iteration.
Our chart of the U.S. dollar below shows that the currency has gone through some wild swings since the 1980s. There is some interesting symmetry in the chart. Peaks in the US$ Index have occurred roughly 16 years apart. The US$ Index has gone through three major rises and two major collapses from 1979 to the present. What stands out is that during each sharp rise in the value of the US$ Index a sovereign debt crisis broke out either during the rise or after. The 1980s saw the Latin America debt crisis while the 1990s saw the Asian contagion crisis (1997). That was followed by the Russian debt collapse in 1998 that led to the collapse of the U.S. hedge fund Long Term Capital Management (LTCM) and almost brought down the global banking system.
That the crises were resolved by the lowering of the U.S. dollar and massive intervention in markets by the central banks is beside the point. Today, currency wars are taking place between countries and a move to de-dollarization appears to be underway. As we noted earlier, even the EU is becoming fed up with the U.S. and its tariffs and sanctions. The U.S. economy has been a global leader and, when combined with rising interest rates, it is putting upward pressure on the U.S. dollar and, in turn, putting considerable pressure on U.S. dollar-denominated debt held by foreign entities. There is an estimated $700 billion of foreign denominated debt maturing over the next year. Given the world has been through a series of debt crises since the 1970s, with each one of greater intensity than the previous one, another global debt crisis could tip the world not just into a recession but a depression.
© David Chapman
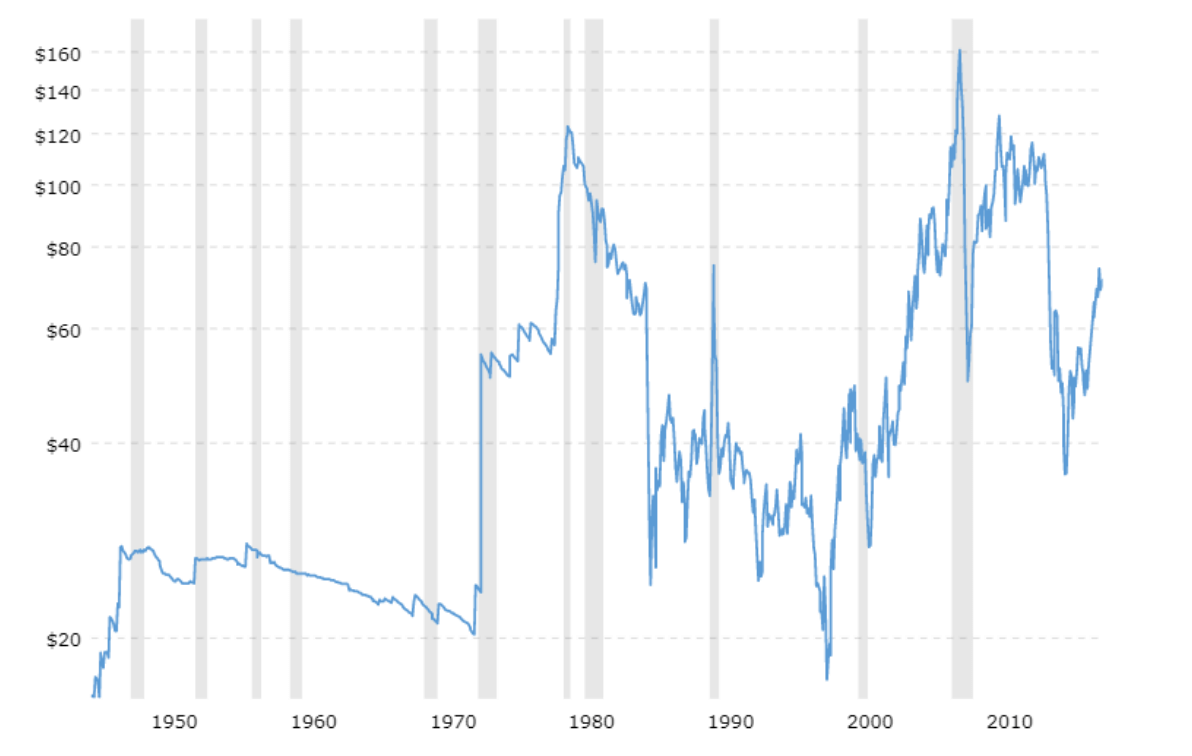
Oil prices are rising. History has suggested that a tripling of oil prices has in the past led to a recession (see chart below). In February 2016, oil prices bottomed at $26. Since then oil prices have almost tripled.
Our inflation-adjusted chart of oil prices dating back to the 1940s shows how each sharp rise in oil prices preceded a recession. With the latest breakout on WTI oil over $70, once again the next target could be as high as $85. The world’s three largest producers are the U.S., Saudi Arabia, and Russia. Together they produce just under 40 percent of the world’s oil. President Trump wants lower oil prices. He also wants Saudi Arabia to pump more to compensate for the loss of Iranian oil once sanctions begin to bite in November. Iran produces roughly 4 million barrels/day. Getting Russia to pump more is not going to happen. But Saudi Arabia also needs higher prices themselves as the Saudis are actually in a bit of a cash crunch.
With both the Saudis and the Russians not willing to pump more oil, that leaves it up to the Americans. That is unlikely to happen as well. Trump could order the release of oil from the strategic reserves, but that is unlikely as well. Combine rising oil prices with rising interest rates and that could turn into a deadly duo. Add in trade war pressures and the potential for a U.S. dollar crisis and we have several factors all adding up to potential trouble for the markets and the economy into 2019.
© David Chapman
Left out of this equation is the divisiveness in the U.S. that has become starkly obvious at the Kavanagh hearings. Democrats walked out of committee hearings in protest before the vote to allow a full Senate vote, there were some ugly confrontations between sexual abuse victims and a Republican senator, and the American Bar Association (ABA), the body that nominated Kavanagh, is now urging an FBI investigation before a vote takes place. Then there is the ongoing Mueller investigation that continues to lurk in the background, an investigation that has already ensnared numerous Trump aides. The November elections could be crucial.
There have also been rising global tensions among the Great Powers—U.S., Russia, and China. The U.S., along with others, is playing a cat and mouse game with Russia along the Russian border in Eastern Europe, the Black Sea, and in Syria. With China, the game is taking place in the South China Sea where U.S. and Chinese warships and airplanes follow and eye each other nervously. Iran remains an object of fascination for both the U.S. and Israel.
Although this is hypothetical, we have read scenarios whereby the November elections could be delayed. That would, however, need at the least the approval of congressional Republicans. The excuse would be questioning the integrity of the election to ensure only eligible voters were actually voting. That, in turn, could trigger a constitutional crisis and cause markets to shudder. It’s October. October can be scary. But we may not feel the fear until next year.
Bitcoin watch
© David Chapman
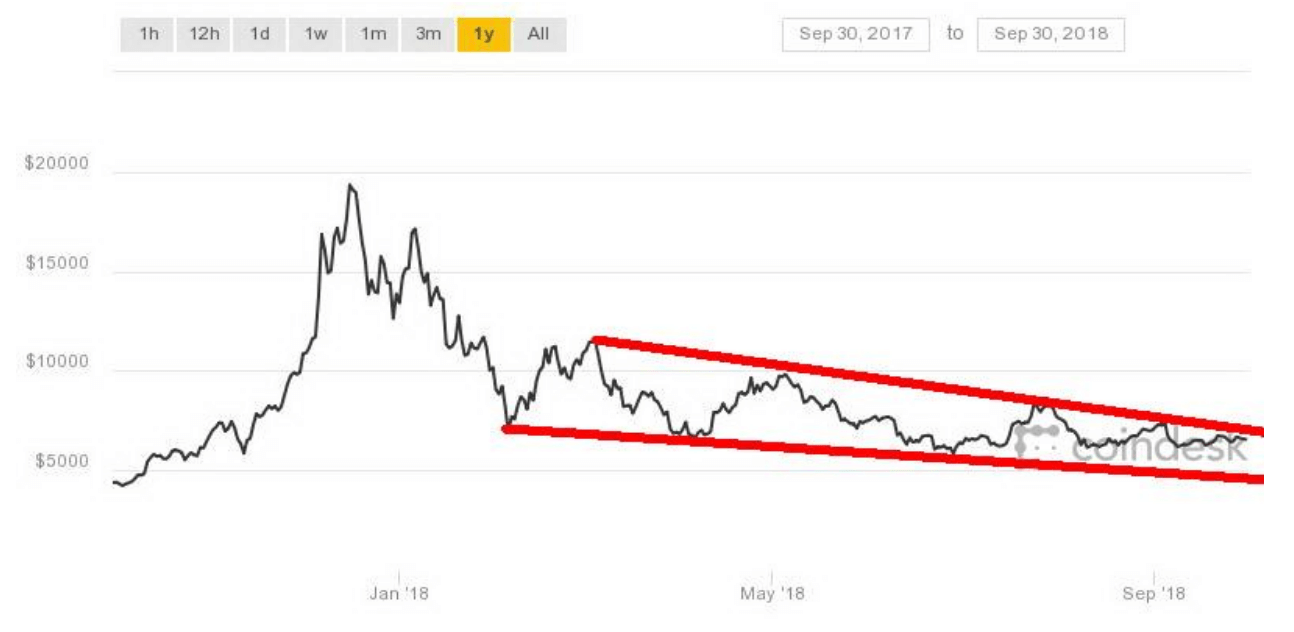
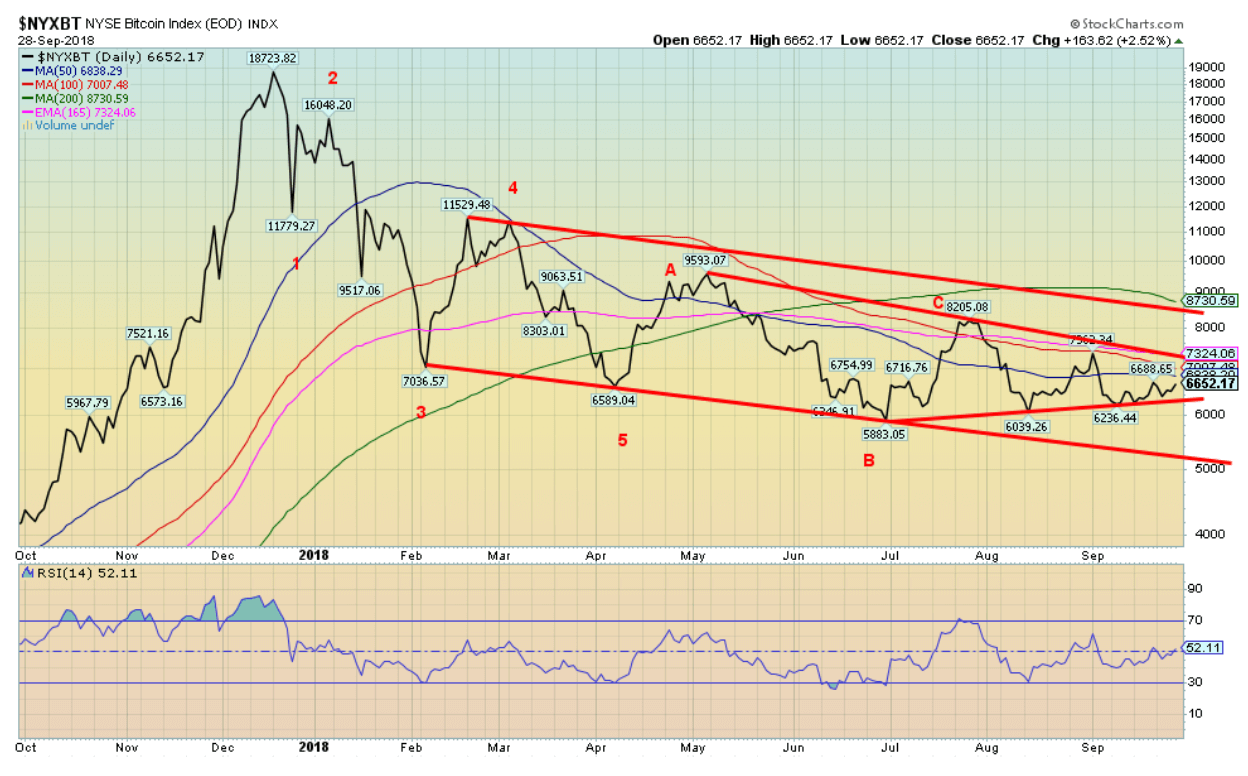
Very little has changed for Bitcoin and the cryptocurrencies in the past week. Bitcoin is up roughly 2 percent on the week. With Bitcoin once again trying to challenge the $6,800 level the bulls are out in force, predicting once again the imminent rise of Bitcoin in a new bull market. Volatility has fallen in the sector and in some respects that is not positive for a big rally. Volatility is at its lowest level since December 2016. Every time Bitcoin sticks its head up it seems that out comes another comment from regulators and then prices fall back. The regulators hang over the market like a sword, ready to chop it off.
While the bulls like to cite $6,800/$6,900 as possible breakout points they ignore the breakdown points at $5,900/$6,000. Certainly, the narrowing range tells us that, yes, the breakout and breakdown points are becoming increasingly important as they will determine the next significant move.
Regulators are hitting in a number of areas. They want more transparency, but the only way you can get that is for cryptos to abandon thoughts of privacy. Privacy and anonymity were one of the key propositions in the growth of cryptos. And what if regulators put in “know your client” rules like investment advisors have to adhere to?
Regulators remain concerned about market manipulation, fear of scams, and outright fraud. The more the crypto and blockchain industry tries to create the ability to protect privacy and prevent government intervention, the more the regulators want to intervene. But the fact that blockchain can effectively act outside of the system that bonds, stocks, futures, and others have to operate in makes it difficult for the regulators. An eternal battle. But what if governments and regulators challenged the legality of cryptos?
The market cap of all cryptos listed at Coin Market Cap was at $216.7 billion this week, down from $224 billion the previous week. The number of cryptos listed grew to 2,003 up from 1,981 the previous week. Amazing how the universe continues to grow and grow and grow. The number of cryptos with a market cap of $1 billion or more slipped to 16 from 17. The universe of dead coins, parodies, scams, and others seems to have come to a standstill. It remains at 911, unchanged from a week earlier.
Bitcoin continues to coil. Volatility has fallen. That tends to precede a rise in a volatility. But when will it happen?
© David Chapman
Markets and trends
Note: New highs/lows refer to new 52-week highs/lows. © David Chapman
© David Chapman
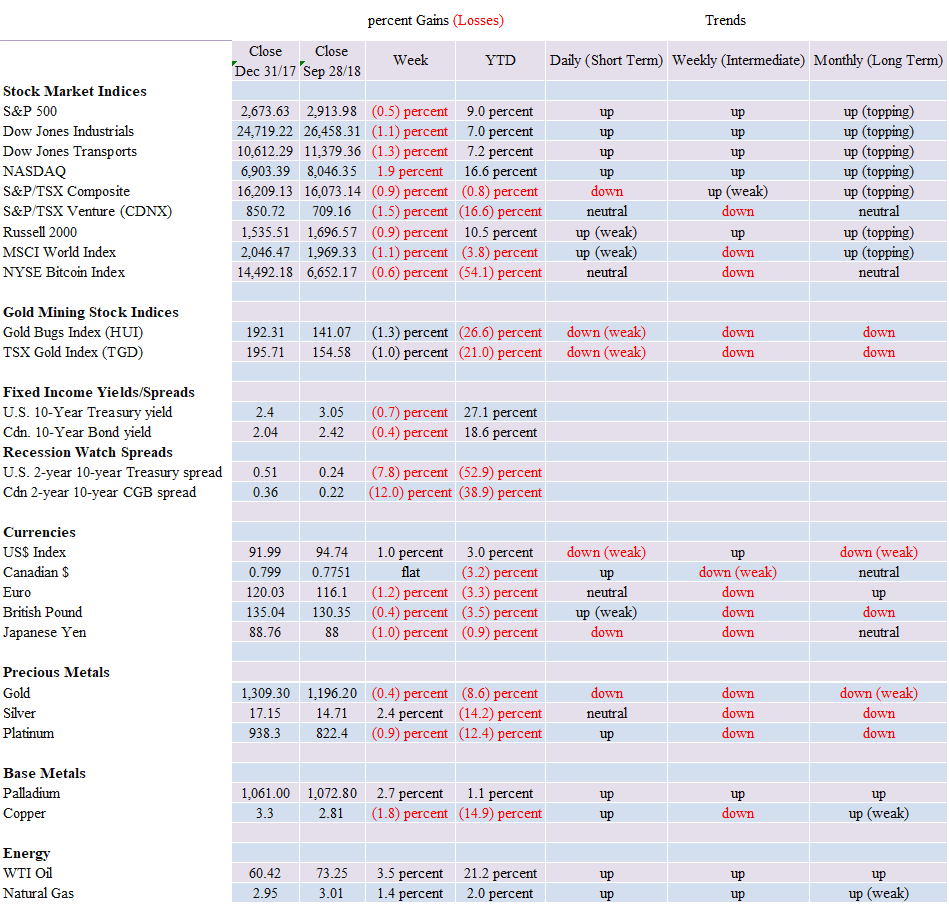
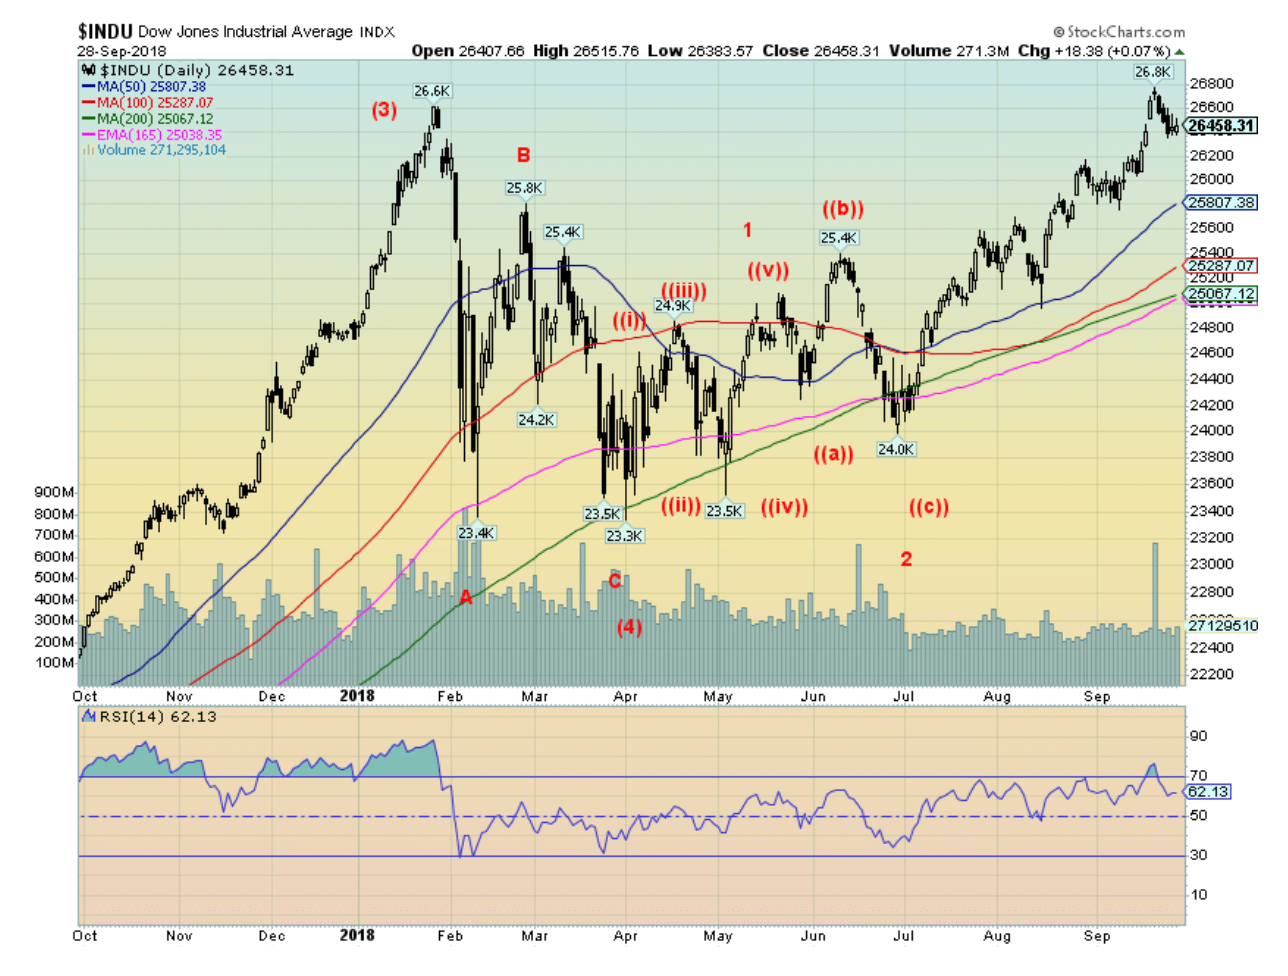
U.S. stock markets generally put in a negative week against the backdrop of more tariffs against China, Trump’s bizarre accusations of the Chinese meddling in the elections while offering no evidence, the Kavanagh hearings and the backdrop of the strong Q2 GDP. The Dow Jones Industrials (DJI) fell 1.1 percent on the week, while the S&P 500 was down 0.5 percent. The Dow Jones Transportations (DJT) fared worse, off 1.3 percent while the NASDAQ bucked the trend rising 1.9 percent. The small cap Russell 2000 was off 0.9 percent on the week. Given that September 28, 2018, marked the end of Q3 it is noteworthy that the DJI gained 9 percent during the quarter while the S&P 500 was up 7 percent. Both indices have been up in 11 of the past 12 quarters. The NASDAQ gained 7 percent as well during the quarter and is now up 9 consecutive quarters.
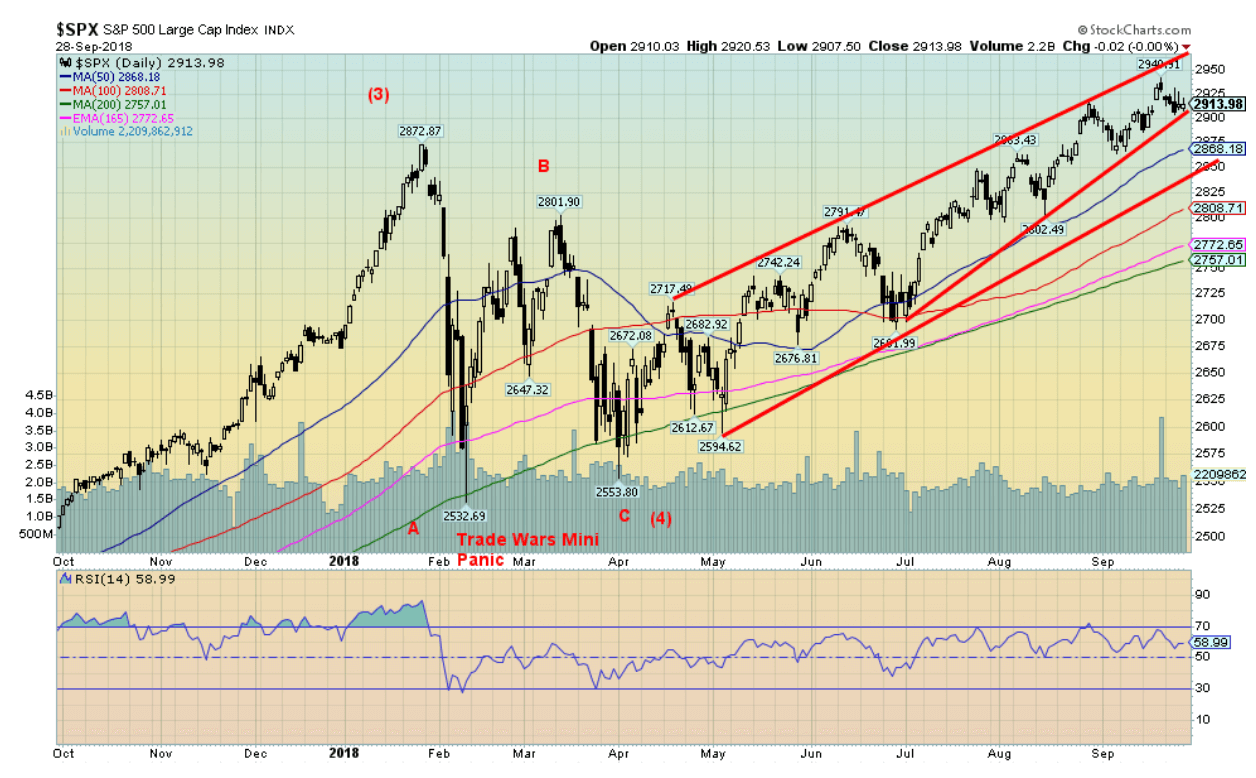
We don’t see any sign of a top in the market yet, but then the top in January 2018 came quickly and the drop that followed was sudden and swift. We believe we are working on a third wave of the fifth wave, up from the February 2016 low. It may very well be we are starting another corrective period that would take us into October. We only see some danger below 26,200 and even more danger under 25,800. The 26,200 would represent the last high and 25,800 would represent the last daily low. The latter also coincides with the 50-day MA. It is not unusual to test the 50-day MA in a rising market. Below 25,800 we could fall once again to test the 200-day MA currently near 25,050.
© David Chapman
The S&P 500 appears to have formed a possible rising wedge triangle. If correct, it is on the cusp of breaking it. A firm break could take us down to the 200-day MA near 2,750. Other global markets were mixed this past week. The Canadian TSX Composite fell 0.9 percent while the TSX Venture Exchange (CDNX) continued its woes, falling 1.5 percent. The global MSCI World Index lost 1.1 percent, but not all foreign markets were down on the week. China’s Shanghai Index (SSEC) gained 0.9 percent while the London FTSE, despite Brexit appearing to come apart at the seams, was up 0.3 percent. The European markets were generally weaker, although the Paris CAC 40 was flat while the German DAX lost 1.5 percent thanks to fears of contagion from Italian banks. The Tokyo Nikkei Dow (TKN) was up 1.1 percent against the backdrop of a weaker yen.
Stock markets seemed to have more focus on the goings-on in Washington and the trade wars than the so-called good news of Q2 GDP that came in at 4.2 percent. Of course, that may be the good news. Early indications are that Q3 won’t be as good, largely because of the growing trade deficit (see the Chart of the Week). Retail sales were also sloppy in August. And the recent weekly jobless claims jumped, largely because of the after-effects of Hurricane Florence. The recent Chicago Purchasing Managers Index (PMI) fell to a five-month low. And finally, the recent Michigan sentiment index (consumer sentiment) also came in below expectations. So, all of that leaned on the markets this past week. Still, if that was the drop it wasn’t much. What might be key is if the S&P 500 were to break down under 2,860 and the 50-day MA.
© David Chapman
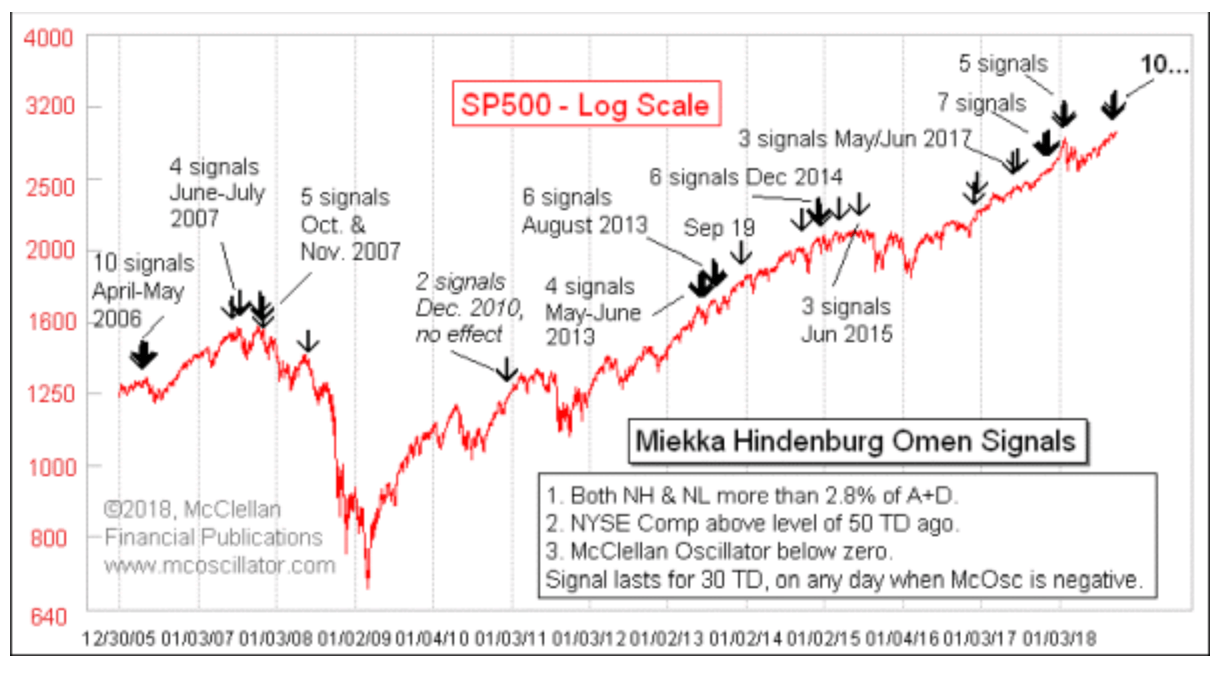
Above shows the deadly Hindenburg Omen, as presented by Tom McClellan of McClellan Financial Publications. So, what is the Miekka Hindenburg Omen? We all know what the Hindenburg was: the German passenger airship LZ 129 that, on its maiden voyage across the Atlantic from Frankfurt, Germany to Lakehurst, New Jersey, USA, caught fire and was destroyed during its attempt to land. Of the 97 people on board, 35 were killed, plus one more killed on the ground. The entire disaster was caught on camera as numerous news crews descended upon Lakehurst for the landing. The disaster was immortalized in a 1975 film of the same name. So, the Hindenburg is as it suggests: a portend of disaster.
What the Hindenburg Omen is, is when the stock market starts to see a number of new highs (NH) and new lows (NL) exceeding a certain threshold on the same day. The signal usually occurs in clusters and is not necessarily a one-off. Admittedly, the signal is mixed as sometimes it works, sometimes it doesn’t, and sometimes it is dead-on with a mini-crash or at least a good pullback. As the chart above shows there was quite a cluster of them before the Lehman Brothers collapse in September 2008. The most recent cluster has seen 10 signals and that ties a record. Five signals occurred just before the trade war mini-panic of February 2018. At other times, the results have been muted.
With 10 signals so far in September, the month of October might be scary yet. But even then, if it were a little scary, it might present another buying opportunity. Oddly enough, October is also one of the better performing months despite its history of crashes.
© David Chapman
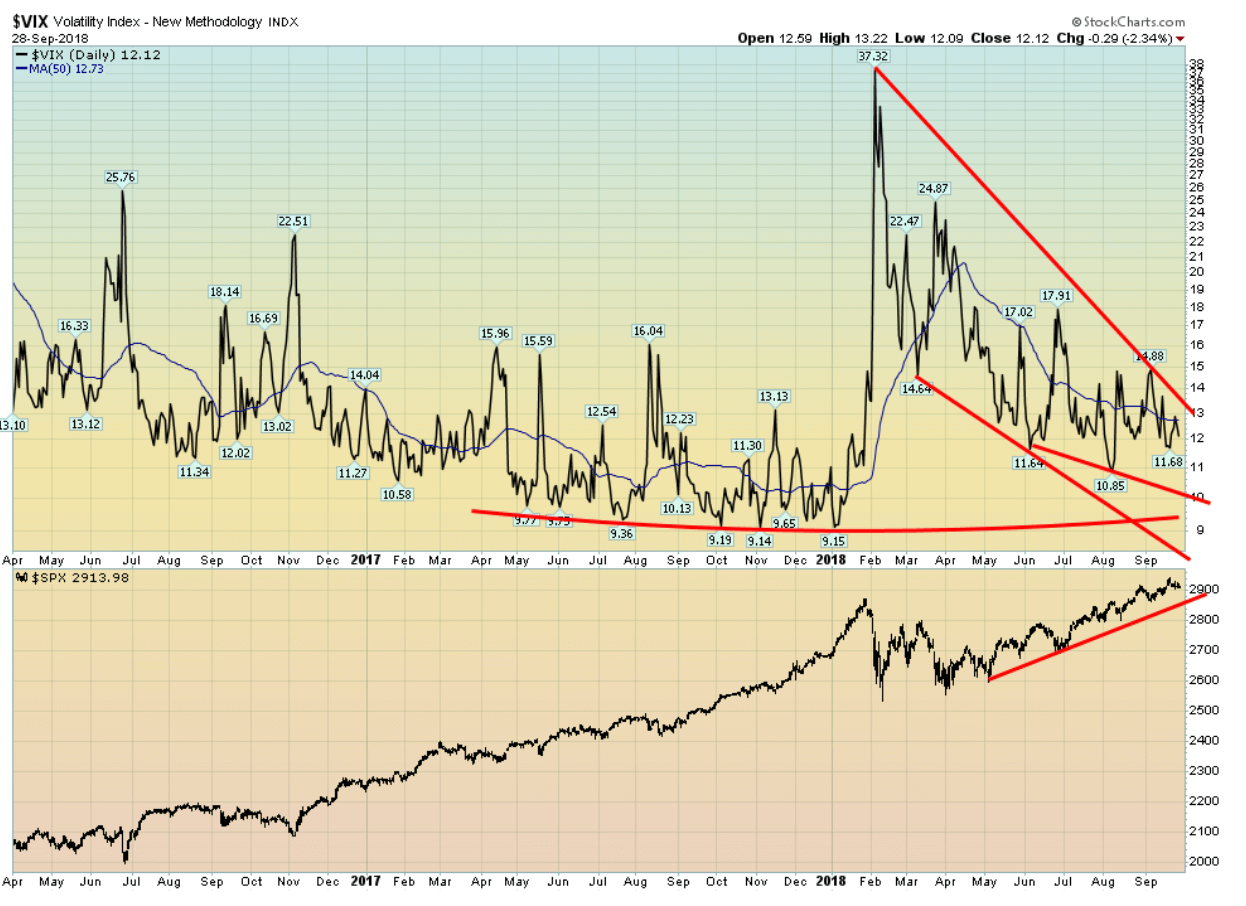
Volatility, as measured by the VIX volatility index remains low, although well above the levels seen throughout much of 2017. The trade war fears spiked the index (the VIX moves inversely to the stock indices), and the return action as the market resumes its climb has not taken the VIX down to the 2017 levels. That is not surprising as the VIX is actually measuring volatility in the market and, since February, volatility has gone up even as it has improved recently. A breakout now could occur over 13 and especially above 15. The area is worth keeping an eye on. It is highly unlikely to see the lows of 2017 near 9 again.
© David Chapman
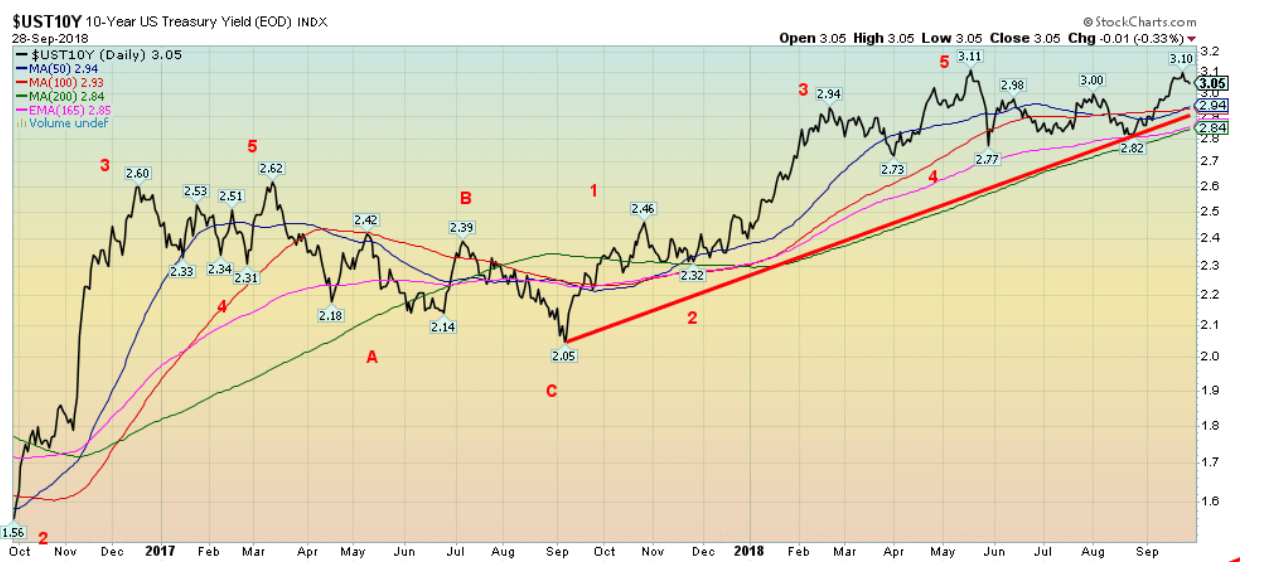
Despite the Fed hiking the key Fed rate 25 bp this past week as was widely expected to 2 percent–2.25 percent, the 10-year U.S. Treasury note yield actually improved slightly falling to 3.05 percent from 3.07 percent the previous week. So far, the 3.11 percent high seen in May 2018 remains intact. A week ago, we thought the U.S. bonds had room to move higher. Failure near the 3.11 percent could suggest instead a potential double top scenario with a neckline currently around 2.84 percent. This past week the Italian government increased their budget sharply and that, in turn, weighed on Italian bonds and, in turn, on Italian banks, spilling over into the EU stock markets. A beneficiary was U.S. Treasury bonds with a flight to safety. Also, some weaker than expected economic numbers that we outlined under our S&P 500 comment helped push yields lower. Furthermore, the closely watched PCE Index of inflation (the Fed’s favorite) fell to 2.2 percent year-over-year from 2.3 percent. Lower inflation would encourage lower bond yields. Higher yields now remain in the balance and, if weaker economic numbers persist, then odds favor lower, not higher, yields.
Recession watch spread
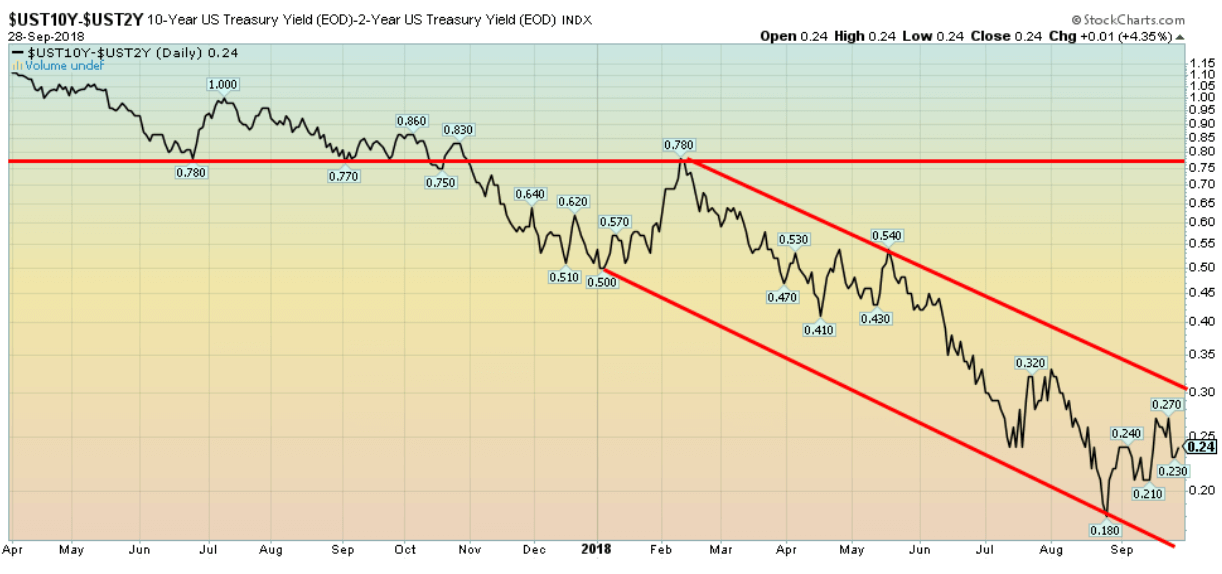
© David Chapman
With the Fed hiking interest rates as expected this past week and with the 10-year bond yields lower as a result of weaker economic numbers, the recession watch 2–10 spread narrowed this past week to 24 bp from 26 bp the previous week. The trend, as we have often noted, remains down, but we are nowhere near negative spreads that might indicate an impending recession. We remain on target for 2019 before we believe we’ll see negative 2–10 spreads.
© David Chapman
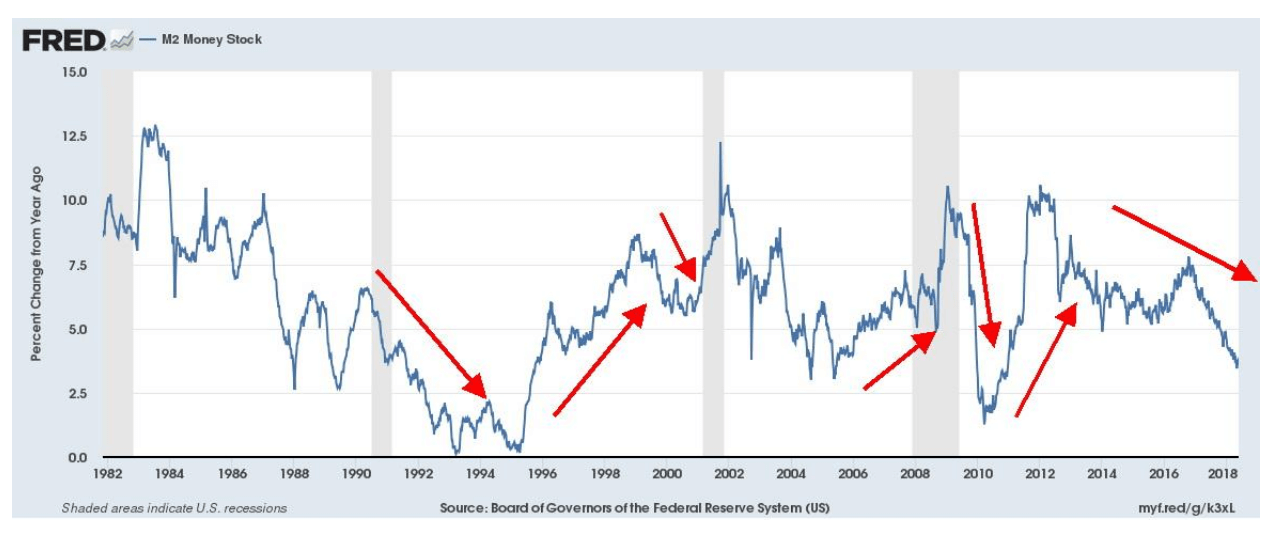
It is worth noting that money supply growth is slowing and has been for the past two years. When money growth slows it suggests that liquidity is being “sucked” out of the system. The slowing more or less coincides with the end of QE and the start of the Fed hiking of interest rates. The previous slowing of M2 usually preceded recessions. It is not exact by any means but it is a sign. It is noted, as well, that global M2 is also slowing.
© David Chapman
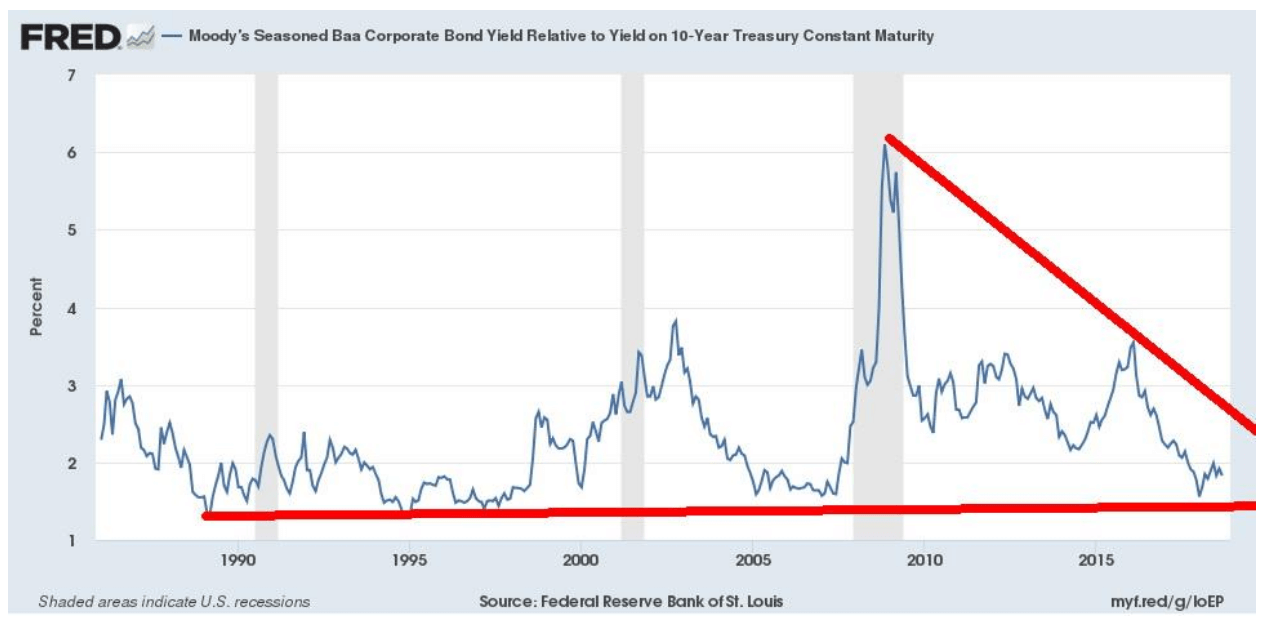
The spreads on Baa corporate bonds to the U.S. 10-year Treasury note remains near record lows. A Baa rating from Moody’s is the equivalent of a BBB+ from S&P and Fitch. Baa is still investment grade and is the highest ranking of the Baa category. Anything ranked Ba or lower is speculative grade (junk bonds), and a B or lower is highly speculative junk bonds. As noted, the spread with the 10-year remains near record lows seen throughout much of the 1990s and in the mid-2000s before the financial collapse of 2008. The spread has come off its bottom, but so far it is just a blip as the market remains largely unconcerned about credit quality. But, as can be seen in previous cycles, that can change very suddenly so it is no reason for complacency.
© David Chapman
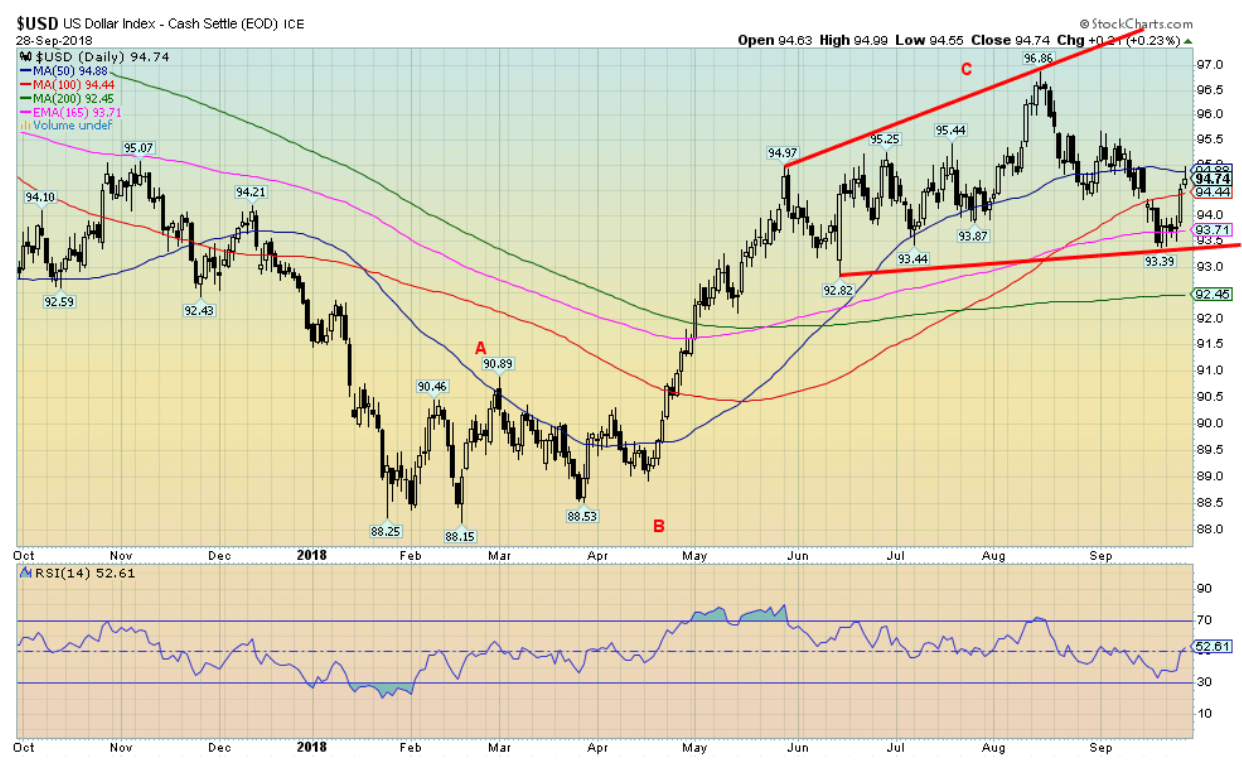
The US$ Index rebounded this week, gaining 1 percent. The euro lost 1.2 percent. The euro was weaker because the Italians announced a big budget deficit and, once again, the specter of a collapse of the shaky Italian banking system came to the front. Since the Italian banks, in turn, have large exposures to other EU banks, particularly German banks such as Deutsche Bank, it sparked a drop in the German DAX and a flight to safety in U.S. Treasuries. That, in turn, helped push up the U.S. dollar. Who cares about Trump speeches at the U.N. or the troubles of Judge Kavanagh at his confirmation hearings for the Supreme Court? The Fed helped things along by hiking, as was widely expected, the Fed rate by another 25 bp and then indicated another one in December and possibly three more in 2019. Far more safety over the U.S. than the shaky EU system. And then there is Brexit. The pound sterling actually hung in, losing only about 0.4 percent. The big drop came in Japan as the yen fell 1 percent. The Japanese can’t it seems, ever get out of their years of rolling recessions and forever QE. The Cdn$ was flat on the week. The pattern of the US$ Index looks like a huge ABC type with the C wave topping recently at 96.86 in August. It is possible that the US$ Index could be forming a head and shoulders top pattern and we are currently working on the right shoulder. But that is unconfirmed. The neckline would be currently around 93.50 and a firm breakdown under that level might suggest a decline to 89.50. The 200-day MA is currently down near 92.45. Only a move above 95.50 might negate this scenario. Given continued flights to safety and fear of Italian banks that could well happen.
© David Chapman
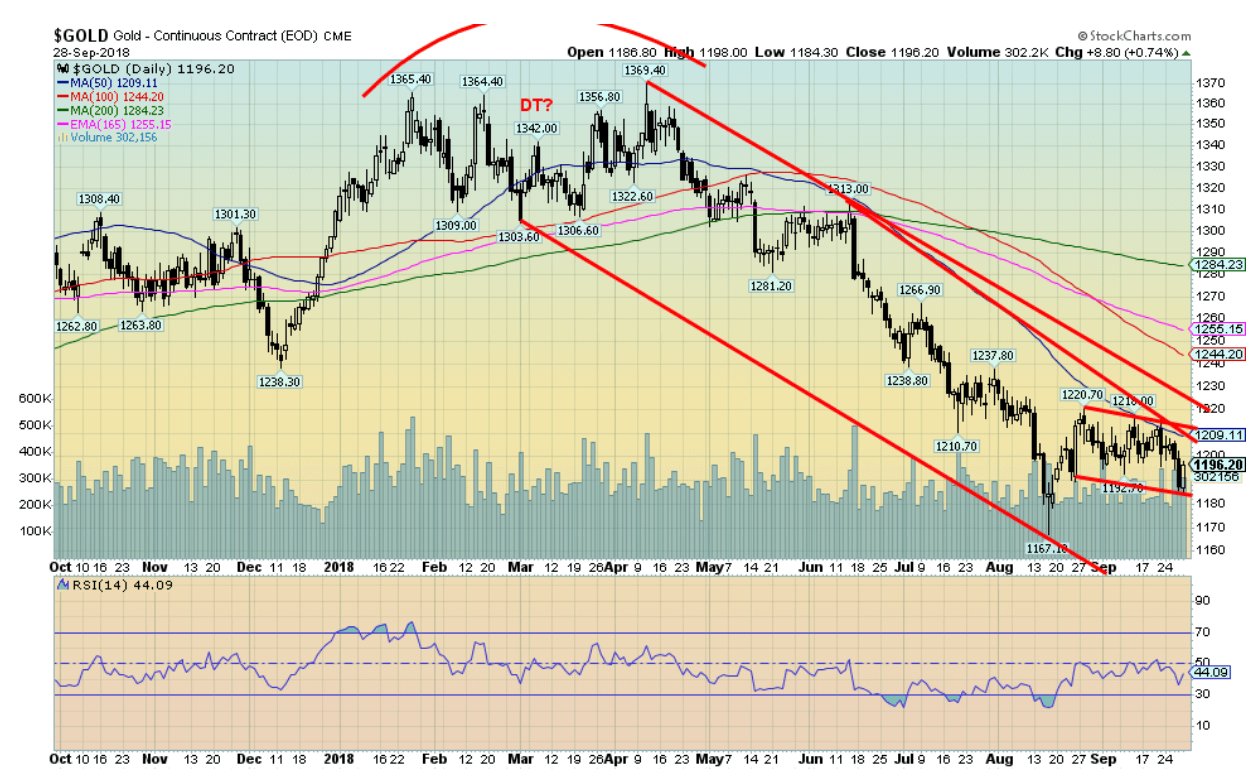
With the U.S. dollar higher, it probably comes as no surprise that gold was down on the week, losing 0.4 percent. Things did not look good on Thursday when gold fell through $1,190. It looked like a breakdown with the potential to fall to targets down at $1,140. Then on Friday gold suddenly reversed and closed up on the day by 0.7 percent, not quite reversing the previous day’s decline. That left us a bit baffled as to what the next move is. A break under $1,180 would most likely seal the deal that the move is down. On the other hand, the $1,210 $1,220 zone has proven to be the resistance we said it was. The 50-day MA is now seen at $1,209, highlighting the resistance zone. Above $1,220 gold should rise to $1,245 $1,255. Gold needs to regain above $1,300 to confirm the bottom at $1,167.
We noted some time ago that we thought the cycles might have expanded a bit. Gold had, according to Raymond Merriman of MMA Cycles (www.mmacycles.com) exhibited a potential 7.83-year cycle. That cycle divided a longer 23-year cycle. The last 23-year cycle bottomed back in 2001. The first phase of 7.83 years bottomed in 2008 and the second phase bottomed in 2015. If we truly are in the third phase, the final low is not due until 2023 or as late as 2024. The 7.83-year cycle subdivides into three 34-month cycles with a range of 28-40 months or possibly as late as 42 months. We suspect the last 34-month cycle bottomed in December 2015, making the next one due (or in this case the first 34-month cycle low of the current 7.83-year cycle) due in October 2018, plus or minus 6 months. We are right in the midst of that window. But we need confirmation that the low is in and that has not happened. Regaining $1,300 would confirm it for sure. Then the upside target could be at least $1,485 with a potential to rise to as high as $1,725. In the interim, there remains considerable work to do to convince us that the 34-month cycle low is in.
© David Chapman
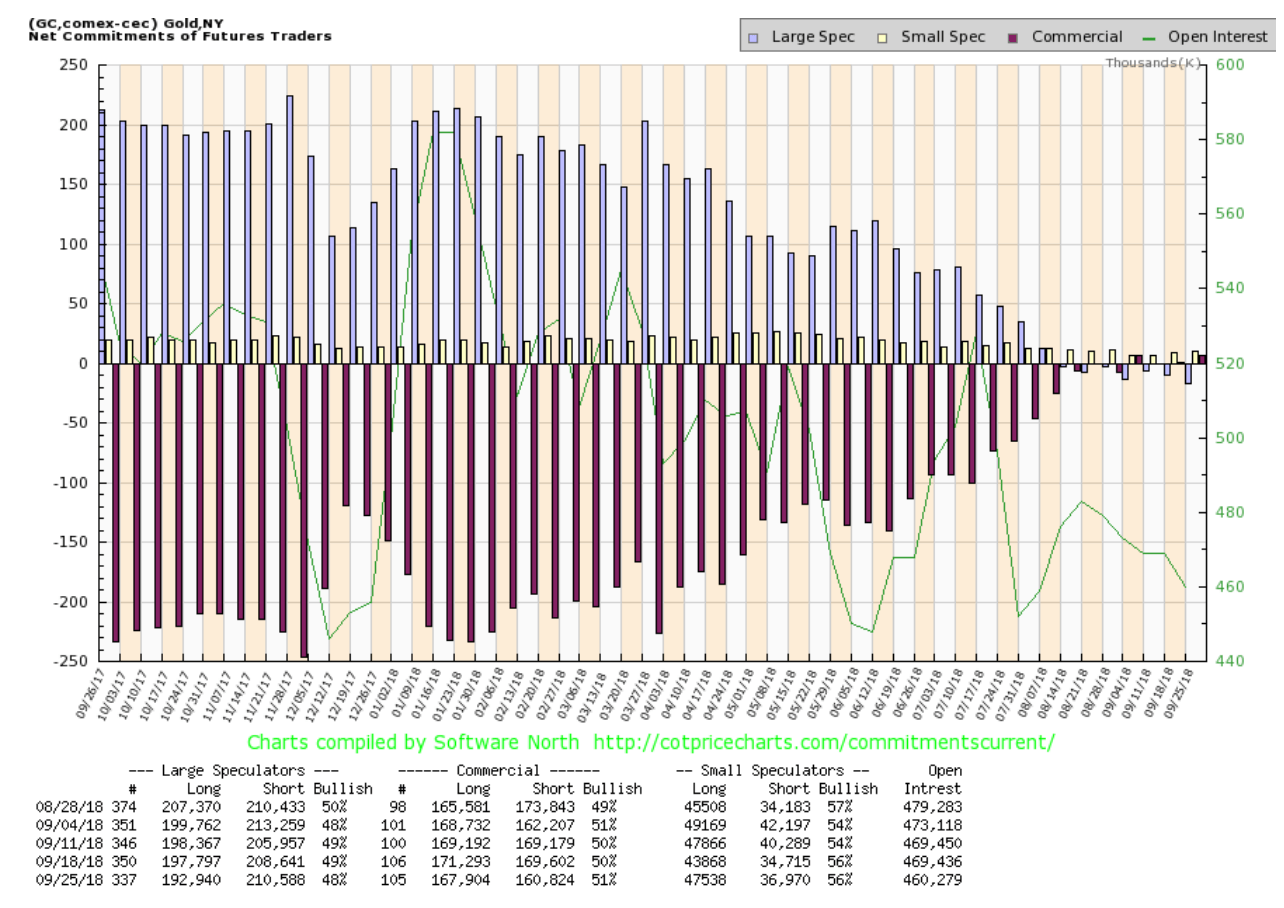
The commercial COT for gold came in quite positive this past week, rising to 51 percent up from 50 percent the previous week. Both long and short open interest fell. Long open interest was off just over 3,000 contracts while short open interest fell about 9,000 contracts. Not surprisingly, the large speculators COT (hedge funds, managed futures, etc.) slipped to 48 percent from 49 percent as they slashed their longs by about 7,000 contracts while raising their shorts by about 2,000 contracts. As we have noted before, we have never seen a positive commercial COT for gold although some suggested it did occur way back in 2001 at gold’s major bottom.
© David Chapman
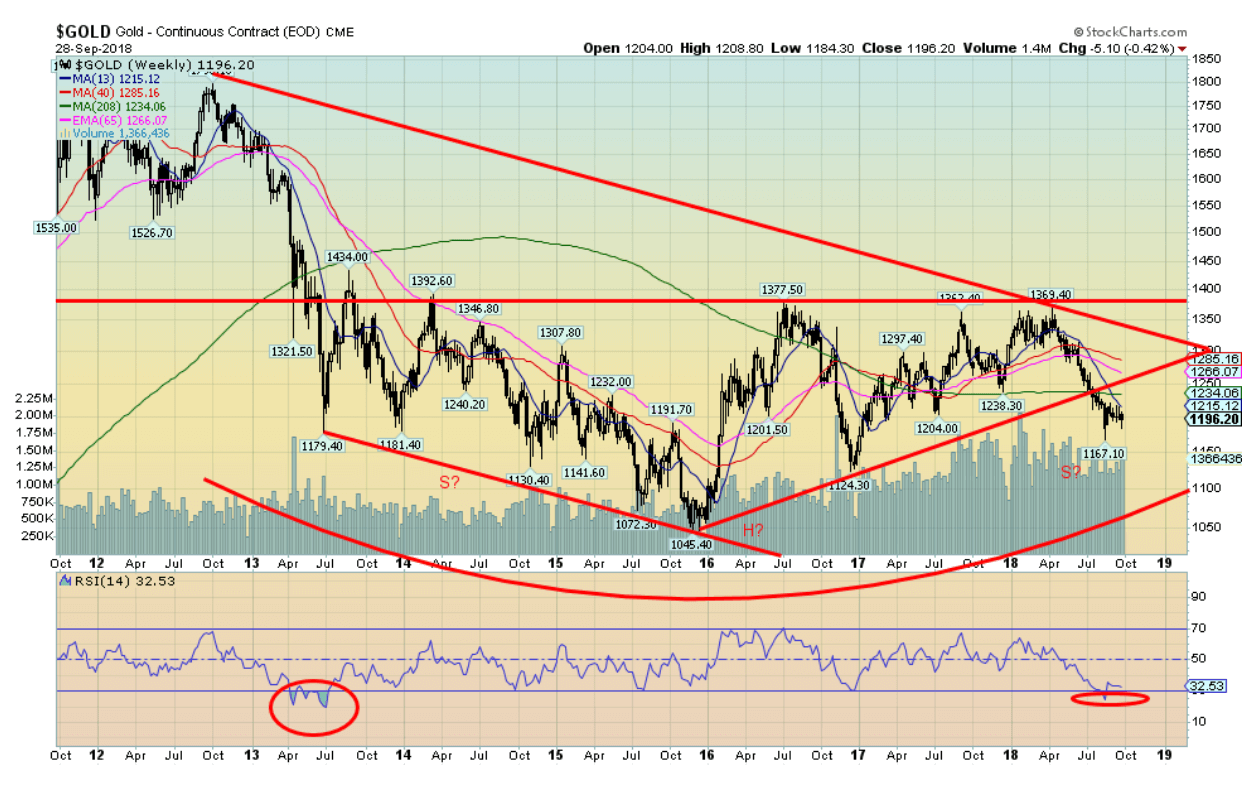
There are a few interesting things about this chart that date back to 2012. If one is a bull, we see what appears to be a large potential head and shoulders bottom pattern with the head seen at the 2015 low. But if we are a bear, we see what appears to be a breakdown of the uptrend line from the 2015 low. One could argue that the breakdown projects down to $900 based on the low of $1,045 in December 2015 and the high of $1,377 in July 2016. One could argue the rally seen out of the December 2015 low unfolded as an ABC type pattern with the A wave topping at $1,377, the B wave bottoming at $1,124 in December 2017, and the C wave completing at $1,369 in April 2018. We’re loath to even think that this might be a continuation pattern to the downside, especially given the still very negative sentiment and the quite positive COT. That is what makes a turn up so important. But a lot depends on the U.S. dollar that has, by our own admission, been quite strong since bottoming in February 2018. The failure this past week to break out over $1,210 $1,220 leaves us somewhat discouraged and keeps alive the potential bearish scenario. As we noted earlier, a break of $1,180 could see gold fall to its next target near $1,140.
© David Chapman
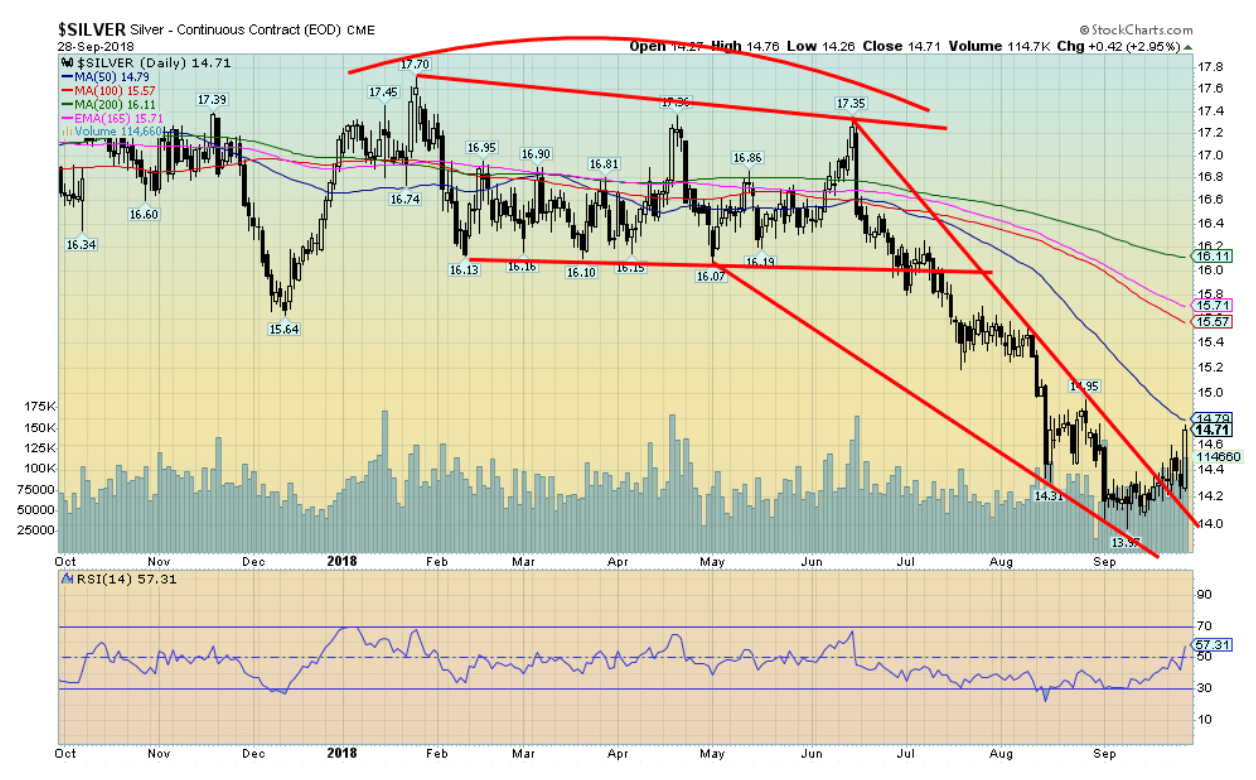
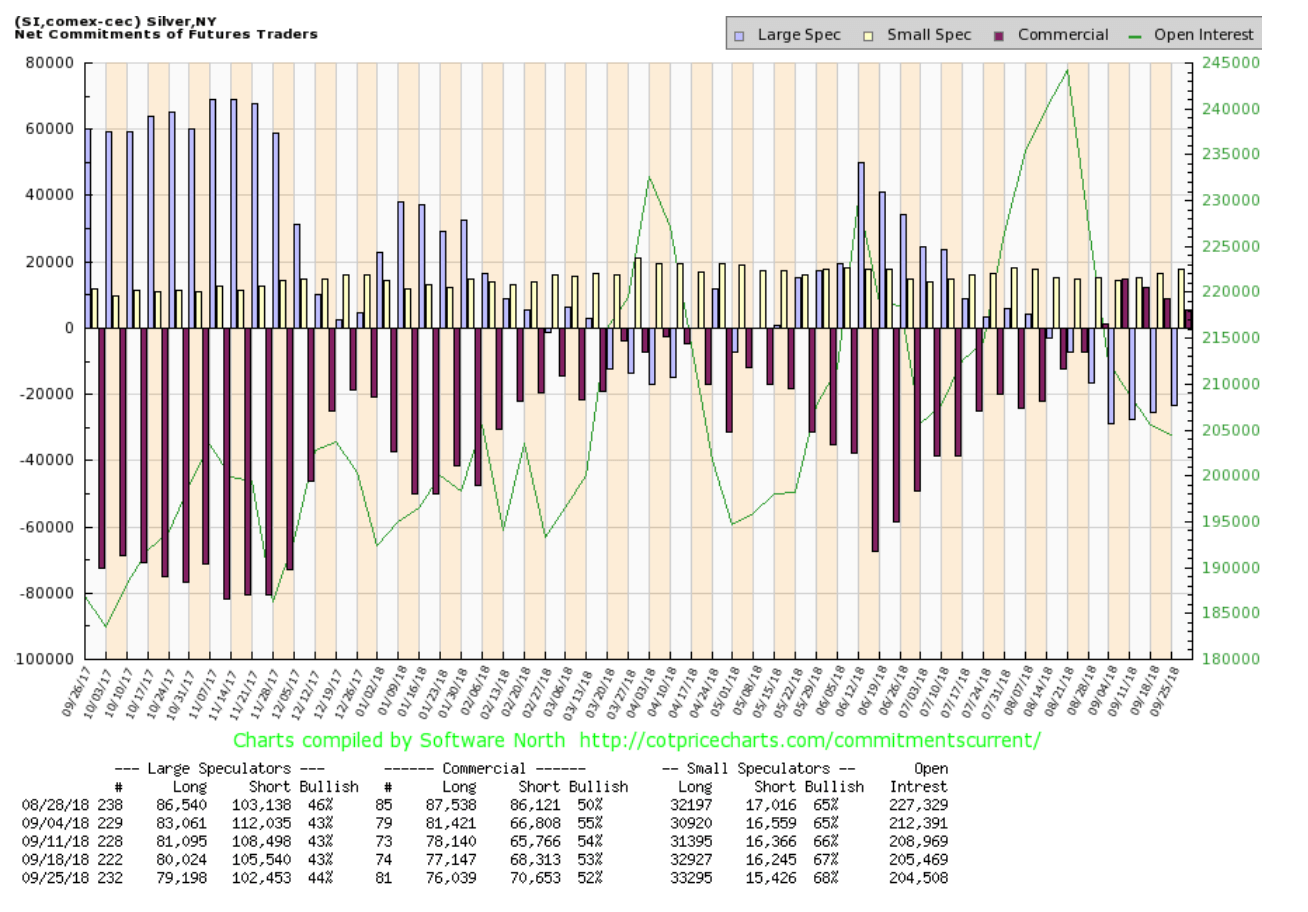
Silver prices jumped almost 3 percent on Friday as they took out resistance at $14.50 $14.60, closing the week at $14.71 and up 2.4 percent. It was, by many measurements, an encouraging week for silver. The 50-day MA is just above at $14.79, so that should be the next hurdle to get over. Once above that level, and especially above $15, we can most likely confirm a low is in and we could run quickly to more significant resistance at $15.60 to $15.70. The last hurdle would be the 200-day MA, currently near $16.10. It is an understatement to say that silver has more work to do. The topping pattern that formed between January and June 2018 suggested a minimum objective of $14.44. The next target below there would be $13.44. The low thus far was $13.97, a decline of $3.97, off the $17.70 high seen back in January 2018. Like gold, the prime reason for silver’s decline was the rise of the U.S. dollar. The US$ Index bottomed back in February 2018 at 88.15. Given the US$ Index was up this past week, the rise in silver was encouraging. And it was doubly encouraging, given that gold was down on the week as were the gold stocks. If a strong rally is to get underway for gold and silver we would want silver to be leading. Support now should be seen at $14.50. Only below $14.20 would we become concerned that there is more downside work to be done.
© David Chapman
The silver commercial COT is not as bullish as the gold commercial COT, but it is still quite good. This past week the silver commercial COT slipped to 52 percent from 53 percent. Long open interest fell just over 1,000 contracts while short open interest rose just over 2,000 contracts. The large speculators COT rose to 44 percent from 43 percent as they cut about 3,000 contracts from their short open interest. The managed futures are still holding record shorts. Given silver’s jump this week we might see some short covering by the large speculators in next week’s silver COT.
© David Chapman
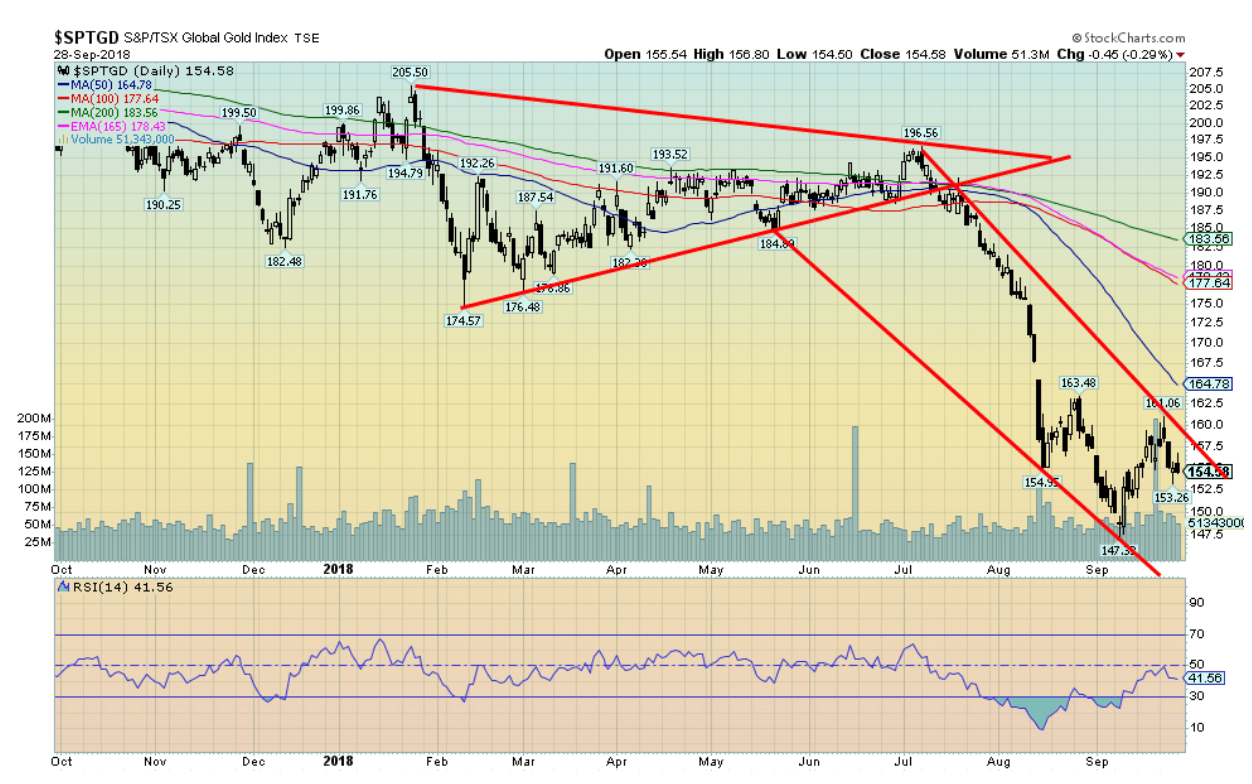
With gold prices weak this past week, and despite a good week for silver, the gold stocks as represented here by the TSX Gold Index (TGD) fell by 1.0 percent. The U.S.-based Gold Bugs Index (HUI) was also down, losing 1.3 percent. The TGD continues to outperform the HUI as it is only down by 21 percent in 2018 while the HUI is down 26.6 percent. The ratio the decline of the HUI to the decline of the TGD is 1.27 which is close to the yearly average of the U.S.-Canada exchange rate. The recent high for the TGD was at 161, short of a breaking out above the recent high of 163.48. The falling 50-day MA is seen at 164.78, so there remains considerable work for the TGD to do before we can say we are out of the woods. Sentiment remains absolutely atrocious, but that doesn’t seem to be doing the gold stocks any good as they can’t get a bid. However, it is not unusual that once a low is seen there is considerable backing and filling before a real rally gets underway. There have been times in the past that the bottom was a perfect V, but this does not seem to be one of those cases. Argumentatively, we could be forming an awkward head and shoulders bottom. But the key is that the TGD falls no further from these levels. A break under 152.50 would probably suggest new lows ahead. Above 160 and we become more encouraged.
© David Chapman
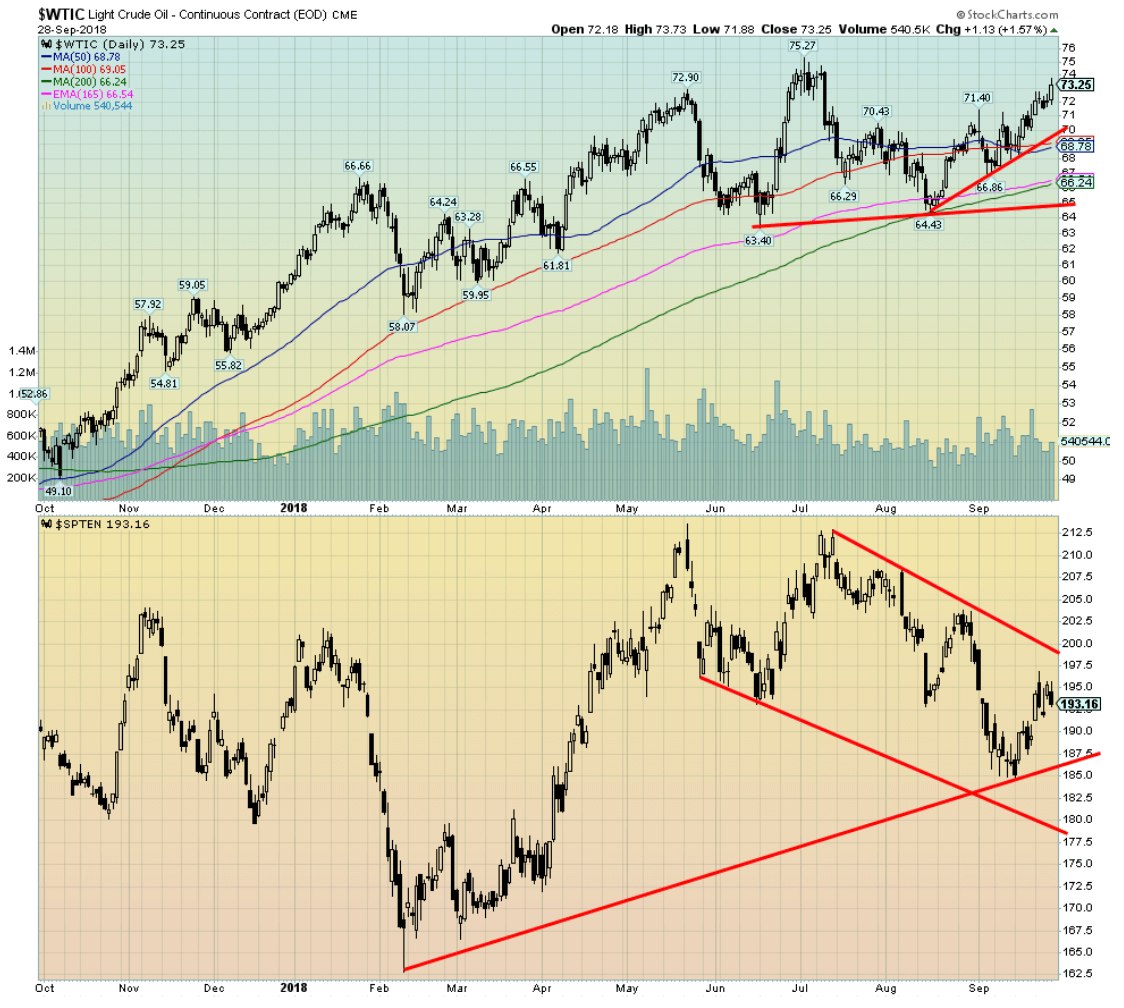
WTI oil prices rose to $73.25 this past week, posting a 3.5 percent gain. Given that WTI oil has taken out the high of $72.90 seen in May 2018, any thoughts of a head and shoulder top for oil are gone. Since August, oil has gained 13.6 percent. Only a break now below $70 might suggest that the rally is suspect. Major support can be seen down to $65. As we outlined in our opening essay, the threat of sanctions against Iran—coupled with Russia and Saudi Arabia making it clear that they are not about to boost production to offset any loss of Iranian oil—have helped push prices higher. Since 2016 WTI oil is nearing a tripling after bottoming at $26. Only the late June 2018 high of $75.27 remains.
So far, the energy stocks, as represented here by the TSX Energy Index (TEN), have not kept up. The TEN needs to take out the downtrend line currently at 200 and then take out the recent high near 203. Given the rise in WTI oil, it is unlikely now that energy stocks will fall. They eventually catch up to oil prices and even surpass oil’s gains. Energy stocks should prove to be attractive at these levels. Only below 188 might we question the rally. The bottom of the channel can currently be seen near 180.
Chart of the week
© David Chapman
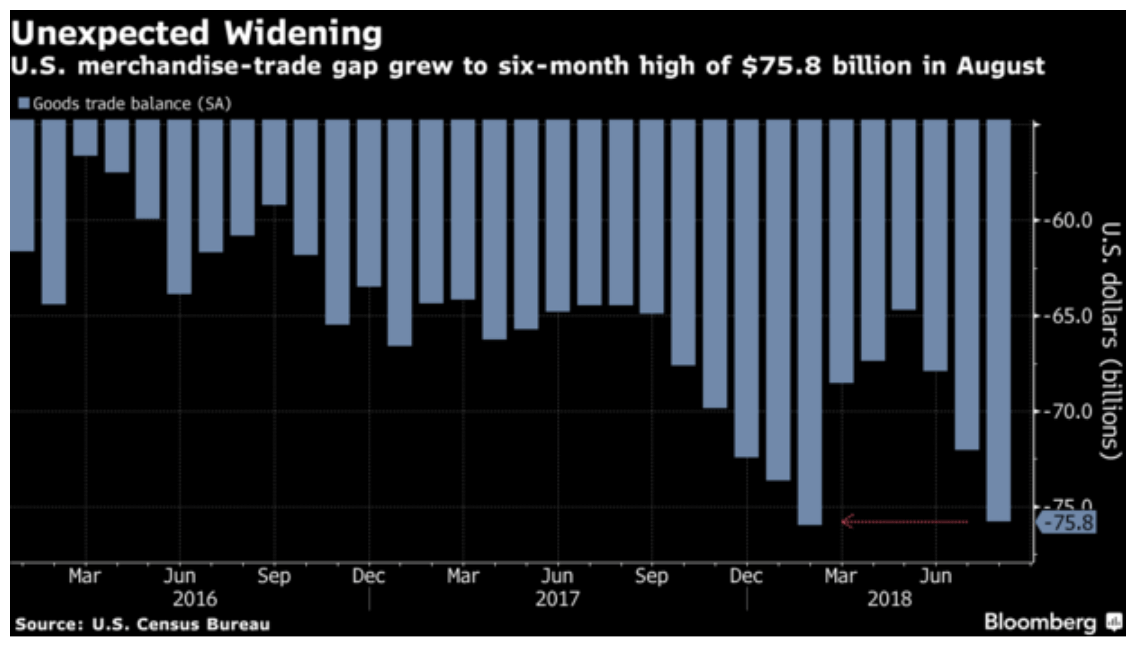
President Donald Trump is not going to like this. The U.S. merchandise trade deficit widened to $75.8 billion in August and, for the most part, it can be blamed on Trump’s widening trade war. The widening deficit is also threatening growth for Q3. It was the widest reported deficit in six months. It also underscored a revised $72 billion deficit reported for July 2018. No surprise that exports fell 1.6 percent and imports grew 0.7 percent from the previous month. The Census Bureau also reported that inventories, both retail and wholesale, grew in August as well and that may offset some of the widenings of the trade deficit.
Exports fell, primarily for agriculture, as the Chinese resisted buying American soybeans, farm feeds, and beverages. Meanwhile, American consumer purchases of foreign autos rose. The Chinese drop was 9.5 percent while foreign autos rose 3.2 percent. So, overall, this was a bad news report that is sure to get Trump’s accusations to rise. Some domestic economists described the report as “terrible.”
But the bad news on trade doesn’t stop with this report, as most numbers for global trade are showing a continuing contraction. The WTO has cut the outlook for global trade growth to 3.9 percent for 2018 and 3.7 percent in 2019. The previous forecast was for growth of 4.4 percent in 2018 and 4 percent in 2019. The WTO has made it clear that rising trade tensions are the biggest threat to global growth. Couple that with the tightening phase being carried out in the U.S., and it could prove to be a double whammy.
(All charts are courtesy of Stock Charts, Trading Economics, Stlouisfed.org and COT Price Charts.)
(Featured image by DepositPhotos)
—
DISCLAIMER: David Chapman is not a registered advisory service and is not an exempt market dealer (EMD). We do not and cannot give individualized market advice. The information in this article is intended only for informational and educational purposes. It should not be considered a solicitation of an offer or sale of any security. The reader assumes all risk when trading in securities and David Chapman advises consulting a licensed professional financial advisor before proceeding with any trade or idea presented in this article. We share our ideas and opinions for informational and educational purposes only and expect the reader to perform due diligence before considering a position in any security. That includes consulting with your own licensed professional financial advisor.


Youth Cannabis Use in Colorado Is Falling — But the Full Story Is More Complex
The 2026 Colorado survey shows teen cannabis use fell to 10 percent in 2025, down from 21 percent in 2015....


Morocco’s Growth Holds at 4.6% as Agriculture Offsets Economic Pressures
Morocco’s economy grew 4.6% in Q1 2026, driven by a strong agricultural rebound offsetting declines in industry. Services expanded moderately...


Abivax Shares Surge as New Trial Data Eases Safety Concerns Over Ulcerative Colitis Drug
Abivax shares surged nearly 36% after positive updated trial results for its ulcerative colitis drug obefazimod reassured investors following earlier...


El Dorado Raises $9M to Expand Cross-Border Fintech Platform
El Dorado, a Latin American fintech improving cross-border financial services, raised a $9 million Series A led by Paradigm with...


Bitcoin Stalls Near $60K as Strategy Moves, ETFs Outflow, and EU MiCA Rules Take Effect
Bitcoin hovers near $60,000 with ETF outflows, while Strategy boosts reserves, sells BTC, and raises dividends to reassure investors. Ethereum...
 |
|
 |  |
 |
|
-

 Fintech1 week ago
Mollie Expands Across EEA With €350M Investment to Strengthen European Payments Network
-

 Crowdfunding6 days ago
AI Venture Builder Launches €600K Crowdfunding Round to Scale Secure AI Solutions
-

 Impact Investing2 weeks ago
AI Adoption in Italian Retail Stalls Despite Strong Experimentation
-

 Cannabis2 days ago
Cannabis Dominates Global Drug Use: Trends, Risks, and Shifting Markets
You must be logged in to post a comment Login