Featured
Turkey heads for a financial collapse, US dollar soars
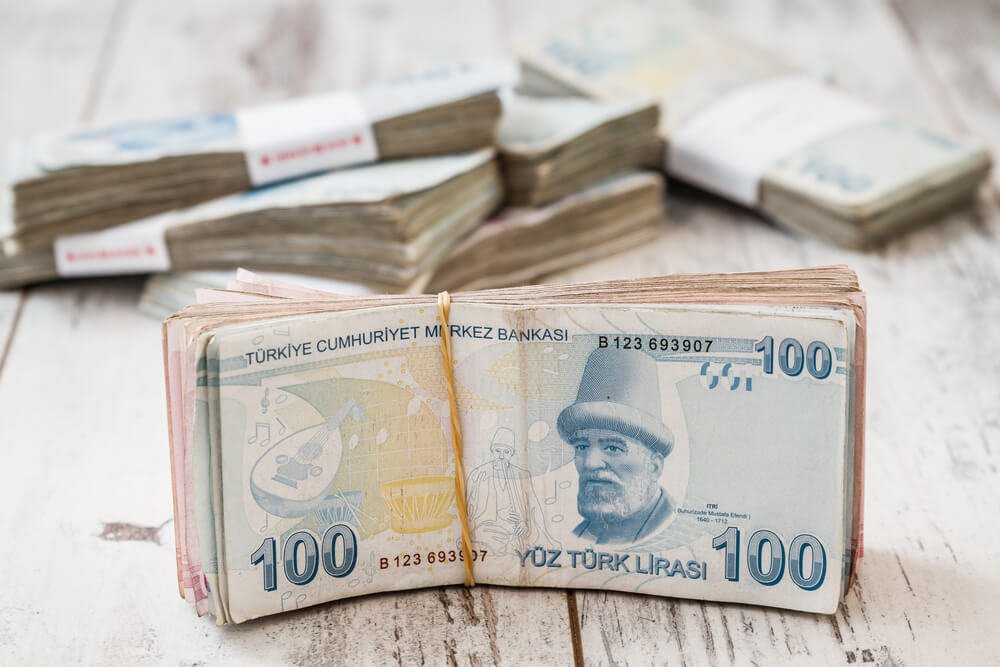
With the U.S. dollar soaring sharply and others such as Turkey’s lira falling, we are heading for another currency crisis.
“Every war has its main fronts and its romantic and often bloody sideshows…So it is with currency wars. The main battle lines being drawn are a dollar-yuan theater across the Pacific, a dollar-euro theater across the Atlantic and a euro-yuan theater in the Eurasian landmass. These battles are real but the geographical designations are metaphorical. The fact is, currency wars are fought globally in all major financial centers at once, twenty-four hours per day, by bankers, traders, politicians and automated systems–and the fate of economies and their affected citizens hang in the balance.” —Jim Rickards, “Currency Wars”
“While all currencies by definition represent some store of value, the dollar is different. It is a store of economic value in a nation whose moral values are historically exceptional and therefore a light to the world. The debasement of the dollar cannot proceed without the debasement of those values and that exceptionalism.” —Jim Rickards, “Currency Wars”
“The Treasury and the Fed resemble two drunks leaning on each other so neither one falls down. Today, with its 50-to-1 leverage and investment in volatile intermediate-term securities, the Fed looks more like a poorly run hedge fund than a central bank.” —Jim Rickards, “Currency Wars”
Jim Rickards published his book, “Currency Wars: The Making of the Next Global Crisis” back in 2011 as the currency wars were just getting underway. His timing was prescient. Rickards has been a lawyer, counselor, investment banker and risk manager. He advised the U.S. Department of Defense, the U.S. intelligence community, and major hedge funds, including acting as general counsel for the ill-fated Long-Term Capital Management, the hedge fund that almost brought down the global financial system in 1998. Rickards has interesting and controversial views. Some of his other books include “The Death of Money: The Coming Collapse of the International Financial System,” “The New Case for Gold,” and “The Road to Ruin: The Global Elites Secret Plan for the Next Financial Crisis.” Rickards has made many predictions, none/most of which have not come true—yet.
This is not to debase Rickards. Just because his predictions haven’t come true doesn’t mean they won’t happen. He has absorbed considerable criticism for his views. But nobody paid any attention to the soothsayer who told Caesar to beware the Ides of March. In looking around, we see numerous signs of an impending global financial crisis. The current crisis in Turkey comes immediately to mind.
We have covered some of this ground before, but it is worth repeating. Currency wars have happened before. In 1971, when Richard Nixon imposed price controls and took the U.S. off the gold standard, he set in motion a decade-long decline of the U.S. Dollar. The first currency war got its start in 1921 when Germany, following WW1, was forced to devalue the Deutsche mark. That devaluation ended badly with wheelbarrows full of paper money that couldn’t buy a loaf of bread. But competitive devaluations took off in the 1920s, and by the 1930s, the currency wars were in full throttle. Britain abandoned the gold standard in 1931, and the U.S. devalued the U.S. dollar in 1933 when it raised the price of gold to $35 from $20.67.
Currency war two really got underway in the late 1960s when Britain devalued the Pound against the U.S. Dollar. France and some others took their U.S. dollars to the U.S.’ gold window that promised under Bretton Woods to redeem U.S. dollars for gold at $35. The U.S.’ gold reserves plummeted from 20,000 metric tonnes to under 9,000 metric tonnes. Nixon took the world off the gold standard in August 1971, effectively defaulting, and the U.S. dollar plummeted. Gold soared from $35 to $875 by 1980.
Now, according to Rickards, currency war number three is underway as China and Russia, in particular, are challenging the global supremacy of the U.S. dollar as the world’s reserve currency. Quantitative easing (QE) by the Fed helped lower the value of the U.S. dollar and gold soared to over $1,900 by 2011. Then others started devaluing as well and, while it takes time to build, we are now potentially on the cusp of another currency crisis.
The U.S. dollar is soaring and that is not sitting well with President Trump who wants a lower U.S. dollar to help U.S. exports. Trump has criticized the Fed about its hiking of interest rates and ending QE and starting quantitative tightening (QT) as the Fed tries to unwind its huge $4 trillion-plus balance sheet full of mortgage-backed securities (MBS) and other debt instruments purchased during QE. The claim that the Fed’s balance sheet looks more like a hedge fund is not far from the mark.
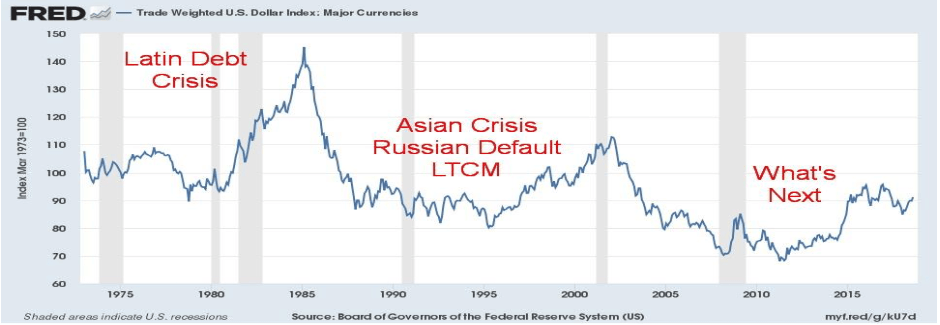
A sharply rising U.S. dollar has caused debt crises in the past. Previous periods of a sharply rising U.S. dollar were 1978–1985 and 1995–2000. The sharply rising U.S. dollar puts considerable pressure on U.S. dollar debt in emerging economies. The problem is emerging economies are too susceptible to borrowing in U.S. dollars. Except their earnings are in their home currency. When their currency collapses, the U.S. dollar debt becomes untenable and default invariably follows. John Johnson, EVP & Chief Strategist of Davis Rea, is someone whose views blend well with ours. So, it is no surprise that Mr. Johnson wrote in his recent insights on emerging market debt and Turkey. He noted how a sharply rising U.S. dollar contributed to major debt crises, including the Latin American debt collapse of the 1980s and the Asian Contagion/Russian default/LTCM collapse of the 1990s.
© David Chapman
As Rickards has noted, the current currency wars and a bull market in the U.S. dollar got underway in 2010 following the 2007–2009 financial collapse. The rising U.S. dollar is once again causing havoc in emerging markets. It is a question of who and when, not who and if another debt collapse gets underway.
The U.S. dollar is also not being helped by Trump’s tariff wars and sanctions against numerous countries. Nor is strife in the EU between Italy and the EU that could negatively impact EU banks helping either. Investors are fleeing the EU and the Euro and buying U.S. Dollars. The Euro makes up 57.6 percent of the US$ Index. China is devaluing the yuan to combat Trump’s tariffs. The Turkish lira is collapsing because of U.S. sanctions.
But it is not just the Turkish lira falling. So is the Iranian rial and the Russian ruble. The Venezuelan bolivar has also collapsed, thanks to economic mismanagement and sanctions. Compiling a list of who the U.S. has sanctioned or imposed tariffs is becoming lengthy. Countries under sanctions include Iran, North Korea, Syria, Sudan, Cuba and Venezuela. Numerous individuals in many countries have had sanctions applied against them. They include Russia, Iraq, Lebanon, Libya, Yemen, and many more. Many of the countries that the U.S. has sanctioned have seen their currencies collapse. A number of these countries are also being battered by internal strife and war. The U.S. has imposed tariffs against China, Canada, the EU, and Mexico. In return, they have imposed retaliatory tariffs on the U.S.
Collapsing currencies and countries with loans outstanding in U.S. dollars are beginning to cause real pain. There is the potential for a major debt crisis in China that could bring down Chinese banks because of loans denominated in US$. But at least China with PBOC, China’s central bank, has the wherewithal to support their financial system. Many others do not.
And herein lies the rub as those loans could default, potentially triggering a global financial crisis and the countries negatively impacted by sanctions and collapsing currencies could retaliate with unintended consequences. This past week five nations surrounding the Caspian Sea signed a diplomacy agreement in an attempt to counter economic attacks by the U.S. They include Russia, Azerbaijan, Iran, Kazakhstan, and Turkmenistan.
Russia has warned that further sanctions and an attempt by the U.S. to impede banking operations and currency movements would be a declaration of economic war and bring a response both economically, politically and, as they stated, by other means if necessary. China has warned U.S. warships in the South China Sea to “leave immediately and keep out.” North Korea is not really showing any intention of denuclearizing. Iran has signaled they are prepared to block the Straits of Hormuz where one-third of the world’s oil passes if Iranian oil is blocked. Currency wars, sanctions, and tariffs are threatening to turn into real wars and real confrontations.
Given the potential for a debt crisis coming from emerging markets, a question that remains open is: What if the currency crisis hits even better managed emerging economies? As Johnson points out, two are India and Chile.
The first in line headed for financial collapse could well be Turkey. A financial collapse in Turkey would be no picnic. Turkey is the world’s 17th-largest economy on a nominal basis and the 13th-largest by Purchasing Power Parity (PPP). It is a leading producer of agriculture, textiles, motor vehicles, transportation equipment, and more. While Turkey is described as an emerging market economy, in the world arena, it is anything but, being a member of the G20 and of NATO. They have artificially kept interest rates low which is exacerbating the current currency crisis. Their economy has relied heavily on foreign loans, many denominated in US$. EU banks hold many of the Turkish loans so a financial collapse in Turkey could easily spread to the EU. It has one of the largest current account deficits in the world. They need capital inflows and their currency reserves are being run down.
Since their crisis has been underway the Turkish lira has collapsed against the US$. Their stock market is down over 50 percent in 2018, including 25 percent down since the beginning of August. The country is rife with crony capitalism. Yet their President Recep Erdogan has had thoughts of the revival of the Ottoman Empire that existed between 1299 and 1922. The collapse of the Ottoman Empire after WW1 helped trigger the major changes in the Mid-East that continue to plague the world today in Israel/Palestine, Iraq, Syria and Lebanon.
Turkey has an estimated external debt of some $321 billion. Most of it is denominated in U.S. dollars, but some $119 billion is in Euros with a small amount ($6 billion) in Japanese Yen. The banks on the hook for this debt include banks in France, Spain, Italy, Japan, the U.K. and the U.S. Spain’s exposure is about 2 percent of total bank assets, not particularly large. Italian banks, on the other hand, are already burdened with bad loans estimated at around $200 billion or 12 percent of total loans. Greek banks are in the worst shape at around 47 percent of total loans currently nonperforming.
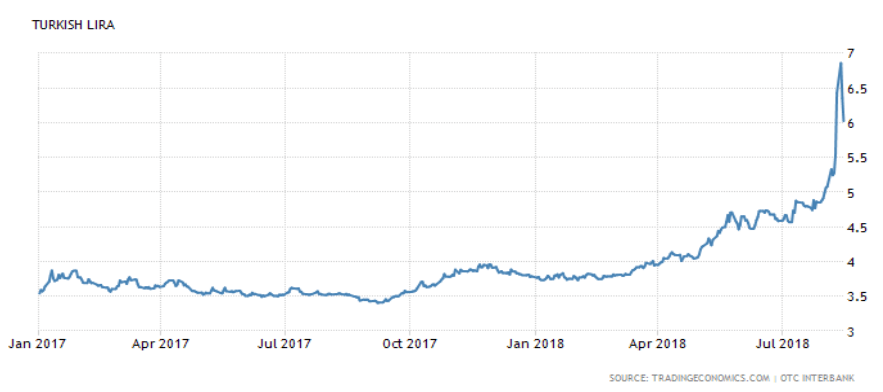
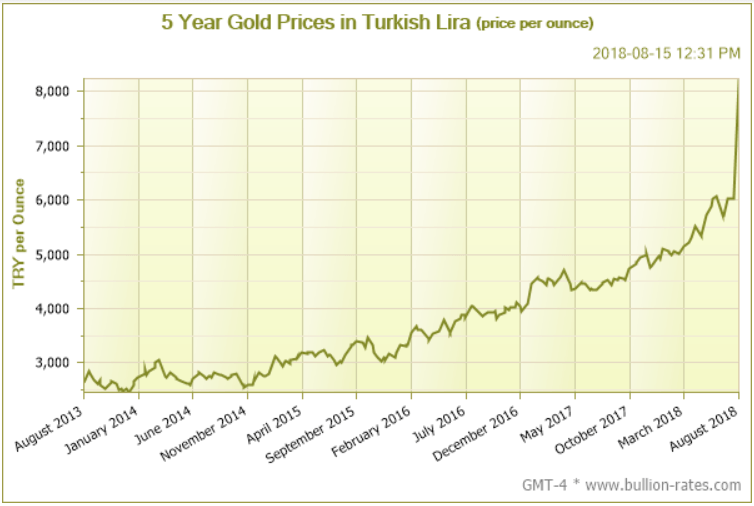
The crisis in Turkey is already spreading as global stock markets are falling, and investors are fleeing other emerging markets by selling assets. Other currencies such as the Argentinian peso, the South African rand, the Indonesian rupiah and the Russian ruble are also being hit. Meanwhile, the US$ soars as there is a flight to safety in U.S. Treasuries, and gold is plunging because of the sharply rising US$. But gold is only plunging in US$ as it is rising sharply in the collapsing currencies. Below is a chart of the Turkish lira and one of gold in Turkish lira.
© David Chapman
© David Chapman
The chart of the Turkish lira reflects what US$1 would buy. That explains why the chart is rising. Turkey’s retaliation against the U.S. by boycotting cars and electronics and placing high tariffs on them has actually helped the Turkish lira in the last few days as it has recovered some ground.
The crisis in Turkey could spark a financial crisis at a minimum along the lines of the Asian contagion of 1997 or even the Russian/Long-Term Capital Management collapse in 1998. At worst, a financial collapse in Turkey could spark a crisis akin to the financial collapse of 2008 as it spreads first to the EU and then eventually to the U.S. A financial collapse in one country could also spark a financial collapse in other countries such as Argentina or Italy.
Erdogan of Turkey, who fancies himself as the next Sultan of the Ottoman Empire, has some means to get out of this mess but is unlikely to take it. First, he’d have to hike interest rates to very high levels. But his next steps might be even more drastic as Turkey could threaten to leave NATO and hook up with the BRICS. It has been suggested by Russia that, to get around sanctions/tariffs, they settle bilateral trade deals with Turkey, Russia, China and Iran in lira, rubles, yuan and rials. The purpose, of course, would be to get around U.S. sanctions and operate outside of the U.S.-dominated financial institutions. Interestingly, the U.S. has threatened sanctions against Russian banks, an act that Russia would consider akin to an act of economic war.
Qatar has offered a $15 billion investment in Turkey, which, apparently, Turkey is accepting. That has helped steady the falling Turkish lira. An IMF bailout is unlikely because of the strings that would be attached. The IMF is dominated by the U.S., the very country that Turkey is fighting with over sanctions, tariffs, and even war. Turkey remains in conflict with the Kurds who continue to draw support from the U.S. Turkey also maintains territorial ambitions beyond its borders into Syria. China would have the wherewithal to help Turkey. That would, most likely, draw even more ire from the U.S.
The world may be entering a more serious crisis phase. A Turkish collapse would be far more serious globally than one in Greece or even Argentina. It is not just EU banks that are heavily involved in Turkey but also wealth funds and others. High-interest rates in Turkey were attractive given a relatively stable currency. That is no longer the case. As we noted, a Turkish collapse would spread first to the EU, and then eventually to the U.S. That is how contagion works. We have seen this picture before in 1997, 1998 and 2008. The ability of the world’s central banks to bail out the global financial system no longer exists. Bailouts have been turned into bail-ins. Depositors would pay the price.
The U.S. dollar is benefitting considerably in the early stages of this crisis. But given Trump’s desire for a lower U.S. dollar and veiled threats against the Fed, that could change. A solution might be a huge currency re-set using gold. The U.S. still has the world’s largest gold reserves, and there is a precedent for a gold re-set when Roosevelt revalued gold upward in 1933, a de facto devaluation of the U.S. dollar. But we are a long way off from that happening, if it ever happens at all. In the end, that might just be fanciful thinking even if it is an interesting thought.
Global co-operation is breaking down. We live in a multipolar world. The post-WW2 world began its breakdown when Richard Nixon effectively killed Bretton Woods and took the world off the gold standard. The world has gone through many ups and downs since then. But one thing has been constant—debt growth, now at a staggering $247 trillion globally. Recessions and depressions are all about debt collapse, and the next one promises to be bigger than all the previous collapses. And currency wars are at the heart of the problem in a “beggar thy neighbor” world.
Bitcoin watch
© David Chapman
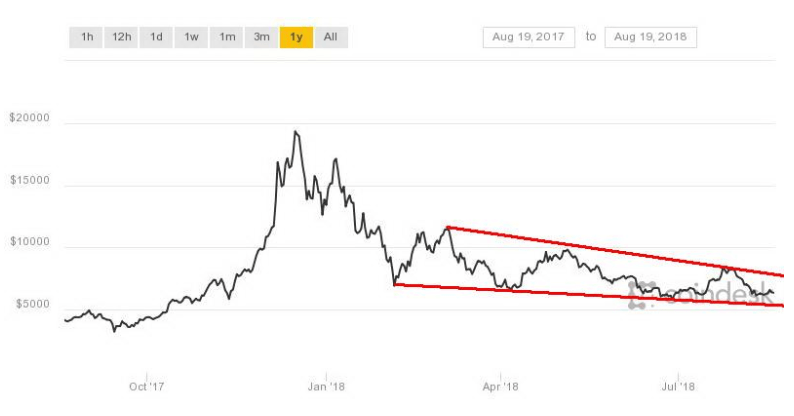
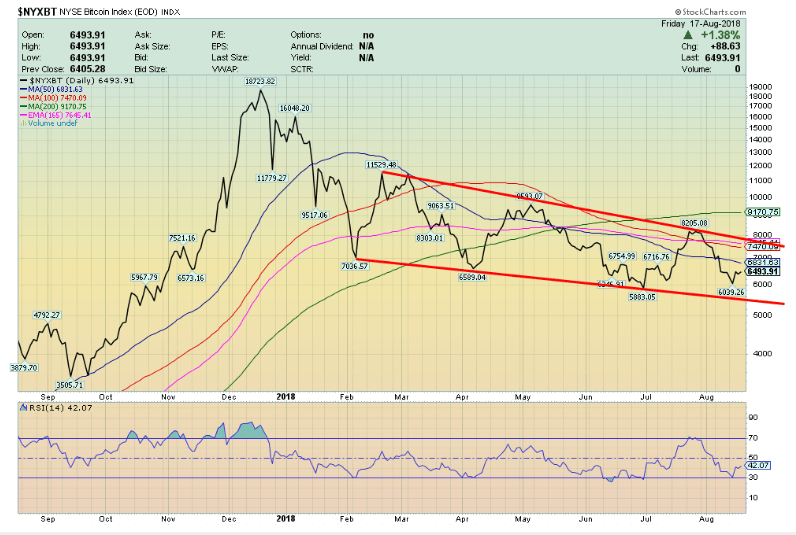
We can’t quite say that the recent short-term rally for Bitcoin is over. For the second week in a row, we are holding around $6,400 after dipping briefly under $6,000. The failure to hold at $6,800 destined a test of $6,000. Below $6,000, and especially under $5,800, we should fall toward $5,000. To put the recent rally back in play, we’d need to regain back above $6,800.
While Bitcoin (BTC) has been relatively flat this past week, other large cryptos have not been so lucky. Ethereum (ETH) is off, over 17 percent while Bitcoin Cash (BCH) and EOS (EOS) have fallen 10 percent or more. The market cap of all cryptos is $212 billion, down sharply from the $274 billion we reported two weeks ago. There are now only 15 cryptos with a market cap in excess of $1 billion. That’s down from 18 two weeks ago.
But the number of cryptos just continues to proliferate. According to Coin Market Cap, there are 1,855 listed vs. 1,752 two weeks ago, an astounding jump of 103. Some new ones we spotted were BigONE Token (BIG), Bitcoin Instant (BTI), Rocket Pool (RPL), and Birds (BIRDS). The imagination boggles. The number of dead coins listed at Dead Coins has not gone up a lot, rising to 900 from 889 two weeks ago. Dead coins are hacks, deceased, parodies, and outright scams that are no longer listed.
What we find amazing is, no matter how many new cryptos get listed every week and no matter what stories of scams, etc., continue and regulators continue to hover, the number of bullish articles we read continues to outnumber negative articles. We are frankly baffled as to how some listings can exist when probably only a few are ever going to be remotely successful. The blockchain technology is here to stay, but the proliferation of different coins is just confusing, especially to anyone thinking of entering the sphere—as in “which one are we to choose?” We don’t have the answer.
© David Chapman
The pattern forming on Bitcoin could be a descending triangle given the series of lower highs being made. What is needed is a break to the downside. That would come with new lows under $5,800. Resistance now appears up to $8,400.
Markets and trends
Note: New highs/lows refer to new 52-week highs/lows. © David Chapman
© David Chapman
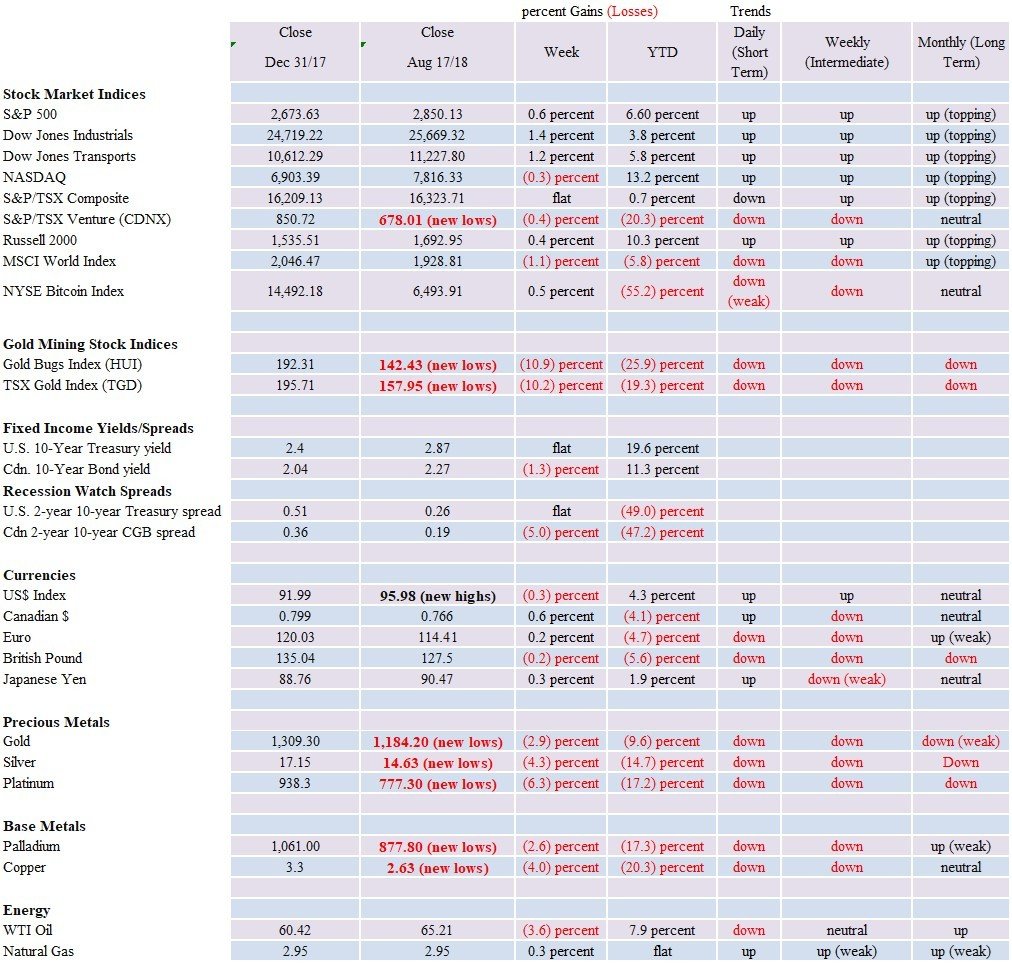
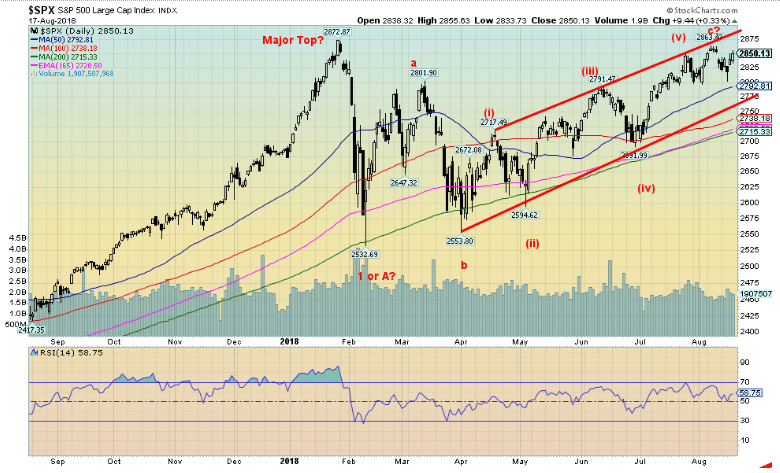
It was a quite a week, starting out as it did with thoughts that Turkey might collapse. But by Wednesday, those thoughts were shoved aside and the market got excited because the U.S. and China said they would discuss tariffs and their relationship. In the end, talk-talk or jaw-jaw works better than war-war. So, the market turned on its heel and shot right back up once again. As of the close on Friday, the S&P 500 is a mere 0.8 percent away from its all-time high seen back in January. In many respects, it would not be surprising to see new all-time highs.
The S&P 500 gained 0.6 percent this past week, despite the rough start, and is up 6.6 percent on the year. The Dow Jones Industrials (DJI) did even better, jumping 1.4 percent, but it is only up 3.8 percent on the year. The Dow Jones Transportations (DJT) also did well thanks to lower oil prices, rising 1.2 percent and leaving it up 5.8 percent on the year. The tech-laden and FAANG-laden NASDAQ was not as successful, losing 0.3 percent but remains the star on the year up 13.2 percent. The Russell 2000 (small cap) continued its winning ways, gaining 0.4 percent and remains up 10.3 percent on the year. Happiness all around.
It also doesn’t hurt that economic numbers continue to be fine. Retail sales continue to hum along and business confidence continues to grow. But real retail sales show flat growth. No matter—the market focuses on the nominal. Turkey’s problems are there, but Qatar helped out, stabilizing their currency. For now, anyway. But the rot is underneath as we discussed in our essay, and odds favor the crisis to storm again.
Elsewhere, stock markets were not quite as good as the U.S. Canada did fine as the TSX Composite was at least flat on the week and is up a small 0.7 percent on the year. But it is being dragged down by the poor performance of the Materials. And speaking of Materials, the TSX Venture Exchange (CDNX) continues to the be the “dog,” losing another 0.4 percent and is down 20.3 percent on the year. Overseas, the markets were not so great. The global MSCI Index lost 1.1 percent and is now down 5.8 percent on the year, the Chinese Shanghai Index (SSEC) was off 3.2 percent and languishes down 18.2 percent on the year, the Paris CAC 40 lost 1.3 percent but clings to a 0.6 percent gain for the year, the German DAX lost 1.2 percent and is down 5.5 percent on the year, while the Tokyo Nikkei Dow (TKN) was off 0.1 percent and is down 2.3 percent on the year. Brexit fears hit the London FTSE and it fell 1.4 percent, pushing it into the red for the year off 0.4 percent.
So, the U.S. is doing well, but the rest of the world is not doing so hot. We’d be concerned about the rest of the world as what hits it will eventually hit the U.S. as well despite the soaring confidence in the U.S. economy. Complacency has a way of getting its teeth knocked out. Major support is down around 2,775 and again at 2,700. A breakdown could get underway if the S&P 500 breaks under 2,800.
© David Chapman
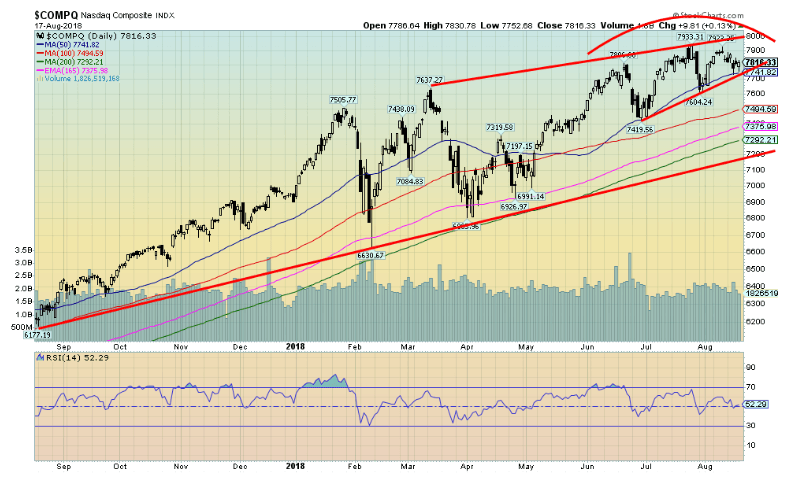
The tech-laden/FAANG-laden NASDAQ closed down on the week and is now off 1.5 percent from its all-time high. Compare that to the S&P 500 that is off its all-time high by only 0.8 percent. But the divergences get more interesting when we compare them to the DJI. The DJI is actually off 3.6 percent from its all-time high. This is a divergence we shouldn’t ignore because while the S&P 500 and even the NASDAQ might make new all-time highs again the DJI might not. For the record, the DJT is off by 1.7 percent from its all-time high. All within shouting distance of new highs. There is a possibility that the NASDAQ has made a small double top here 7,933 and 7,922. A breakdown under 7,740 might signal a top is in. Initial support would come in around 7,500. The double top would suggest a decline to around 7,400.
© David Chapman
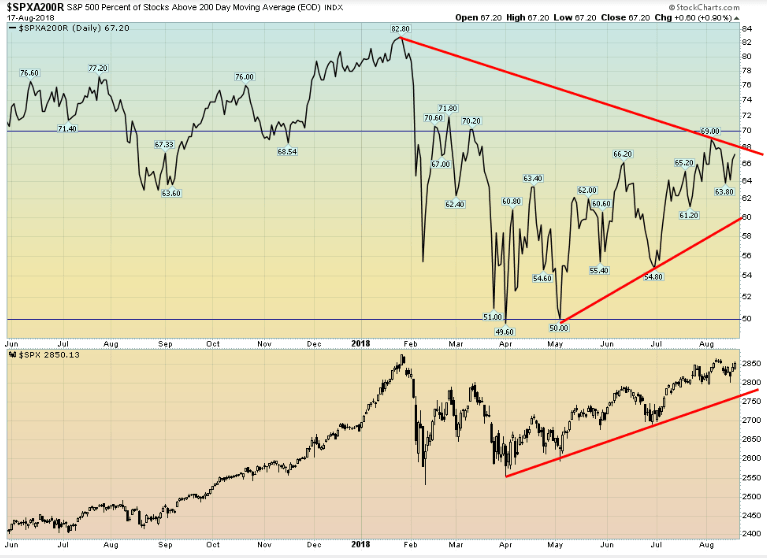
This is the chart that is telling us that the recent rally to almost new highs is actually quite narrow. We suspect the FAANGs are playing a role. This is a chart of the percent of stocks in the S&P 500 that are trading above the 200-day MA. At the January peak, 82.8 percent of the stocks were above the 200-day MA. Now, it is only 67.2 percent yet the S&P 500 is a mere 0.8 percent from its all-time high. Narrowing advances like this are what we would expect in a secondary rally back to the highs (and even new highs)—meaning the rally is narrower in scope than what was seen in January 2018. Yet another warning sign that this market is not as healthy as some people would like to think it is.
© David Chapman
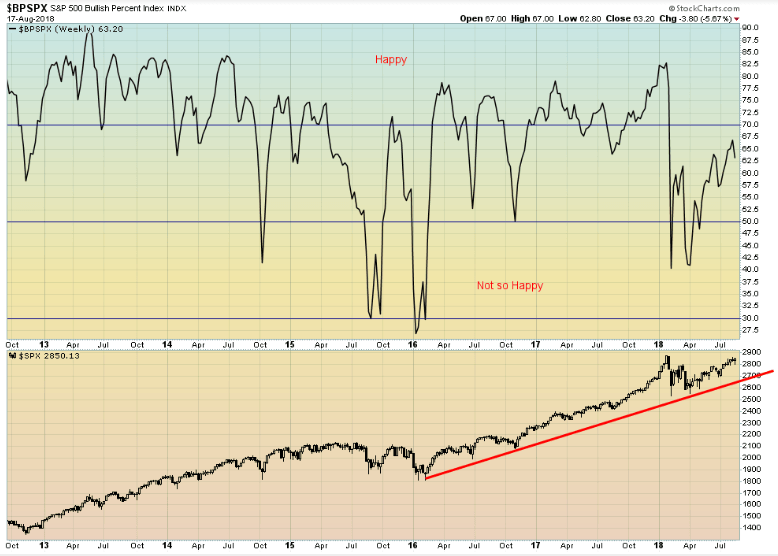
Similar chart, same picture. This one is the S&P 500 bullish percent index. At 63.2 percent, it lags well below the 82.5 percent seen in January 2018, yet as we note we are only 0.8 percent from that January 2018 high. The market at best is lukewarm. Definitely not happy, but also not unhappy.
© David Chapman
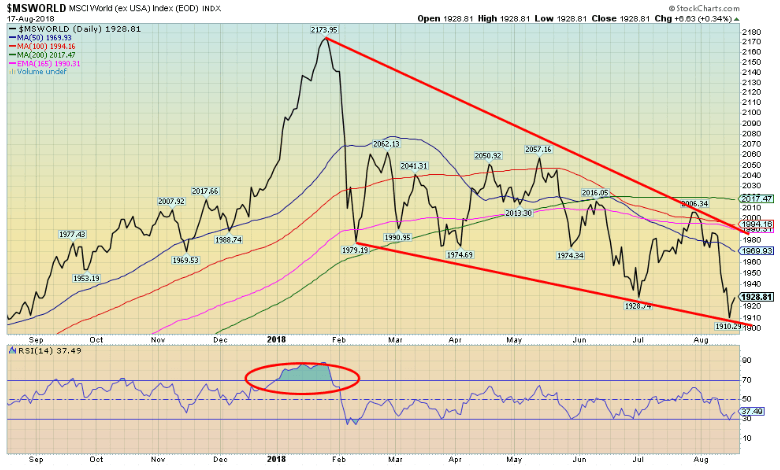
We consider the MSCI World Index a warning sign. It is an index comprising the rest of the world beyond the U.S. While the U.S. indices hover near their all-time highs, the rest of the world is not doing as well. And so it should not. Turkey, emerging markets, high debt levels, Brexit, shaky EU banking system, wars, and more are taking their toll outside the U.S. It almost seems as if the U.S. lives in its own little bubble. Here the MSCI Index is trading below its 200-day MA, suggesting it has already entered a bear market.
© David Chapman
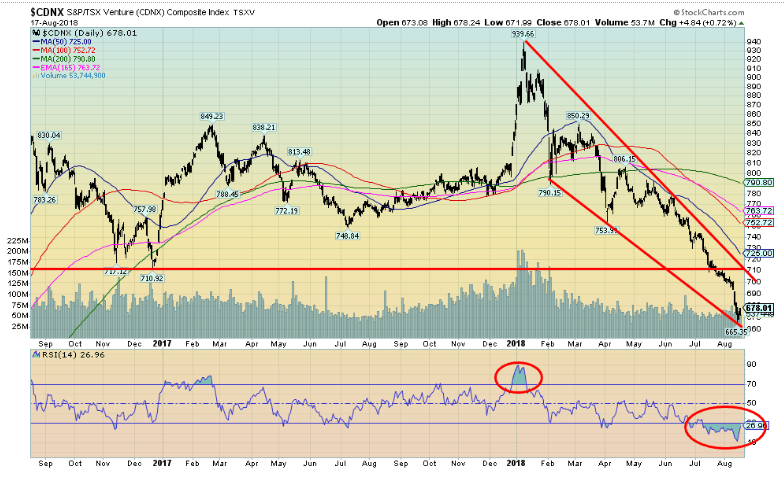
This is a miserable chart. That’s the bad news. The good news is it is so oversold, and everyone hates the TSX Venture Exchange (CDNX) so much that these set up the conditions for a possible powerful rally. As of the close on Friday, the CDNX is down 28 percent from its high seen last January. That constitutes a bear market. As we have noted in the past, the CDNX has a long history of wild swings both up and down. This is just the latest iteration. At least some good news as the close on Friday is actually up 45 percent from its all-time low seen in January 2016. Predictably, volume has collapsed on the downward march. It is typical that when the selling comes, the stocks just go no bid, forcing the sellers to take what they can get. That also helps the rallies as typically the market goes no offer and buyers have to grab what they can get. That helps propel the sharp ups and downs. The CDNX is roughly 50 percent junior mining stocks with the other 50 percent in energy, high tech, and other sectors. But it is also the source of companies that eventually move to the TSX and on to bigger and better things. And that makes it too important to just ignore.
© David Chapman
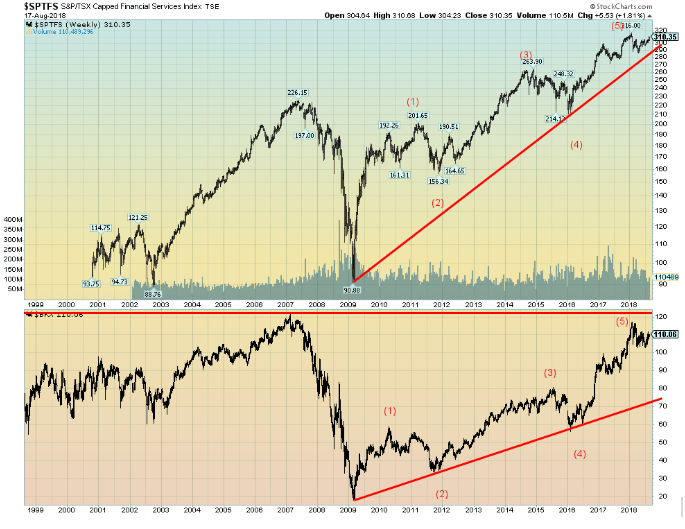
It is worthwhile keeping one’s eye on the financial stocks. It is an understatement to say they are important to the economy. Interestingly, the Canadian TSX Financial Index (TFS) hit all-time highs, well above the highs seen in 2007. But the KBW Banking Index (BKX), a key banking U.S. banking index, is still below its all-time highs seen in early 2007. Both appear to have completed five waves up from the depths of the 2007–2009 financial collapse.
That financial collapse was interesting in that the banking industry was effectively behind the housing/mortgage bubble and when it collapsed the banks came running, cap in hand, to the monetary authorities and said, “Help! Save us from our stupidity.” The monetary authorities led by the Fed and the U.S. Treasury obliged, and what took place was the biggest bailout in history. After all, it’s okay to allow thousands of hapless homeowners to go bankrupt, lose their homes, and maybe even their jobs, but it is not okay to allow hundreds of high net worth investors, pension funds, and other large pools of funds to go under, thus jeopardizing the financial elite and stability of the country as their bank stocks become worthless. The taxpayer who funded this charade has, after all, deep pockets. But then they changed the laws and it is now depositors who are at risk. The bailout has been changed to bail-in. To pen an old saying, “what’s in your wallet?” Beware. In the next financial collapse, it will be your wallet that’s taken.
© David Chapman
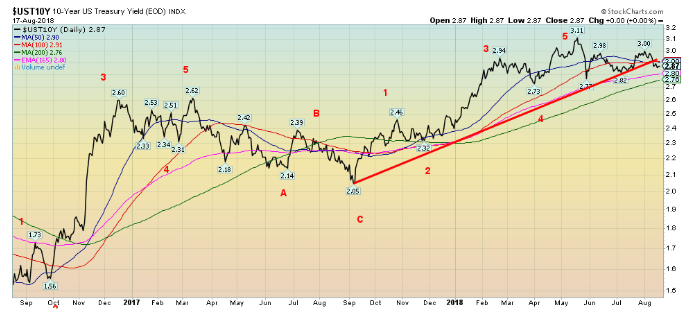
With all of the concern over Turkey and the potential for contagion and the shaky EU banks, the rush was to the safety of U.S. Treasuries. That, in turn, helped propel the U.S. dollar higher, and while the 10-year U.S. Treasury note didn’t rally this week, the yield remained unchanged to 2.87 percent. It has broken the uptrend line from the September 2017 low, and our expectations are that it will eventually test the 200-day MA near 2.75 percent. The caveat is if the 10-year can regain back above 3 percent then it might make another attempt on the recent high at 3.11 percent. But we are suspecting the high is now in. It fell short of our original target of 3.20 percent. The trend appears to have shifted to lower interest rates—at least at the long end of the curve. With the Fed continuing its tightening phase that is what helps narrow the spread between the short and long end of the interest rate curve.
Recession watch spread
© David Chapman
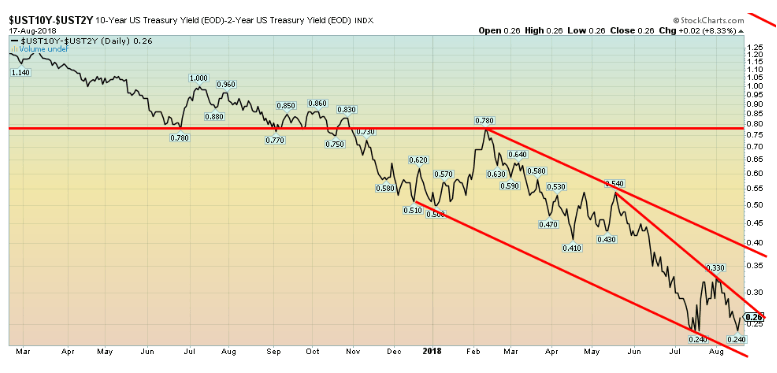
The U.S. 10-year Treasury note was unchanged this past week and so was the spread between the two-year and 10-year or what is euphemistically known as the 2–10 spread. At 26 bp, it is still well above turning negative. In the past, a period of least six months of a negative 2–10 spread usuallsignaleded a recession. With the U.S. economy continuing to do well and largely outperforming the rest of the world, it encourages capital flows into the U.S. and out of other countries. But the Fed is forced to hike interest rates to combat rising inflation. And rising interest rates and an outperforming economy help propel the U.S. dollar higher. We continue to believe it will be sometime in 2019 before the 2–10 spread turns negative.
© David Chapman
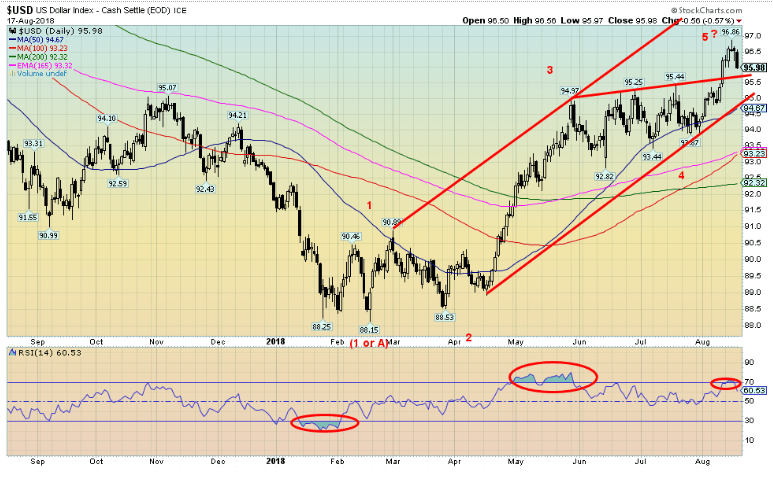
The US$ Index hit a 52-week high this past week at 96.86. The rising or ascending triangle that formed between May 2018 and July 2018 suggests the US$ Index could rise to around 98 to 98.25. Propelling the US$ Index higher is the potential for an economic collapse in Turkey with the Turkish lira hitting record lows, the potential for contagion from a Turkish collapse that would negatively impact primarily EU banks before the contagion spreads into other sovereign nations and potentially into the U.S. as well. The US$ Index is made up of 57.6 percent Euros. A weakening Euro weighs heavily on the US$ Index. No, the Turkish lira is not a component of the US$ Index but it is a component of a broader US$ Index that is reported by the Fed. Other components of the US$ Index are the Japanese yen, the Swiss franc, the British pound, the Cdn$ and the Swedish krona. The Chinese yuan is not a component.
The US$ Index had its worst weekly performance in a month this past week, losing 0.3 percent. The euro, the Cdn$, and the yen were all up on the week. The Cdn$ benefitted from a higher inflation number, suggesting that the BofC will have to hike interest rates next month. The weak sister this past week was the British pound, falling just under 0.2 percent as fears gripped the market that Brexit will fail and the U.K. will then go with a hard Brexit. The late week announcement that the U.S. and China were going to sit down and talk about their trade issues helped push the US$ lower and into negative territory for the week after hitting a new 52-week high at 96.86. We’ll see if there is any downside follow-through this coming week or will it recover and run to the targets we are potentially looking for.
One thing longer term in favor of a weaker US$ is that President Trump is not a fan of a strong dollar as he wants to push U.S. exports. A high US$ puts a damper on exports and encourages imports—the opposite of what he wants. He has made veiled threats at the Fed concerning their hiking of interest rates and ending quantitative easing (QE) and replacing it with quantitative tightening (QT) as the Fed unloads its bulky portfolio. As a counter to the US$ falling on Friday, the Chinese yuan rose. The Turkish lira may not fare as well. While it steadied following Qatar’s $15 billion loan, the U.S. is threatening more sanctions and that will up the economic warfare with Turkey and probably push the lira lower again. Further losses for the US$ Index could be seen under 95.50/95.60. A more serious breakdown could get underway under 95. Key could be how the China/U.S. trade talks play out. And if Trump keeps silent about the Fed’s policies. The latter could be difficult.
© David Chapman
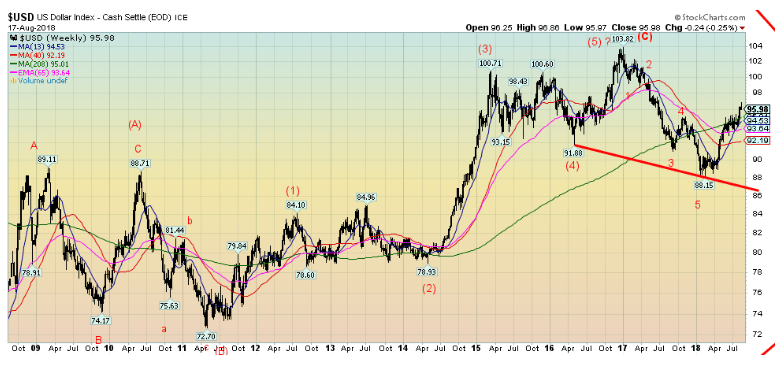
Here is a bigger picture of the US$ Index. The US$ Index has been in a bull market since bottoming back in 2008. The question on our mind is, has the US$ Index made its final high at 103.82 or is the current rebound going to test that level? The decline from 103.82 to the 88.15 low appeared to unfold in five waves down, suggesting to us that the US$ Index has topped. The current rebound then is a corrective wave. We admit it could test all the way back to or at least close to the 2016 high. It is also baffling that it appears to be rising in five waves rather than a corrective ABC type of wave. Still, we believe the January 2016 is the final high for this run, but until the US$ Index turns down again there remains the possibility of revisiting that high. The breakdown zone doesn’t come until under 92 on the weekly charts.
© David Chapman
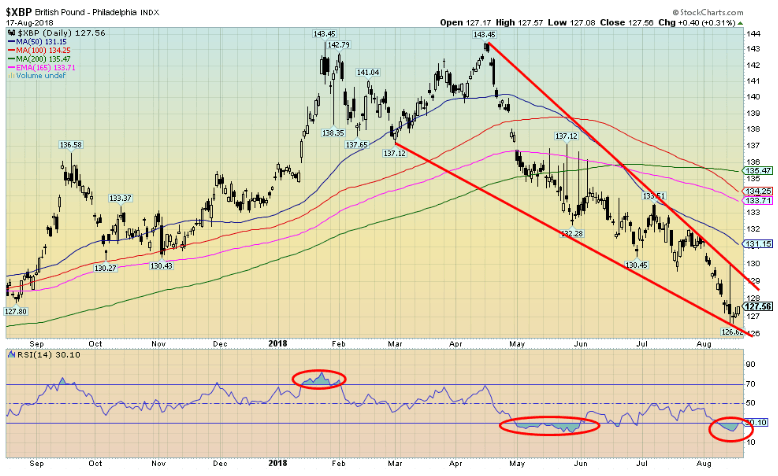
The potential for a hard Brexit is playing havoc with the British pound. According to most economists, a hard Brexit will not be very good for the British economy and therefore it won’t be good for the pound either. The pound is currently oversold with the RSI under 30, so a bounce might be possible here. There is considerable resistance up to 129, and then again up to 131. This is not a chart that engenders confidence and the background news on Brexit is not friendly. At best, all we see is the potential for an oversold bounce. Based on the double top at 143.45 the latest target was at 126.87. The low this week was at 126.62. Another reason for a possible bounce at this point. But if the recent low can’t hold, the next target is down to 120.55. The pound needs to regain above 135 to suggest that it might challenge the 143.45 high. Given the background news, that is unlikely.
© David Chapman
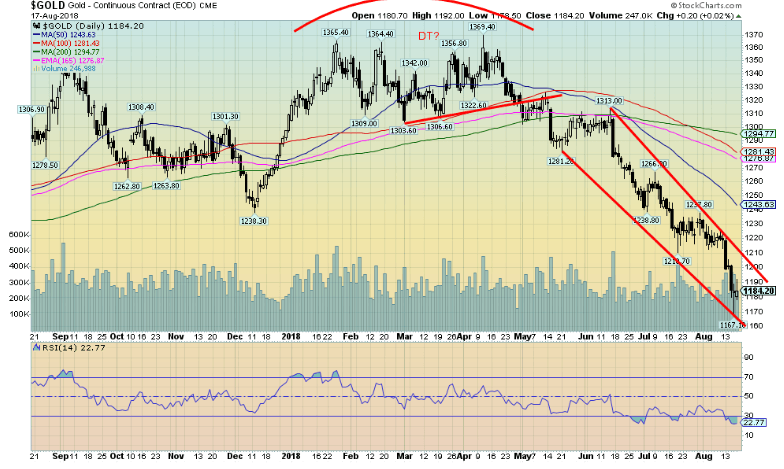
Panic gripped the precious metals markets this past week as gold broke down under $1,200. Spurring gold lower was the strong US$ pushed higher by capital flows coming primarily from the EU as money flees the possibility of contagion from a collapse of the Turkish economy. The prime holders of Turkish debt are EU banks, much of it denominated in US$. The low, so far, is seen at $1,167. The absolute drop-dead line for gold is seen at $1,125. Below that level, there is the potential to test the December 2015 low of $1,045 and even dip under $1,000. Gold, along with silver, platinum, and palladium, as well the gold stock indices, all hit new 52-week lows this past week. The sentiment is as miserable as it was at the December 2015 low. The RSI has been trading off and on below 30 for the past few weeks. Readings for the RSI under 30 is a sign of an oversold market. It does not, however, tell us the bear move is over.
To give us some encouragement, gold must first recover $1,200. A close over $1,230/$1,240 would confirm a low is in. Our colleague Michael Ballanger who writes for GGM Advisory cites two prime reasons why he thinks gold has suffered so much here. First, he believes that computerized trading and what he calls AlgoBots—software that recognizes patterns—and then the managers who spot the patterns pile on the trade. As he said in his recent write-up (August 17, 2018) the AlgoBots don’t analyze, they just react. So, when gold breaks they pile on. We can note that what we are seeing in the gold market is not the selling of physical gold but the selling of futures—in other words, “paper gold,” not “real gold.” The good news is that this will work the other way as well. So, if gold ever recovers…
Ballanger’s second driver of the gold market, he believes, is the central banks and currency regimes. He cites a quote from Lord Rothschild, “Give me control of the nation’s money and I care not who makes its laws.” Banks make their living trading, buying, and selling. But what they buy and sell is largely paper—derivatives. Not physical, as that is too cumbersome. It is blips on a screen as dozens of traders buy and sell in reaction to customer demands (and even front-running sometimes), but also reacting to situations, computerized trading and trading the banks money. They give not one hoot about whether what they are doing actually has any economic worth, only that it makes money. Having spent upwards of 25 years on the dealing desks of some large financial institutions, we have little issue with this assessment. A return to sound money—i.e., with a gold standard—would be anathema to the bankers, or as some call them, the “banksters.” Of course, it would all be clouded under the “we are only doing this to manage our positions and the bank’s portfolios, and on behalf of our customers.”
Technically gold, along with silver and the gold stocks, has gone into a free fall. But once this is finished a strong rally much like we saw from December 2015 to July 2016 could get underway. At the time, gold soared from $1,045 to $1,377. Naturally, we need a reversal in the US$ to help propel this rally. Friday helped as gold turned and jumped some $10 thus cutting the loss on the week to only 2.9 percent. While the line in the sand is at $1,125, it is noted there is support at $1,150. The reality is, though, we need to regain $1,200 and then above $1,230/$1,240 to tell us a low is in.
In the interim, there is only one thing we can say about gold and the precious metals and that is “they are on sale at fire sale prices”.
© David Chapman
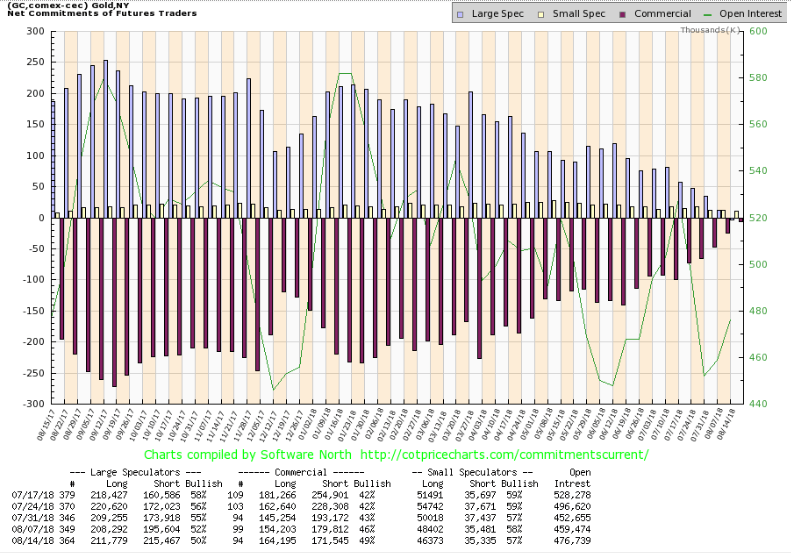
It was no surprise to see that the commercial COT took a big jump this past week to 49 percent from 46 percent. This is the highest we have seen the commercial COT since the December 2015 low. Not quite going positive as we thought might happen, but nonetheless a bullish report. Long open interest jumped roughly 10,000 contracts while short open interest fell about 8,000 contracts. It’s no surprise the large speculators COT (hedge funds, managed futures etc.) fell to 50 percent from 52 percent. Managed futures have an historical large short position. Once the commercials drive the market up, the large speculators will be forced to come in and cover their shorts. That in turn pushes the market higher.
© David Chapman
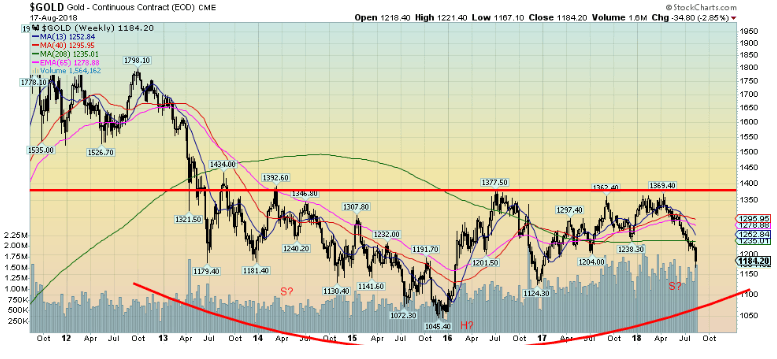
We are intrigued by the thought that gold might be forming a huge head and shoulders bottom pattern. Naturally, this is just a pattern and it won’t be realized until we firmly bust over the neckline up around $1,370. But if it were, then potential targets could be up to $1,760. Okay, that sounds optimistic when you are trading at $1,180. But this is a very intriguing bottom pattern. And we would like to end this with an optimistic note. Note that the late 2016 low was at $1,124. As we noted, $1,125 is the line in the sand. A break under that level changes the pattern and kills the potential H&S bottom pattern. These are just patterns until they are realized. And realization doesn’t come until we bust over $1,370 and preferably over $1,400.
© David Chapman
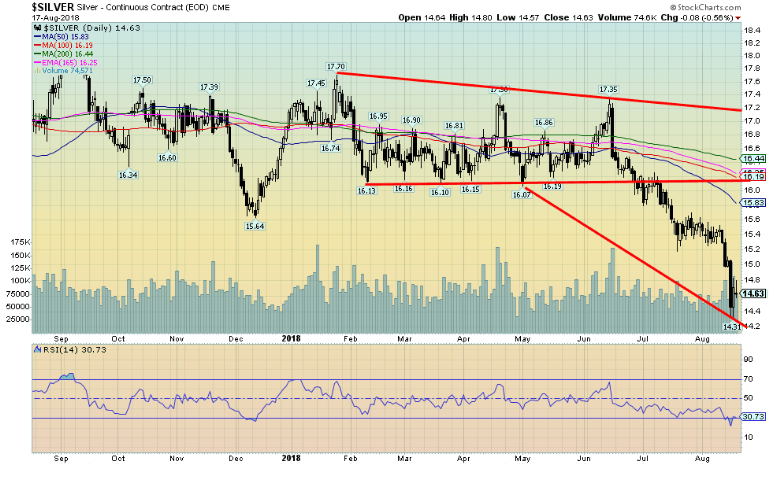
If gold has been miserable, silver has been even more miserable, falling 4.3 percent this past week and down 14.7 percent on the year. With a low this past week of $14.31, silver has potentially double bottomed with the $14.34 low seen in July 2016. At one point, we thought silver might be forming a head and shoulders bottom but that ended this week. It actually ended when silver broke under $15/$15.20. Silver first needs to regain $15 and then get over $15.60 before we can safely say that a low is most likely in. Volume on silver this week was actually higher than on gold on a comparative basis. Sentiment towards silver is abysmal and, like gold, it is as bad as it was back in December 2015. Silver then bottomed at $13.62 and then ran to a high of $21.20 by July 2016. At $14.31 we are not far off that $13.62 low. Silver’s major breakout line is at $17 and if that happens then potential targets are up to $23.80/$24. In some respects, silver, unlike gold has already crossed its line in the sand when it broke under $15.20/$15.40. Does that mean new lows ahead? Not necessarily, but it is a possibility. Silver rebounded from the $14.31 low, closing at $14.63.
© David Chapman
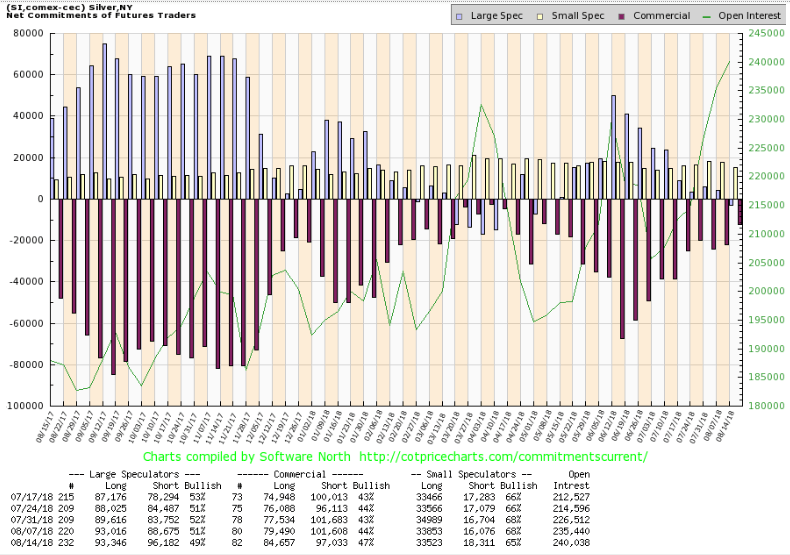
Like the gold commercial COT, the silver commercial COT improved this week to 47 percent from 44 percent. Long open interest jumped roughly 5,000 contracts while short open interest fell roughly 4,500 contracts. The large speculators COT fell to 49 percent from 51 percent. The large speculators are now net short. The silver commercial COT is almost as good as it was last March just before a run for silver from around $16 to over $17. That was a disappointing move. Hopefully, this next one won’t be.
© David Chapman
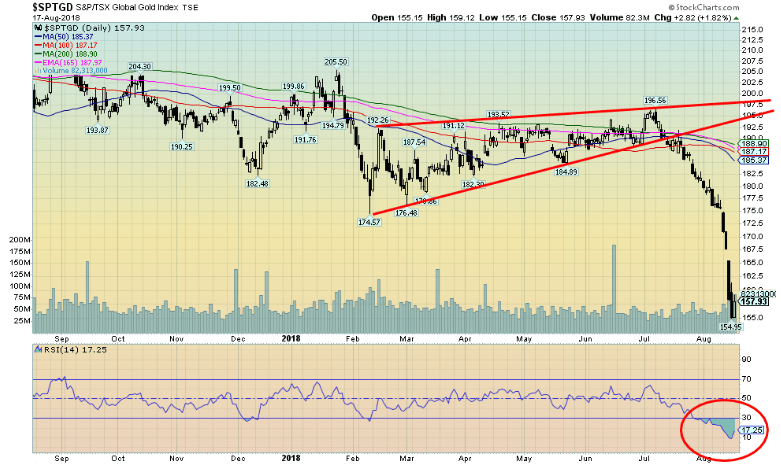
For a number of weeks, we were encouraged by the performance of the gold stocks as they held up relatively well even as gold and silver were weak. This ended rather abruptly as the gold stocks, as represented here by the TSX Gold Index (TGD), fell 10.2 percent this past week, putting in what can only be described as one ugly week. It was just panic selling.
On Wednesday, the index gapped lower in what could be a measuring or running gap. That suggests that the fall in the TGD might not be over unless we can recover and close the gap above 167.50. The U.S.-based Gold Bugs Index (HUI) was even worse falling 10.9 percent and is now down almost 26 percent on the year. The TGD is down only 19.3 percent on the year. The TGD has been helped by the weaker Cdn$.
At one poin,t the RSI had fallen to 10 this past week but rebounded and closed at 17.25. That is as miserable an RSI as we have ever seen. Volume has not been that impressive, telling us that the decline has been on low volume. Longs have for the most part gritted their teeth and are hanging on. Still, the entire week had a feeling of capitulation to it, but we can’t be confident that a low is in until we take out 167.50. More importantly, the TGD needs to regain above 185/190. Back in 2015/2016, the TGD hit rock bottom at 114.48, then rallied strongly into July 2016 to 283.72. A repeat could be in the offing as the TGD has an equal but opposite reaction. Technically, however, we can make an argument that the TGD could fall to the double bottom with 2015 at 112/115. That is if what appears to be a descending triangle pattern formed between December 2016 and this past month is fulfilled. First, we need a rebound and we’ll see how this plays out before deciding whether there is a further decline to come for the TGD and the gold stocks. A failure to regain back above 175 would be the first sign of potential trouble. In the interim, we’ll be wary but optimistic.
© David Chapman
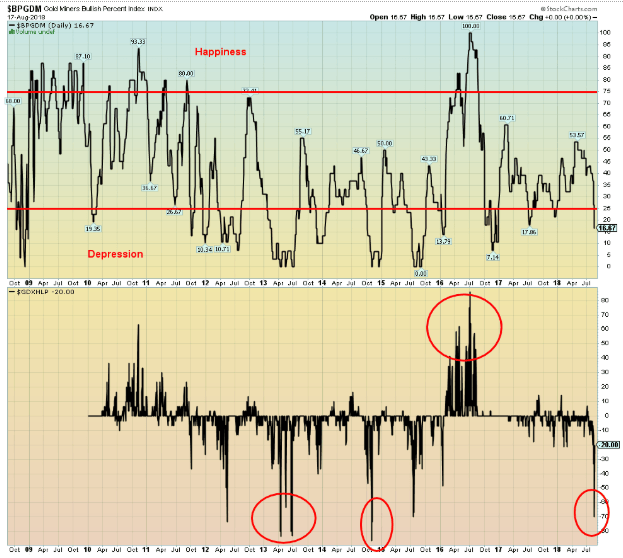
These are a couple of sentiment indicators. The first one, the Gold Miners Bullish Percent Index, shows that the bullish percent is currently at 16.67. That remains well off the lows seen back in late 2015 when it hit zero. This does make us suspicious that there still could be more downside for the gold stocks even after a rebound. The second chart is the Gold Miners New Highs – New Lows Percent Index. Again, the index has not fallen to the depths seen in April/June 2013 and again in late 2015. Still, it is at its lowest since the December 2015 low. But these indicators only tell us what we know that the gold stocks are depressed. They don’t tell us when it will turn. And that is why we use the technicals. Above 167.50 is encouraging, above 175 for the TGD is very helpful and could tell us the low is in, and above 190 would be quite bullish.
© David Chapman
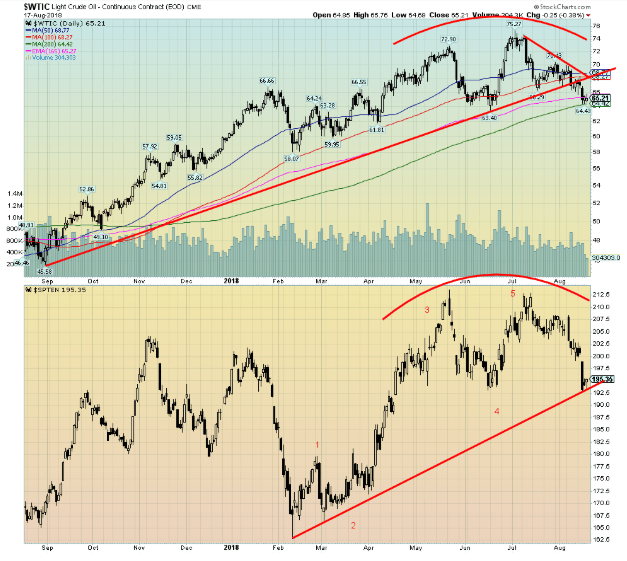
The stronger US$ has hit oil prices, as well as WTI oil, fell 3.6 percent this past week. It still remains up 7.9 percent on the year. WTI oil is going through its soft period as seasonally it is usually best between December and June or July. The wild card remains Iran. As long as Iran/U.S. conflict remains a war of words, then not much might happen. But if Iran were seriously threatened, the Iranians might follow through with their threat to block the Straits of Hormuz. That could send oil prices soaring to $100 or higher. This is not a statement as to whether they would be successful or not. Just the act of trying could send oil prices soaring. Rising oil prices have been behind numerous recessions in the past. The most recent run saw WTI oil rise from $45 to $75. A corrective period was overdue. Naturally, energy stocks have pulled back as well but remain in a bull market. A break of 192 would, however, be negative for the TSX Energy Index (TEN) and potentially target down to around 170/175. WTI oil appears to have broken the uptrend from $45, but is currently at the 200-day MA. A break of the recent low at $63.40 could send WTI oil down to $50/$52. Regaining above $68 would be positive. Above $70 would be quite positive and suggest that new highs were possible.
Chart of the week
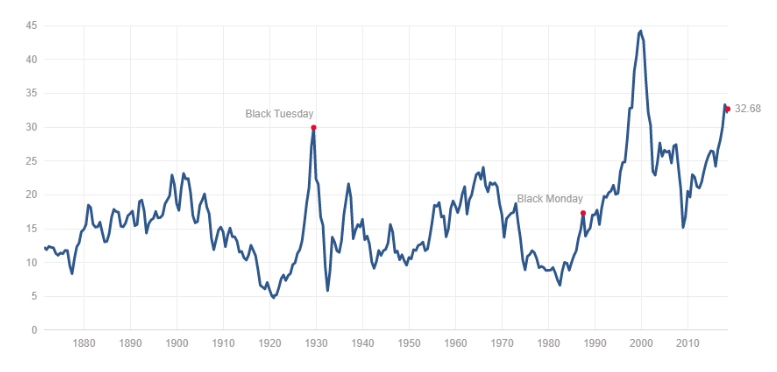
Shiller P/E Ratio
© David Chapman
By many measures, the stock markets remain overvalued. This chart of the Schiller Price Earnings (P/E) ratio shows that today’s P/E is as high as it has ever been, with the exception of late 1999/2000 before the 2000–2002 high-tech/dot.com collapse. It’s even higher than it was before the 1929 stock market crash and Great Depression and well above where it was before the 2007–2009 financial collapse. Shiller’s P/E ratio is based on average inflation-adjusted earnings for the previous 10 years, known as the Cyclically Adjusted PE Ratio (CAPE ratio). The high P/E ratio is a warning sign, not a guarantee that the market is about to fall.
© David Chapman
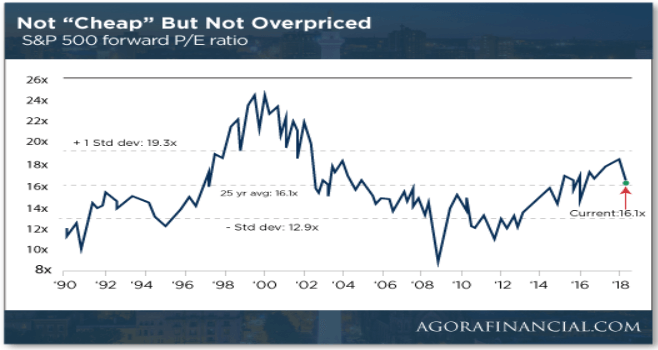
Here’s another way of looking at P/E. The chart above shows the S&P 500 Forward P/E ratio. According to this chart, the P/E is not cheap but it is not grossly overpriced either. According to this assessment, it is on its long-term average.
So, which is it? Overvalued or not cheap but okay.
Here’s another way of looking at it.
S&P 500 Dividend Yield
Hen
© David Chapman
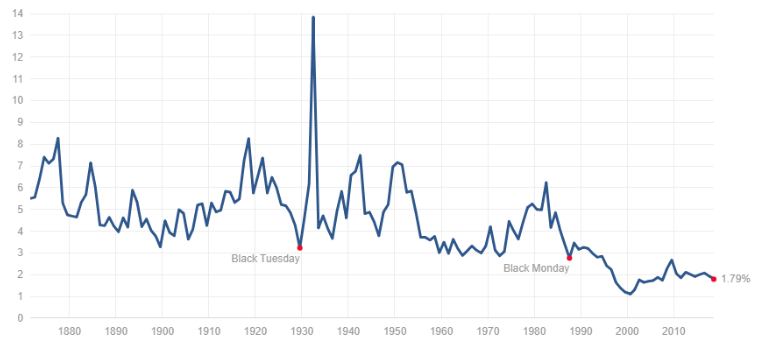
The S&P 500 dividend yield is at or near historical lows. The all-time low was seen in August 2000 at 1.11 percent. For comparison, the highest ever was June 1932 when it hit 13.84 percent. When compared to the historical yield of roughly 4.3 percent today’s yield is puny and has been for over two decades. Maybe it’s the new norm. Even following the 2008 financial collapse the dividend yield couldn’t even make it back to 3 percent. What all of this tells us is if the historical average of around 4.3 percent is to ever be attained again the stock markets must come off quite a bit.
Nonetheless, while the Shiller P/E and the dividend yield are signaling gross overvaluation in the markets it is not a guarantee that the markets are about to decline or even suffer a crash. But it does indicate that investors should not expect superior yields in the coming years. Even the chart of the forward P/E doesn’t suggest gangbuster performance going forward. The fundamentals can only tell us what to buy or sell. It is the technicals that tell us when. And as we have discussed, the technicals aren’t telling us to sell just yet. But the consistently high market valuations are sending us warning signs that we should be wary.
© David Chapman
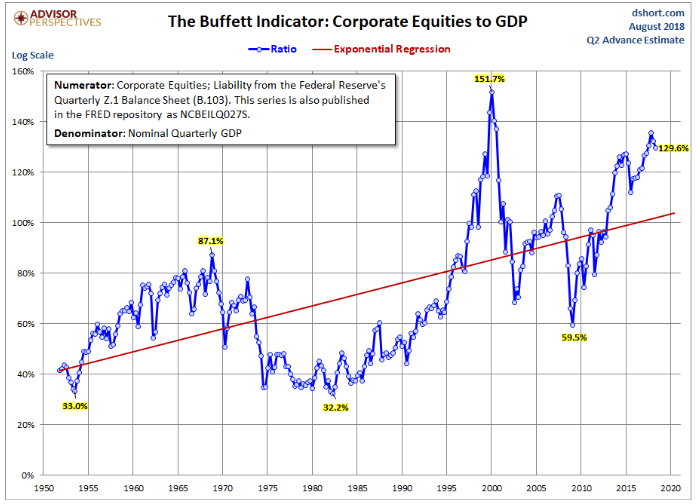
The final valuation chart we are showing is the Buffett Indicator, so named after its creator Warren Buffett. The Buffett Indicator is simply corporate equities divided by GDP. Data only goes back to the 1950s. Despite pulling back slightly, the Buffett Indicator remains at levels below what was seen in 1999/2000 at the top of the high-tech/dot.com bubble and well above the high seen at the top of the housing/mortgage bubble of 2006/2007. As with the other indicators, this is not a timing tool. It is an indication that valuations are at very high levels and one now goes into the market with either trepidation or not at all. None of this is to say the market can’t go higher. It, like the other indicators, is a warning sign that one might consider exercising caution. For every action, there is an equal but opposite reaction and trending above the mean for a period of time usually translates into trending below the mean for some period of time. As they all say, “caveat emptor.”
(All charts are courtesy of Stock Charts and COT Price Charts.)
—
DISCLAIMER: David Chapman is not a registered advisory service and is not an exempt market dealer (EMD). We do not and cannot give individualized market advice. The information in this article is intended only for informational and educational purposes. It should not be considered a solicitation of an offer or sale of any security. The reader assumes all risk when trading in securities and David Chapman advises consulting a licensed professional financial advisor before proceeding with any trade or idea presented in this article. We share our ideas and opinions for informational and educational purposes only and expect the reader to perform due diligence before considering a position in any security. That includes consulting with your own licensed professional financial advisor.

-

 Cannabis1 week ago
Colombia’s Medical Cannabis Industry Sees Rapid Growth and Expanding Adoption
-

 Biotech5 days ago
CIPM Expands Drug Funding and Indications
-

 Fintech2 weeks ago
Bermuda Sets Sights on Becoming the World’s First Blockchain Economy
-

 Cannabis1 day ago
KONOPEX Expo 2026: Celebrating Europe’s New Era of Legal Cannabis


You must be logged in to post a comment Login