Featured
US market remains a bull market but concern grows over potential for debt collapse
There several factors affecting the economy, including the public perception of the Trump administration.
Donald Trump has dominated the headlines since he announced he was going to run to become President of the United States. Love him or hate him (there seems to be little in between), there is no doubt of his dominance in the headlines.
From “grab her by the pussy” to “fire those sons of bitches” to “totally destroy” another country, whatever he says (or tweets) grabs headlines with both cheering and derision. There is little doubt about his impact today on the USA and the world for that matter, both good and bad. He is and has become the “Great Divider.” His approval rating quickly fell below 40% and has remained there ever since. One has to go back to the brief Presidency of Gerald Ford to find such a low approval rating so early on.
Setting aside his attention-grabbing headlines, our focus has to be on what it means for the economy and markets. Money is neither left nor right. Money goes where it can make a profit or a return. George Soros, a well-known supporter of leftist causes wants to make money just like the Koch Brothers, well-known supporters of right-wing causes. The Trump economy so far doesn’t look a whole lot different than the Obama economy. Naturally, one can say that it has nothing to do with the President and everything to do with who is in charge at the Fed. Ben Bernanke was Fed Chairman when Obama was elected. Janet Yellen took over in 2014. Her term expires in February 2018.
Coming out of the worst financial crisis since the Great Depression, the US economy has bungled along averaging roughly 2% growth. The official unemployment rate (U3) has fallen to 4.3%, the lowest level since 2001. It has put the labor market at or close to full-employment following 81 consecutive months of economic growth. Debt exploded after the 2008 financial crisis as US government debt grew from $10.7 trillion to $20.2 trillion today, 104% of GDP. The number of people officially unemployed (U3) fell by roughly 3.2 million even as the actual unemployed (U6) stayed roughly the same. The biggest growth was for part-time workers, typically in low-paying jobs with few benefits, if any.
Record highs
The US stock market is at record highs and the Dow Jones Industrials (DJI) has soared 25% since Trump’s election in November 2016. The DJI was up 100% during Obama’s tenure. Oil prices have been low for a number of years and inflation remains benign, consistently below the Fed’s target of 2%. Consumer confidence remains buoyant even if it is off its highs. But there are some signs of trouble.
Overall debt is astronomical at $67.5 trillion. While major global debt growth has been elsewhere, particularly China, in the US overall debt is up about $17 trillion or 33% since the 2008 financial crisis. The federal government added to most of this debt as it coped with bailing out the financial system to prevent a complete collapse. Other areas of concern have been a sharp rise in student and car loans. Both are showing increased signs of delinquency. Wage growth, while overall it has seen some improvement, remains sluggish at best with most of the wage growth going to the top 20% of wage earners. Nominal GDP growth has lagged debt growth up to $5.2 trillion since the financial crisis of 2008.
There is growing concern about the potential for debt collapse and bankruptcies. The number one reason Americans go bankrupt is medical expenses, accounting for 62% of all personal bankruptcies. But individual bankruptcies while of concern are not the biggest. A number of US states have flirted with bankruptcy over the past few years. Puerto Rico, while not a state, became the biggest municipal bankruptcy in US history owing some $78 billion. As it turns out, the main holders of the debt are not Wall Street banks but mutual funds. Hedge funds are estimated to hold roughly 25% of Puerto Rico debt while mutual funds hold the rest. There is also growing concern over underfunded pension funds. But underfunded pension funds are a global problem, not something unique to the US. It is estimated that there is currently a $70 trillion pension deficit globally.
Trump has been busy since taking power in January 2017. He has signed off on numerous executive orders, many of them undoing previous executive orders. Here he has been busy and successful largely because he doesn’t have to deal with Congress. But executive orders do not require funding nor do they affect laws. That rests with Congress. When it comes to major legislation that needs both Congressional and Senate approval things have not gone as well. The most high-profile failure was the repealing of Obamacare, a measure that has repeatedly failed in the Senate despite Republicans holding a majority in both houses. On other items such as the debt ceiling, it required cutting a deal with Democrats to gain support. Others such as funding for “the wall” have also repeatedly failed.
The great hope, however, is on tax reform. It is here that the stock market has put its greatest hopes. Failure here could see a sudden correction in the stock market. Since the stock market has rallied so much in the past nine months passing it might not get the bump that everyone thinks it will (classic buy the rumor, sell the news). Some key highlights of tax reform are as follows:
- A slash in the corporate tax rate to 20% from 35%
- A cut in the “pass-through” business tax rate to 25%
- A reduction of individual tax brackets to three, with a top rate of 35%
- A doubling of the standard personal tax deduction
- Elimination of the state and local tax deduction
- Elimination of the estate tax and the alternative minimum tax
- Expansion of refundable tax credits for childcare/dependent care
- Ability for businesses to accelerate expensing of investments
- Creation of a one-time repatriation of foreign earnings
Big tax cuts could push the S&P 500 up further from current levels—this, despite the drag that is expected because of the hurricanes and wildfires. The repatriation of foreign earnings is one area expected to pass and it could prove to be a boon for high-tech companies and multinationals. But will the money be invested to create jobs or more likely paid out as dividends and bonuses? Failure to pass tax reform could spell considerable trouble for the stock market especially against the background of the Fed hiking interest rates and bringing down the size of its balance sheet (withdrawing money from the financial system).
Could tax reform fail? Yes, as opponents will point out and according to a US Senate panel, the benefits will go largely to corporations and the wealthy while hiking taxes on upper-middle-income taxpayers. The assumption is they will spend thus increasing GDP. This is known as “trickle-down economics.” It has been tried in the past and it didn’t work and it probably won’t work this time either. What it did do is unleash further speculation in the stock markets sending markets to even greater highs.
Again, according to the US Senate panel, it provides $5.99 trillion in tax cuts and reduces federal revenues by net $2.4 trillion over the next decade. This is expected to add considerably to the federal debt. The passage is not guaranteed, especially against the backdrop of the failure to pass healthcare legislation.
Donald Trump has dominated the headlines, and he will continue to do so. He has changed the perception of everything. And that will continue to dominate American and global politics for years to come.
The search for the Fed Chairman continues
Apparently, Trump has talked to four potential candidates to replace Janet Yellen in February 2018. The four are Janet Yellen herself, National Economic Council Director Gary Cohn, Fed Board Governor Jerome Powell and former Fed Governor Kevin Warsh. Others apparently being considered are Stanford University economist John Taylor, former BT&T CEO John Allison and Columbia University economist Glenn Hubbard.
According to reports, one of the top candidates is Kevin Warsh. This is interesting as he is known as a hawk and has complained in the past about the Fed’s manipulation of markets and their secret gold swap arrangements with foreign banks. He is on record as having complained about financial repression meaning clamping down on market prices of things they don’t like. He has complained that the Fed needs a new direction.
All of this is interesting as it fits with some of Trump’s own views. It is noteworthy that Trump is a believer in a gold standard. It is also interesting that Treasury Secretary Steve Mnuchin was the first Treasury Secretary to visit Fort Knox since 1974. Only three Treasury Secretaries have ever visited. The last time the gold in Fort Knox was counted was in 1953. Mnuchin said the gold was worth $200 billion. That’s odd because at current prices of roughly $1,280/ounce the holdings of 8,133.5 tonnes should have a value of at least $367 billion—a small understatement.
We have heard rumors that the US might consider revaluing gold to $5,000/ounce. That would then value the holdings in Fort Knox at around $1.4 trillion, which would be roughly equivalent to US currency (notes and coins) in circulation. It would also instantly lower the value of the US$ (the same as it did in 1934 when Roosevelt revalued gold upward to $35/ounce from $20.67/ounce). And it would boost inflation with the lower US$. Something the Fed would like as inflation has stubbornly remained under their 2% target.
Is all this going to happen? We don’t know but it is an interesting speculation.
MARKETS AND TRENDS
|
|
Percentage Gains Trends
|
|||||||
| Stock Market Indices | Close
Dec 31/16 |
Close
Sep 29/17 |
Week | YTD | Daily (Short Term) | Weekly (Intermediate) | Monthly (Long Term) | |
| S&P 500 | 2,238.83 | 2,519.36 (new highs) | 0.7 | 12.5 | up | up | up (topping) | |
| Dow Jones Industrials | 19,762.60 | 22,405.09 | 0.3 | 13.4
|
up | up | up (topping) | |
| Dow Jones Transports | 9,043.90 | 9,914.35 (new highs) | 2.2 | 9.6 | up | up | up (topping) | |
| NASDAQ | 5,383.12 | 6,495.96 (new highs) | 1.1 | 20.7 | up | up | up (topping) | |
| S&P/TSX Composite | 15,287.59 | 15,634.94 | 1.2 | 2.3 | up | up | up | |
| S&P/TSX Venture (CDNX) | 762.37 | 781.23 | 0.4 | 2.5 | up | down (weak) | up (weak) | |
| Russell 2000 | 1,357.14 | 1,490.86 (new highs) | 2.8 | 9.9 | up | up | up (topping) | |
| MSCI World Index | 1,690.93 | 1,970.06 | (0.2) | 16.5 | up | up | up | |
| Gold Mining Stock Indices | ||||||||
| Gold Bugs Index (HUI) | 182.31 | 196.52 | (1.5) | 7.8 | down | neutral | up (weak) | |
| TSX Gold Index (TGD) | 194.35 | 196.08 | (0.6) | 0.9 | down | down | up (weak) | |
| Fixed Income Yields | ||||||||
| U.S. 10-Year Treasury yield | 2.45 | 2.33
|
3.1 | (4.9) | ||||
| Cdn. 10-Year Bond yield | 1.72 | 2.12 | 2.4 | 23.3 | ||||
| Currencies | ||||||||
| US$ Index | 102.28 | 92.88 | 1.0 | (9.2) | up (weak) | down | down | |
| Canadian $ | 0.7440 | 0.8050 | (0.7) | 8.2 | neutral | up | up (weak) | |
| Euro | 105.22 | 118.18 | (1.1) | 12.3 | down (weak) | up | up | |
| British Pound | 123.21 | 133.96 | (1.0) | 8.7 | up | up | down | |
| Japanese Yen | 85.57 | 88.84 | (0.4)
|
3.8 | down | neutral | neutral | |
| Precious Metals | ||||||||
| Gold | 1,151.70 | 1,284.80 | (1.0) | 11.6 | down | up | up | |
| Silver | 15.99 | 16.68 | (1.8) | 4.3 | down | down (weak) | neutral | |
| Platinum | 905.70 | 915.50 | (1.8) | 1.1
|
down | down | down | |
| Base Metals | ||||||||
| Palladium | 683.25 | 936.85 | 1.9
|
37.1 | up | up | up | |
| Copper | 2.5055 | 2.95 | 0.3 | 17.7 | neutral | up | up | |
| Energy | ||||||||
| WTI Oil | 53.72 | 51.67 | 2.0 | (3.8) | up | up | neutral | |
| Natural Gas | 3.72 | 3.01 | flat | (19.1) | up (weak) | neutral | neutral | |
© David Chapman
Note: For an explanation of the trends, see the glossary at the end of this article.
New highs/lows refer to new 52-week highs/lows.
© David Chapman
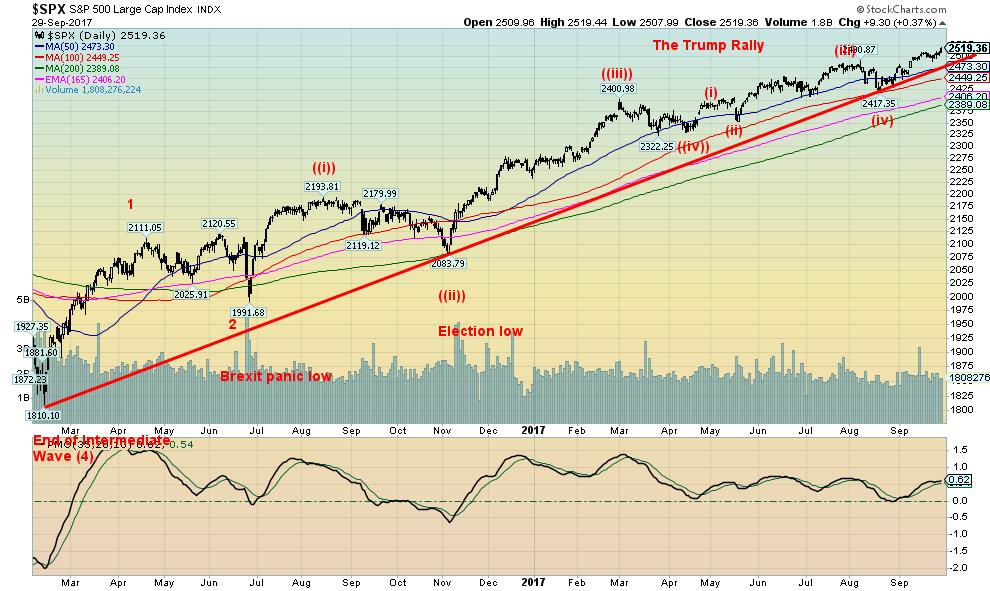
The Trump rally continues
Once again, the markets made new all-time highs. The S&P 500, the NASDAQ, and the Dow Jones Transportation (DJT) were the notable major indices making new highs while the Dow Jones Industrials (DJI) was just short of a new all-time high but did make a new all-time weekly close. As we note below, with the DJT joining the DJI and the others in making new all-time highs the indices are confirming each other. The rally is not over yet.
It should be noted that the S&P 500 RSI (not shown) has hit 69. Anything above 70 indicates an overbought market and one vulnerable for a correction. It does not, as some might believe, signal a top. It only signals that a top could be at hand. It is noteworthy that both important tops and bottoms can take place in October. The 2000–2002 bear market ended in October 2002 while the top before the financial crash of 2008 occurred in October 2007.
October can be a strange month given its notorious reputation for crashes but also for ending bear markets. Crashes both major and mini occurred in 1929, 1987, 1978, 1979, 1989, 1997, 1998, and 2008. But bear markets also saw their bottom in 1946, 1957, 1960, 1962, 1966, 1974, 1982, 1987, 1990, 1998, 2001, 2002, and 2011. The old adage is “buy when it snows, and sell when it goes” fits well into the October narrative. First snows often come in November the month after October. And by April the last snows are usually gone leading to “sell in May, and go away.”
It is interesting to note that the top in 2007 came in October 2007, 20 years after the crash of 1987 and 10 years after the mini-crash of October 1997. Ten years later and we are in 2017 going into October on a high note. Given a market that is high on complacency, overbought and with fading momentum, it might not take much to trigger a top and a mini-panic.
© David Chapman
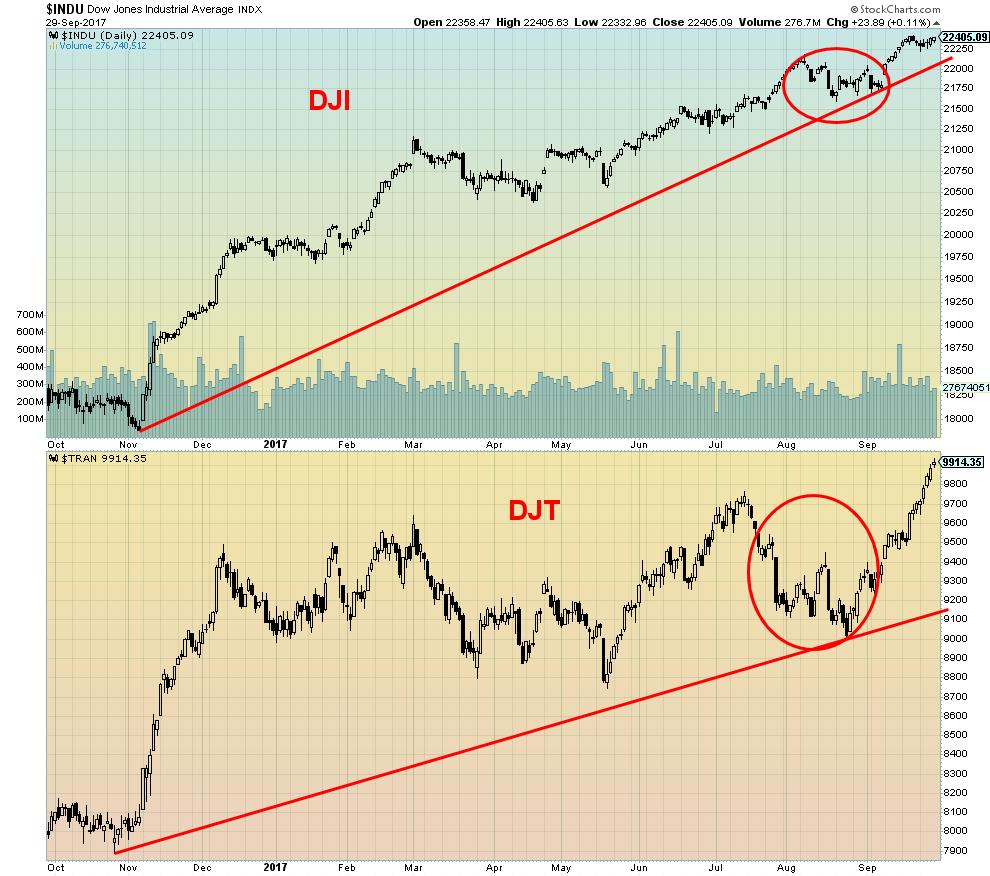
Dow Theory states that the averages must confirm each other. This past week the DJT joined the DJI in making new all-time highs. It looked for quite a while that we were going to have a major divergence between the two (note the circled area). But it never happened. There was never a confirmation. And now that the two have confirmed each other, we will have to wait another day to see if a major divergence occurs between the two major Dow indices.
© David Chapman
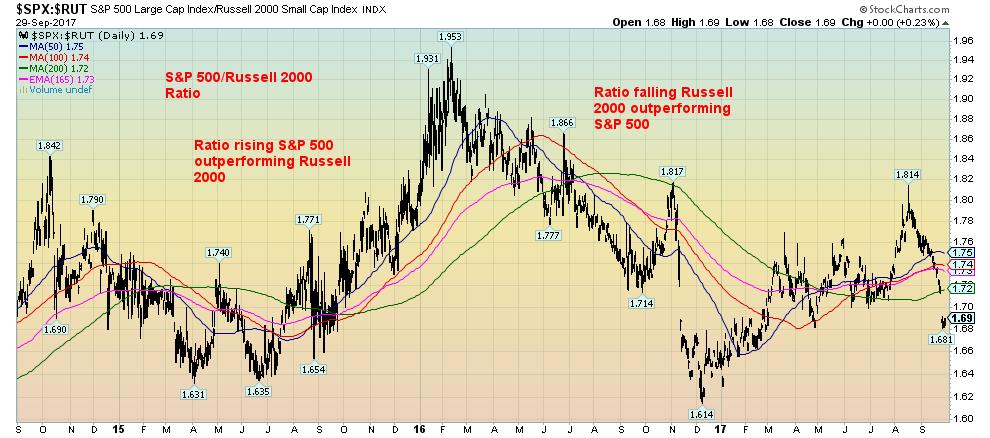
Another important indicator of bull and bear markets is the ratio between big cap stocks, represented here by the S&P 500, and small-cap stocks represented by the Russell 2000. When the ratio is rising indicating that the S&P 500 is outperforming we are usually in a bear market. But in a bull market, the small-cap stocks are usually the leader and the ratio is falling. The ratio topped in August 2017 and since then it has fallen sharply. The indication here is we are back in a bull market as the small-cap stocks are leading the way. If there is a note of caution, it is that the ratio gapped down. The last time it did that was in November 2016 and a month later, the ratio made its low. At 1.68, we are not far from the December 2016 low of 1.61.
© David Chapman
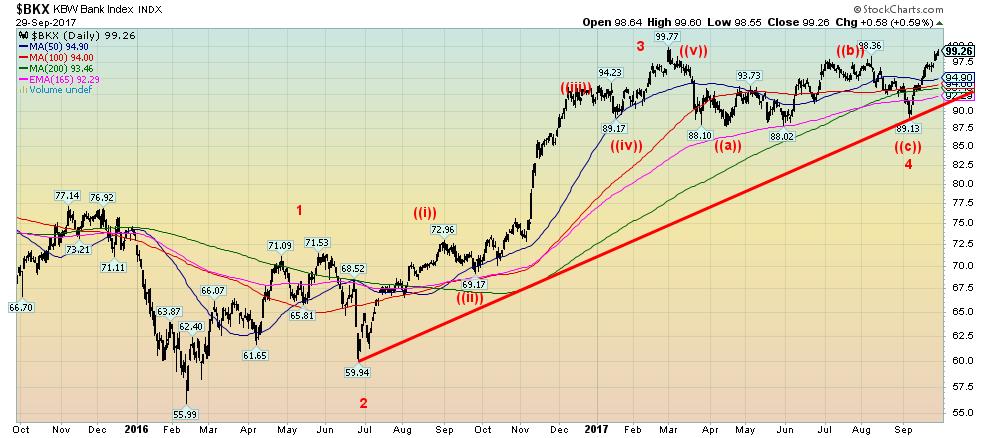
Yet another sign that we remain in a bull market—the KBW Bank Index (BKX) is threatening to break out to new highs. It appears to have completed an ABC type pattern and has formed what we believe is minor wave 4. Once new highs are in place above 99.77 there is potential to rise to 110/112. Financials (banks) leading the way to the upside is not unusual in a bull market. Despite the gains made by the KBW Bank Index, it is noteworthy that it remains below its all-time high set in February 2007 at 121.16. Naturally, a failure here and a break back below 90 would not bode well for the index and the bank stocks. That would suggest that a potential significant top has been made.
© David Chapman
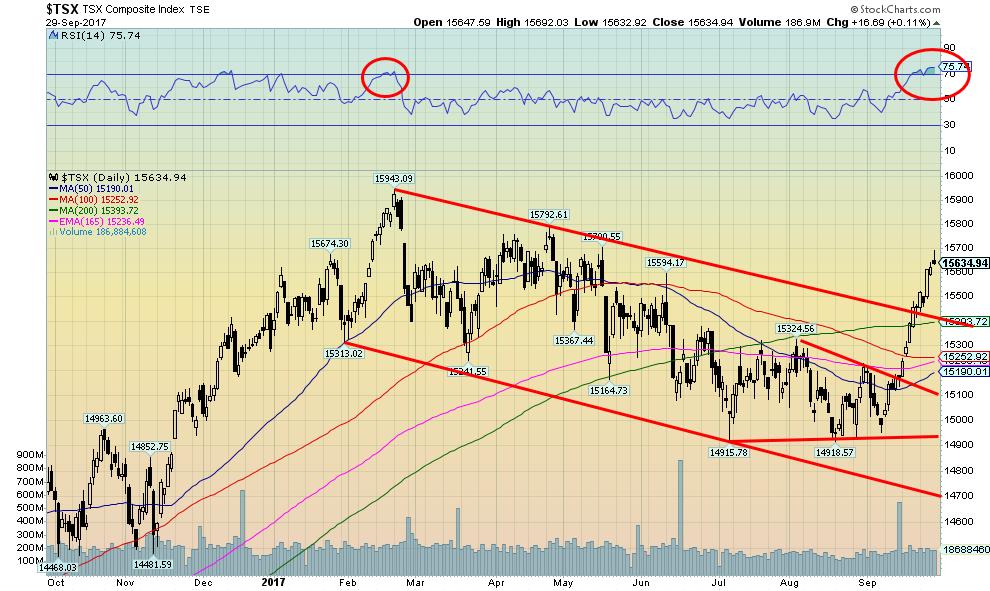
The S&P TSX Composite has also joined the party of indices breaking out in a bullish manner. The TSX broke off a long bear channel and is now threatening the all-time high seen back in February 2017 at 15,943. We are now 300 points off that mark. The breakout from the bear channel has the potential to rise to 17,000. The ability to reach those levels will be heavily dependent on the performance of the TSX Energy Index (TEN).
The TEN appears to be breaking out to the upside and its leadership would be needed if the TSX is to reach 16,400. If the Materials group joins the TEN then these two combined could push the TSX higher as long as the other sub-indices don’t fall away too much. One note of caution is RSI has reached over 70. When this happened in the past, most notably in February 2017, the market usually found a top and a correction followed. A return back under 15,400 would suggest that a top could be in or at least a temporary one.
© David Chapman
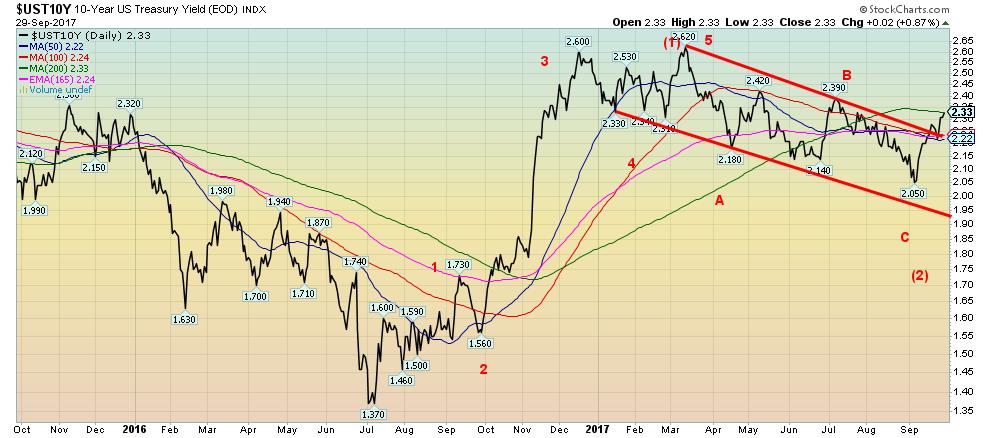
The combination of the Fed hiking interest rates, or at least proposing to hike them more in 2017 and again in 2018, coupled with the Fed’s intention to unwind its balance sheet (tightening), a pick-up in inflation and tax reform that could see deficits rise sharply has combined to raise long-term interest rates. The 10-year US Treasury note yield rose to 2.33% this past week. The yield appears to have broken out of the downtrend channel and could now challenge the high seen back in February 2017 at 2.62%. Projected targets could see the 10-year rise to 3%. The Government of Canada’s 10-year bond yield was unchanged this past week at 2.12%, but if the BofC were to hike interest rates again and inflation signs pick up, coupled with rising rates in the US, it would also put pressure on Canadian bond yields.
© David Chapman
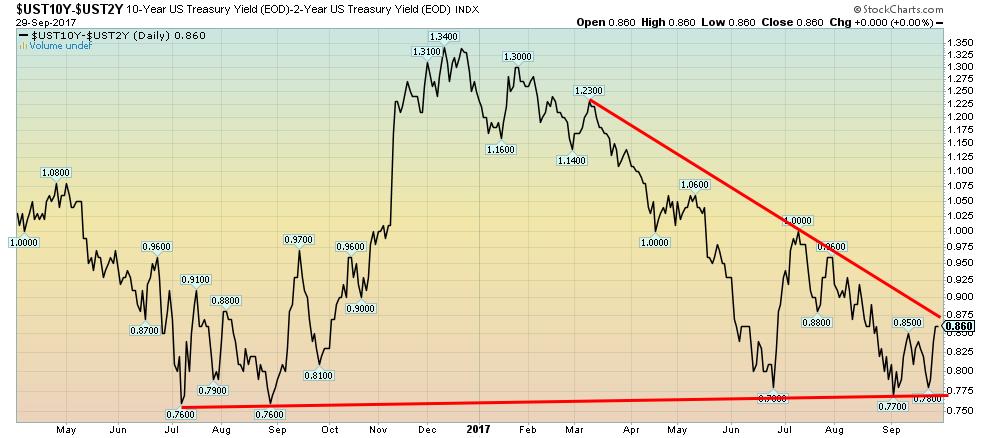
Spread watch. The 2-10 year spread jumped this past week from 0.80% to 0.86%, a significant jump. Given its proximity to breaking to the upside, we would have to reconsider the case of a narrowing spread. The triangle pattern is quite defined. A breakout above 0.875% could suggest higher spreads and a positive sign for the health of the economy. A breakdown below 0.77% would suggest a narrowing spread. It is noteworthy that before both the 2000–2002 recession and the 2007–2009 the 2-10 year spread was negative. Inverse yield spreads are often a sign that a recession could be approaching. Right now we are nowhere near that and if anything we could be indicating that things are just fine. Stock market bulls will like that but so might gold bulls.
© David Chapman
Bitcoin watch
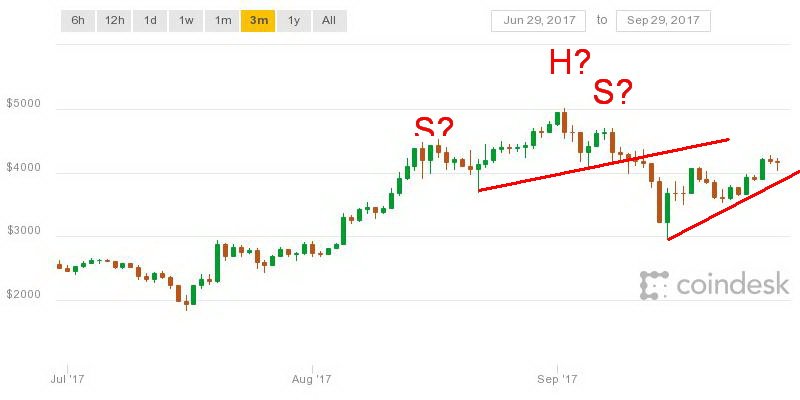
Bitcoin continues its rebound after what appeared as a breakdown from a possible head and shoulders topping pattern. The pattern indicated potential targets of around $3,400. With a low thus far of $3,226 that target was achieved. Since then Bitcoin has moved into what may be a corrective pattern that is not yet complete. Key is the top of the right shoulder near $4,600.
If Bitcoin can take out that level, then new highs are probable. But there are some ongoing negative signs as momentum has been waning. Korea joined China in banning ICO issues. Other countries are also studying Bitcoin and what it could mean for their currencies. Allegations of potential fraud have been leveled against Bitcoin by Jamie Dimon the Chairman of JP Morgan Chase. Whether this is true or not, it is a significant question from one of the largest banks in the world.
Banks along with governments are not necessarily tolerant of currencies trading outside of their purview and control. There has been evidence of scammers and hackers against Bitcoin and other cryptocurrencies. Speculative price gains, as we have seen with many of the cryptocurrencies, bring out these people. That could prove to be a problem going forward if it is not brought under control.
Bitcoin has recovered from the collapse following what appears as a head and shoulders top. A rebound rally is not unusual. But, as noted, Bitcoin needs to regain above $4,600 to suggest new highs. Failure and a breakdown under $3,600 could suggest that another move to the downside is underway and that the current up-move is nothing more than a bull trap.
© David Chapman
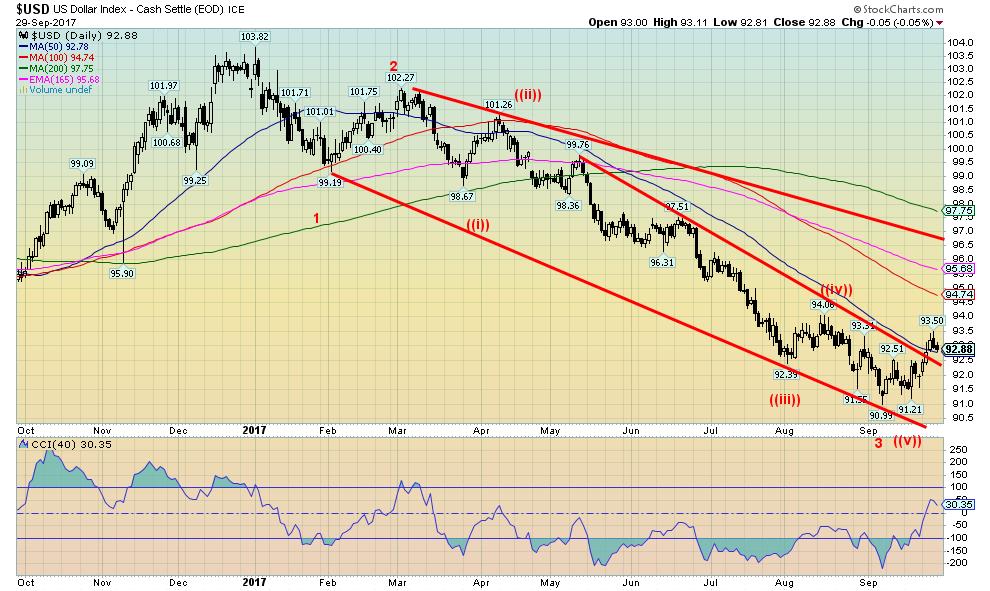
Here is a real fiat currency that has problems in 2017. The US$ Index topped back in early January 2017 and has been on a downward swing ever since. The Trump rally has seen stock markets hit record highs. The opposite has occurred with the US$. The US$ Index is down 10.5% from the high. Many are calling for the demise of the US$. A reminder: it is the reserve currency and that is not about to change immediately. The US$ Index has broken above the downtrend line from the May 2017 high and did go over 93 earlier this week. But by week’s end, it failed to hold above 93 closing slightly below that level.
The 50-day MA is at 92.78 and the US$ Index held just above that level. It may well be that wave 3 to the downside is now finished and we are now embarking on wave 4. Following that the US$ Index should plunge to new lows. How high could the US$ Index go? In an ideal world, it could reach to the downtrend line from the February 2017 currently near 96.50. The next zone of resistance is up around 94.75. A rising US$ Index has negative implications for the Euro and gold going forward. Support can be seen down to 92.50 and below that 91.50. Any move back under 91.50 would probably negate any further bullish potential.
© David Chapman
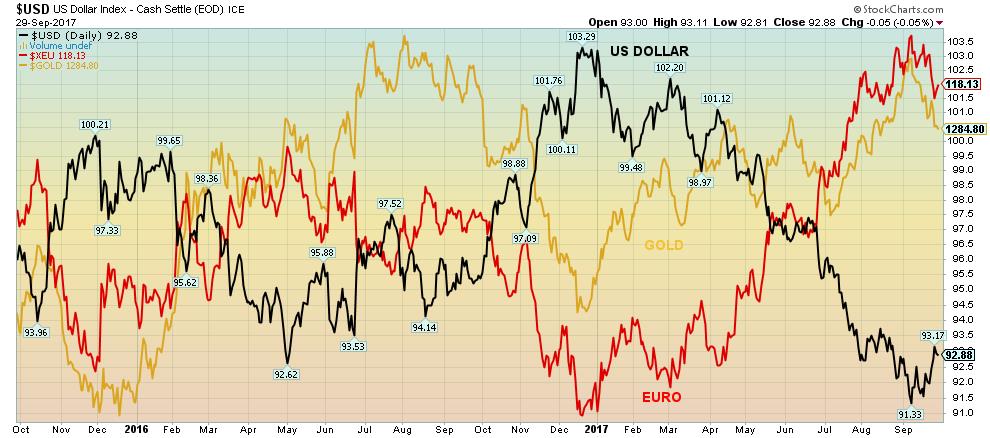
Here is a picture of the US$ Index vs. the Euro and gold over the past couple of years. Note how they move almost in harmony: US$ Index up, Euro and gold down; US$ Index down, Euro and gold up. It is no surprise, really, but it is nice to see it visually to remind everyone about the interrelationship among the three currencies (yes, gold is a currency too).
© David Chapman
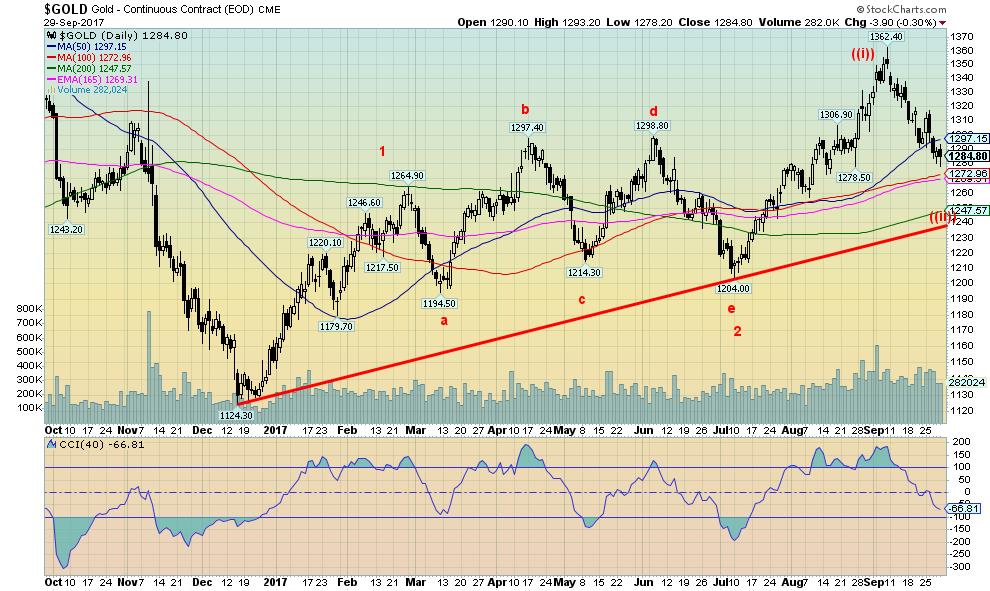
For the third consecutive week, gold prices fell, this time losing 1%. Gold, however, remains up 11.6% in 2017. We continue to believe that gold completed a corrective wave (labeled 2) in July 2017 and is now embarking on what we believe to be the C wave, up from the major low seen in December 2015. We had quite some time ago noted that gold could see a prolonged period of weakness from late 2015 to late 2017 as it tries to find a major cyclical low. Following the major top seen at $1,923 back in September 2011, gold has been going through a major corrective period that is now into its 6th year.
Considering gold had been rising (with interruptions of course) from a major low in 2001 to the top in 2011 a 6-year correction following a decade-long bull market could be considered normal. Since the major low in December 2015 at $1,045, gold has been moving higher, although in an irregular fashion. Gold topped out in July 2016 $1,377 before taking another plunge bottoming in December 2016 at $1,124 almost a $100 above the December 2015 low. Since the gold made a high of $1,297 in April 2017 and then went into a series of sharp ups and downs tracing out what we believe to be a corrective wave.
That wave we believe is over once gold took out June 2017 high of $1,298 by hitting a high of $1,362 in September 2017. Now we await the current corrective wave low. The level and timing are to be determined but it is interesting to note we have seen a series of lows in the November/December period the past few years. Gold could yet test down towards $1,270 before embarking on an upward correction. Resistance would be seen from $1,315 to $1,325. A move back above $1,340 would confirm that a low is in and a move to new highs was most likely underway. Ultimate targets to the downside could be around $1,240 and the rising trendline from December 2016.
© David Chapman
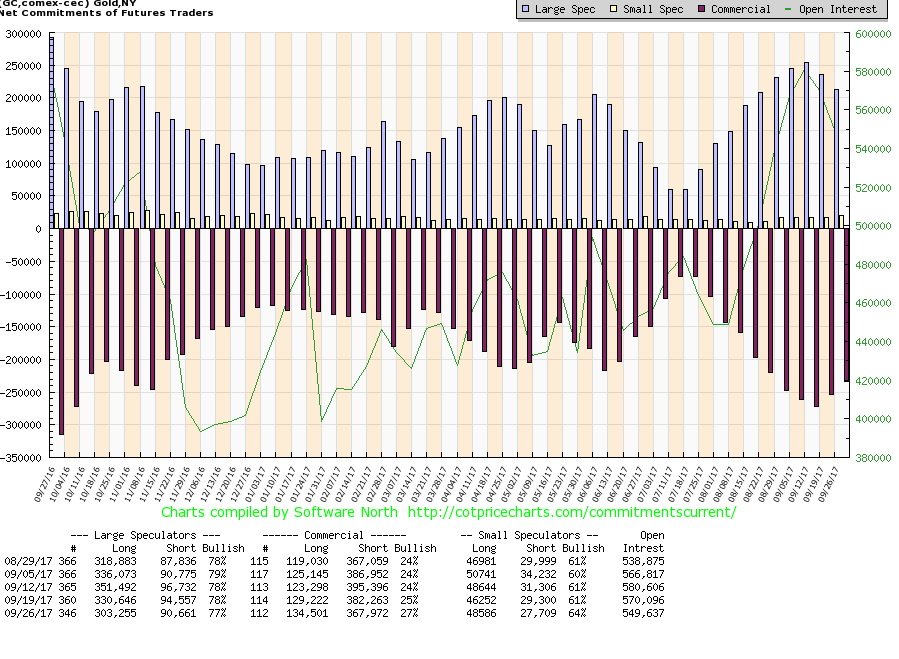
We suppose it is not a surprise that with the downward move in gold the commercials have begun to cover their shorts. This past week saw the commercial COT rise to 27% from 25% with long open interest up roughly 5,000 contracts and short open interest down about 14,000 contracts. The large speculators who are, it seems, invariably wrong at major turns saw their long open interest plunge some 27,000 contracts even as short open interest dropped roughly 4,000 contracts. We’d like to see the commercial COT closer to 40% to confirm that a major low is most likely in.
© David Chapman
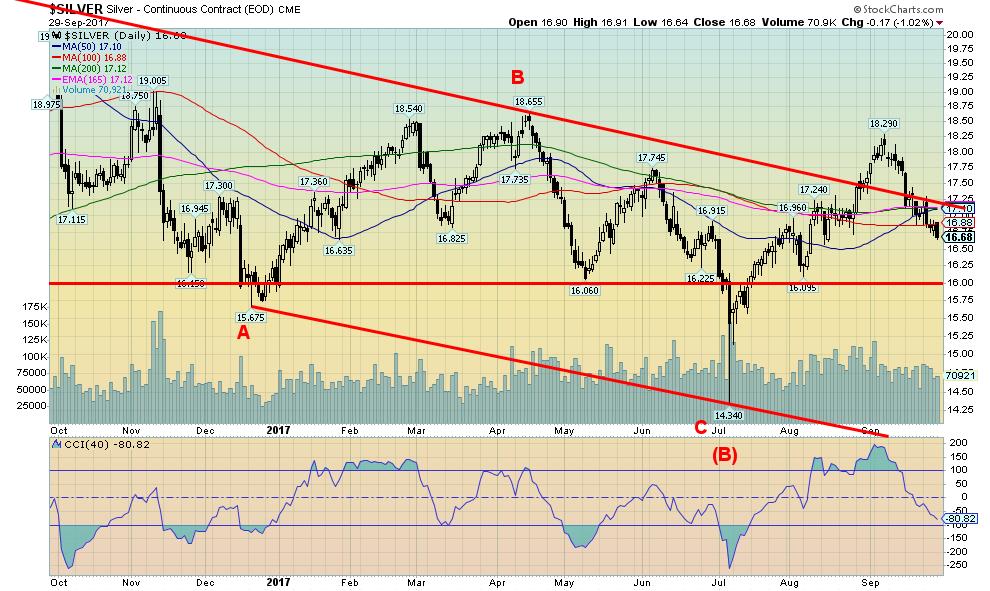
Silver like gold has struggled the past few weeks losing 1.8% this past week. Silver is lagging behind gold and is only up 4.3% thus far in 2017. We’d like to see silver (and the gold stocks) leading gold. Silver plunged to new lows for the current move down this past week. While silver has support in the $16.35 to $16.50 zone major support is not really seen until near $16. We don’t believe even on this move down that silver will trade under $16. Obviously, the short-term trend for silver has turned down (and gold’s short-term trend is also down). Silver needs to regain back above $17/$17.25 to convince us that a low might be in. At the recent high of $18.29 silver failed to take out the April 2017 high of $18.66. Gold did take out its April 2017 high, a divergence. Similarly at the recent lows for silver at $14.34 in July silver took out a number of previous lows. Gold did not do the same thus giving rise to another divergence. These divergences between the metals are important and we would not be surprised to see another divergence emerge between the two before we see our final low for the current correction.
© David Chapman
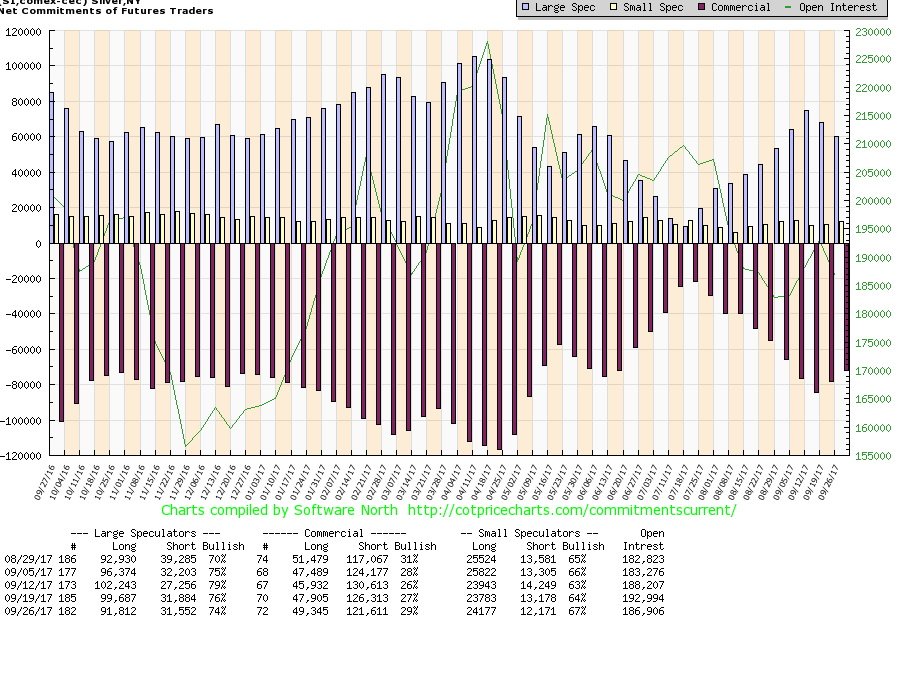
Like the gold commercial COT the silver commercial COT improved this past week to 29% from 27% the previous week. Long open interest rose roughly 1,500 contracts while short open interest dropped by nearly 5,000 contracts. The large speculators COT also shifted with long open interest dropping about 8,000 contracts even as short open interest remained largely unchanged. The large speculators COT fell to 74% from 76%. We continue to be impressed by the large long positions held by the large speculators. That tells us a large contingent is holding their positions despite the ups and downs of the silver price. We are not seeing the big plunge in long open interest that used to typify previous price drops for silver.
© David Chapman
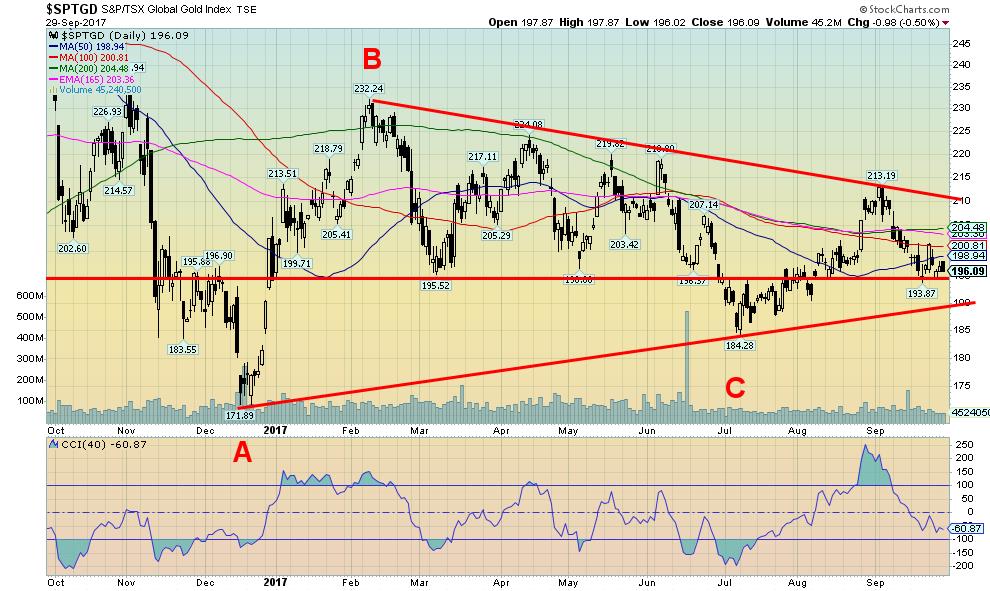
The gold stocks continue to struggle. We confess we have rarely ever seen such a prolonged period of time that gold stocks have consistently remained under-valued and under-owned in relation to the price of gold. Maybe it’s a new shift and the gold stocks are just not trusted. But it is a small market and if money does start to pour in the gold stocks can move rapidly. The TSX Gold Index (TGD) remains down about 57% from its highs in September 2011.
There is support for the TGD here and the next good level of support comes in around 190. Below 190 new lows below 184 are possible. Resistance ranges up to 205 but the TGD needs to clear 210 to suggest that a more sustained up move might get underway. Like gold and silver, we believe that the TGD made an important low in July 2017. That is why it is important to hold that level on any pullback. The short-term trend has turned down. Sentiment towards the gold stocks is quite low, but not so low as to suggest the market is about to turn the corner.
GLOSSARY
Trends
Daily – Short-term trend (For swing traders)
Weekly – Intermediate-term trend (For long-term trend followers)
Monthly – Long-term secular trend (For long-term trend followers)
Up – The trend is up.
Down – The trend is down
Neutral – Indicators are mostly neutral. A trend change might be in the offing.
Weak – The trend is still up or down but it is weakening. It is also a sign that the trend might change.
Topping – Indicators are suggesting that while the trend remains up there are considerable signs that suggest that the market is topping.
Bottoming – Indicators are suggesting that while the trend is down there are considerable signs that suggest that the market is bottoming.
(All charts are courtesy of Stock Charts and COT Price Charts.)
__
DISCLAIMER: David Chapman is not a registered advisory service and is not an exempt market dealer (EMD). We do not and cannot give individualised market advice. The information in this newsletter is intended only for informational and educational purposes. It should not be considered a solicitation of an offer or sale of any security. The reader assumes all risk when trading in securities and David Chapman advises consulting a licensed professional financial advisor before proceeding with any trade or idea presented in this newsletter. We share our ideas and opinions for informational and educational purposes only and expect the reader to perform due diligence before considering a position in any security. That includes consulting with your own licensed professional financial advisor.


Youth Cannabis Use in Colorado Is Falling — But the Full Story Is More Complex
The 2026 Colorado survey shows teen cannabis use fell to 10 percent in 2025, down from 21 percent in 2015....


Morocco’s Growth Holds at 4.6% as Agriculture Offsets Economic Pressures
Morocco’s economy grew 4.6% in Q1 2026, driven by a strong agricultural rebound offsetting declines in industry. Services expanded moderately...


Abivax Shares Surge as New Trial Data Eases Safety Concerns Over Ulcerative Colitis Drug
Abivax shares surged nearly 36% after positive updated trial results for its ulcerative colitis drug obefazimod reassured investors following earlier...


El Dorado Raises $9M to Expand Cross-Border Fintech Platform
El Dorado, a Latin American fintech improving cross-border financial services, raised a $9 million Series A led by Paradigm with...


Bitcoin Stalls Near $60K as Strategy Moves, ETFs Outflow, and EU MiCA Rules Take Effect
Bitcoin hovers near $60,000 with ETF outflows, while Strategy boosts reserves, sells BTC, and raises dividends to reassure investors. Ethereum...
 |
|
 |  |
 |
|
-

 Markets6 days ago
Commodity Markets Pause as Oil Falls, Metals Correct, and Grains Show Mixed Signals
-

 Africa2 weeks ago
Egypt’s Net Foreign Assets Rise as External Position Continues Gradual Strengthening
-

 Markets2 days ago
Oil Surges on U.S.–Iran Tensions as Global Markets Show Diverging Trends and Rising Risk Fears
-

 Markets1 week ago
Cocoa Market Faces Mixed Trends Amid Rising Supply and Weak Demand
You must be logged in to post a comment Login