Markets
Shockwaves of War: U.S. Strikes Iran, Markets Teeter, Global Risks Rise
The surprise U.S. bombing of Iran shifts global dynamics, raising fears of wider war and economic disruption. Key concerns include oil and gold spikes, stock market drops, and potential conflict escalation involving Russia or China. The Fed held rates steady, angering Trump. Rising bond rates amid global instability and high debt could worsen economic fragility.

Once again, war has broken out that could have a negative impact on the price of oil. It’s something that seems to happen every now and then. Starting with the Arab oil embargo of 1973, which was a direct response to the U.S.’s support of Israel as a result of the Yom Kippur War, the world has experienced a number of oil shocks. The current war with Iran appears to be just the latest.
WTI Oil and Fed Rate 1982–2025
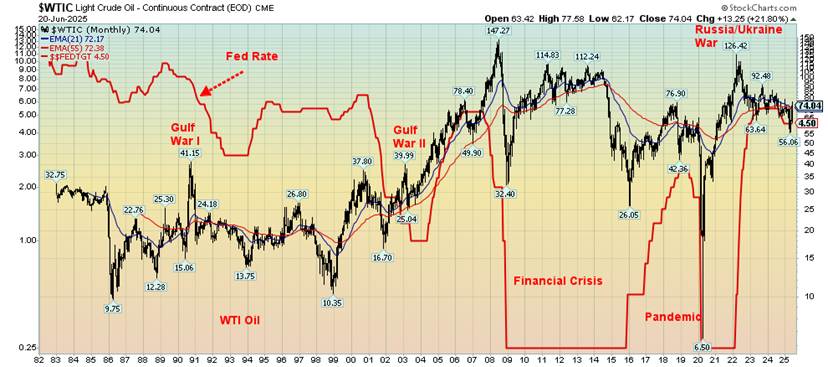
How the war will evolve remains to be seen (Note: This was written before the entry of the U.S. into the war). Since the 1973 Arab oil embargo, we’ve experienced the Iranian hostage crisis of 1979, Gulf War I (1990), Gulf War II (2003), the Russian/Ukraine War (2022) and now another Iranian war. The world consumes roughly 97 million barrels of oil per day. Of that, roughly one-third or about 31.5 million barrels per day comes from the Middle East. Therefore, any supply disruption in the Middle East has a profound impact on the price of oil in the world.
The top five Middle East oil producers are Saudi Arabia, Iran, Iraq, Kuwait, and the United Arab Emirates (UAE). But the two key ones are Saudi Arabia and Iran. The five also hold the largest reserves. There is an estimate of at least 1.7 trillion barrels of oil in the world. The Middle East has almost half of the world’s oil reserves—hence, the importance of the Middle East in the supply of oil, the production of oil and by extension the price of oil.
Yes, the U.S. is the world’s largest producer of oil, producing about 13.5 million barrels per day, but the U.S. consumes roughly 20.5 million barrels per day, the world’s largest consumer. The remainder has to be imported primarily from Canada, Mexico, Saudi Arabia, Iraq, and Brazil. Most comes from Canada. The U.S. also exports oil products, primarily to Mexico and China. Iranian oil is mainly destined for China, whether under sanctions or not. Hence, China has a great interest in what is going on in Iran, even as they could make up the difference by importing from elsewhere, particularly Saudi Arabia, which has the capacity to expand production.
Natural gas (NG) is also important. Iran is the world’s third largest producer of NG and holds the world’s second largest reserves behind Russia. Russia, Iran, and Qatar dominate in reserves of NG. The U.S. is mostly self-sufficient in NG. Because of its location, the U.S. does import NG that comes mainly from Canada.
Spikes in oil prices are inflationary as our chart on the annual changes of the U.S. CPI shows. Spikes occurred at the time of the Arab oil embargo, the Iranian hostage crisis, Gulf War I, and to a lesser extent Gulf War II. The rise in the 2000s was mainly because of the rise of Asia and China, resulting in sharply increased demand. It peaked in 2008 when the financial crisis got underway. The Russia/Ukraine War in 2022 was also behind the spike in inflation in 2022, although not the only cause.
One interesting thing is the history of oil price lows. They do seem to follow a pattern. The low was in 1973, but the next significant low was in 1986, 13 years later. After that, the next significant low was in 1998, 12 years later. The low in 2008 was 10 years from 1998 and the low in 2020 was 12 years from 2008. The average is just under 12 years with a range from 10–13 years.
Merriman (www.mmacycles.com) calls the range 10–14 years. The next one is due in 2030–2034. Merriman also cites a subset of the 12-year cycle at four years, although these lows would not be as dominant as the ones on the 12-year cycle. In the interim, the price pressure is to the upside, not the downside, as we remain in
the positive period after the last significant 12-year cycle low. The reality is, we need to get over $80/$85 to suggest we could break out to over $100. Inflation-wise, we’d have to get over $200/barrel to be equivalent to the 2008 high. Is that possible if the crisis in the Gulf intensifies? The Straits of Hormuz, where 20%+ of the world’s oil passes, remain vulnerable, even if many believe that Iran could not shut it down but could disrupt it. Oil today is not as important to the global economy as it was back in 1973 at the time of the Arab oil embargo. Dependency has been falling over the years.
U.S. CPI Annual Percentage Change 1970–2025
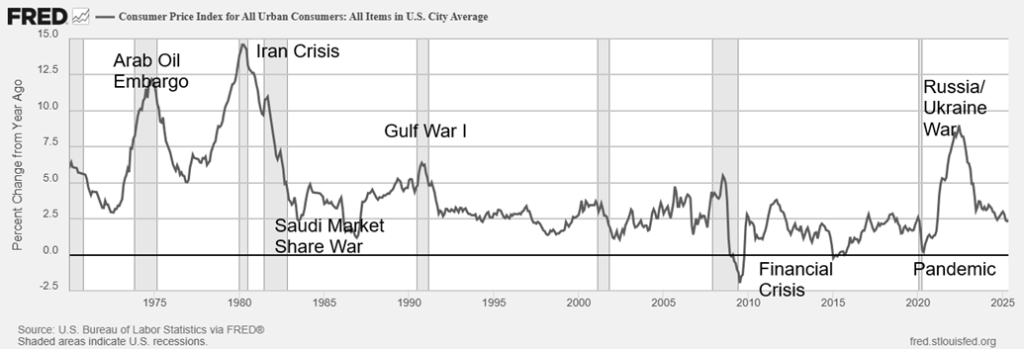
Spikes in oil prices were almost always followed by recessions. The 1973–1975 recession followed the Arab oil embargo, the 1980–1982 recession followed the Iranian hostage crisis, and the 1990 recession followed Gulf War I. Although the 2007–2009 recession was mostly financial, oil prices had spiked into 2008, thanks to huge increases in demand from Asia, particularly China. No recession has followed the oil spike in 2022 after the onset of the Russia/Ukraine War.
Currently, it is estimated that the world has enough oil and reserves to last another 47 years. Coal supplies could last well in excess of 400 years and natural gas upwards of 150 years. New supplies of oil are hard to find in environmentally sensitive locations or under the ocean. The reality is, oil prices need to be higher to make those resources viable. “Drill, baby, drill” is the mantra, but first one needs higher oil prices to make it happen. Plus, deal with environment protests, indigenous protests, and more.
Renewable energy makes up almost 30% of global electricity needs and is sure to grow. Irrespective of this, oil and gas will remain important going forward. Don’t expect the use of oil or gas to end anytime soon. Nonetheless, there are estimates that 90% of global energy could come from renewables by 2050. That would certainly end dependence on oil, gas, and coal and the risk of supply disruption.
The war is expensive, as is being reported by Geopolitical Futures (www.geopoliticalfutures.com):
“A week after launching its assault on Iranian nuclear facilities, Israel’s war effort is already proving costly, potentially limiting its ability to sustain a protracted conflict. According to the Wall Street Journal, Israel could be spending up to $200 million per day on air defense alone. Just one launch from the David’s Sling system costs $700,000, while Arrow 3 missiles cost $4 million. Additional costs include operating F-35 fighters, which each cost about $10,000 per hour, as well as refueling and precision-guided munitions. Estimates indicate a month of war with Iran will cost Israel approximately $12 billion. Reconstruction for damage caused by Iranian counterstrikes is already estimated at $400 million.”
Despite all the turmoil with Iran, plus sanctions, Iran is maintaining its shipments to China. It has been reported that, according to vessel tracking data, Iran has shipped 2.2 million barrels of crude per day this past week. It’s the highest total in five weeks. To avoid disruptions, it’s loading tankers in smaller batches and moving floating storage vessels closer to China, its main buyer. (Source: www.geopoliticalfutures.com, www.reuters.com). There is also a railway that was built as a part of the Belt and Road Initiative (BRI) that links China and Iran.
Nonetheless, it has been reported that Israeli strikes against Iranian oil and gas facilities could severely disrupt the flow of both oil and gas from Iran. Storage and refinery depots have also been hit. All this heightens the risk that Iran may try to disrupt the Straits of Hormuz. Whether it would be successful or not remains to be seen. Any attempt to block the Straits would bring in the U.S. for sure to keep the Straits open. At that point the war could expand into something much bigger.
But we are in the here and now, and right now there is risk that oil prices could go higher if the war in the Middle East intensifies. However, its global impact today is a lot less than it was in 1973, 1979, and even 1990. Add in 2008 and even a sharp rise to over $100 might not cause much of a slowdown in global economies. At $200 it could be different story.
Add in the danger of rising inflation, the potential for a sovereign debt default, the massive amount of debt in the world particularly the U.S., the potential for interest rates rise not fall. Expanding the war in the Mid-East is a dangerous escalation. The risks of a global financial crisis are also rising. The second half of 2025 looks increasingly questionable as political and economic turmoil rises.
Chart of the Week
Canadian Dollar 2020–2025
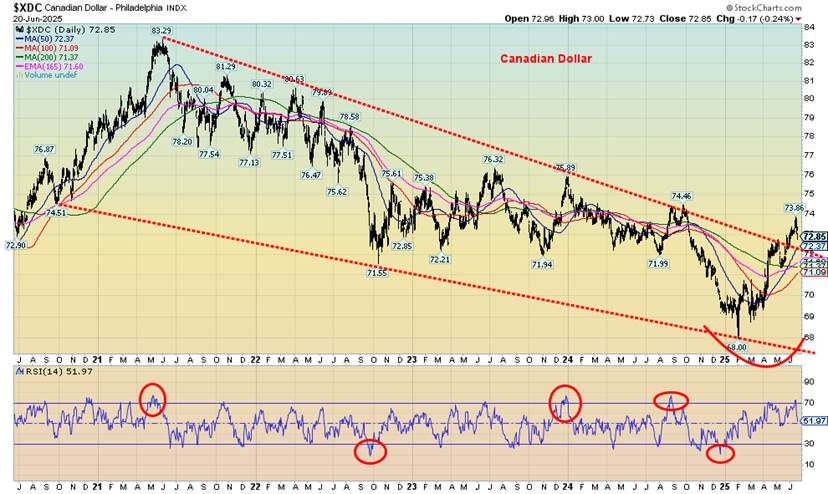
Has the Canadian dollar broken out? It appears that way as the Cdn$ broke above the downtrend line that had been in place since the high in 2021. If that’s correct and it holds, then things will become somewhat cheaper for Canadians traveling to the U.S. Or maybe it won’t make any difference as tourist visits from Canada to the U.S. have fallen precipitously since President Trump has repeatedly earmarked Canada to be the 51st state.
Nonetheless, the breakout is most likely a welcome relief for some. There is the risk of the inevitable test of the breakout level near 72.25. Targets for the Cdn$ could be up to 86.75. The high in 2021 was 83.29. There could be resistance at 76, 78 and 80. A breakdown under 71.00 ends any thoughts of a higher Cdn$. Under 69.50 new lows are possible.
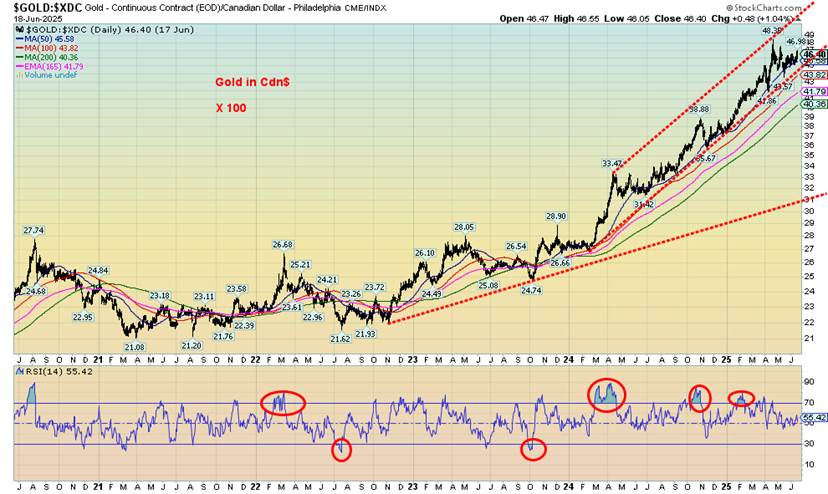
If there is one thing that has been positive about the weak Cdn$, it has been seen in the price of gold expressed in Cdn$. Since that low in 2021 at $2,108, gold in Cdn$ is up 220%. From the comparable low for gold in US$, it is up 202%. Hence, the currency effect because of the weaker Cdn$. With the Cdn$ rising now against the US$, it could slow the rise of gold expressed in Cdn$ even as gold in US$ continues to rise.
What it does highlight is that gold is a hedge against currency devaluation. As the currency falls relative to the US$, gold rises faster. That’s evident in the differentiation between the return on gold in Cdn$ and gold in US$. Another reason to hold some gold.
Gold in Cdn$ has been in a straight-up move now since October 2024. So far, it is showing as a nice clear bull channel. However, a break under $4,350 could be trouble, and under $4,200 even more trouble. Support seems to be down around $4,000.
Note: you have to multiply the price by 100 to get the correct price.
While the Cdn$ has broken out of the long downtrend line, it is not out of the woods. A move over 75.00 would confirm the breakout. Until then, the Cdn$ remains vulnerable to at least a test of the breakout line. A breakdown back under 72.00 would be negative. Under 71.00 we’d be headed lower. Canada is one of the world’s largest producers of oil and holds the third largest reserves behind Venezuela and Saudi Arabia. Iran is number 4 in reserves.
Canada ranks number 9 in natural gas (NG) reserves. Russia and Iran hold the largest NG reserves. In terms of production, Canada ranks number 4 in oil and number 5 in natural gas. Any rise in the price of oil and gas would benefit Canada and most likely strengthen its dollar.
Markets & Trends
| % Gains (Losses) Trends | ||||||||
| Close Dec 31/24 | Close Jun 20/25 | Week | YTD | Daily (Short Term) | Weekly (Intermediate) | Monthly (Long Term) | ||
| ne | ||||||||
| S&P 500 | 5,881.63 | 5,967.84 | (0.2)% | 1.5% | up | up | up | |
| Dow Jones Industrials | 42,544.22 | 42,206.82 | flat | (0.8)% | up | neutral | up | |
| Dow Jones Transport | 16,030.66 | 14,764.80 | 0.5% | (7.1)% | up (weak) | down | neutral | |
| NASDAQ | 19,310.79 | 19,447.41 | 0.2% | 0.7% | up | up | up | |
| S&P/TSX Composite | 24,796.40 | 26,497.67 (new highs) * | flat | 7.2% | up | up | up | |
| S&P/TSX Venture (CDNX) | 597.87 | 711.18 (new highs) | (1.4)% | 19.0% | up | up | up | |
| S&P 600 (small) | 1,408.17 | 1,2996.70 | 0.2% | (7.9)% | up (weak) | down | neutral | |
| MSCI World | 2,304.50 | 2,642.96 | (0.3)% | 14.7% | up | up | up | |
| Bitcoin | 93,467.13 | 103,461.88 | (1.6)% | 10.7% | down | up | up | |
| Gold Mining Stock Indices | ||||||||
| Gold Bugs Index (HUI) | 275.58 | 421.46 | (2.4)% | 52.9% | up | up | up | |
| TSX Gold Index (TGD) | 336.87 | 503.67 | (1.7)% | 49.5% | up | up | up | |
| % | ||||||||
| U.S. 10-Year Treasury Bond yield | 4.58% | 4.38% | (0.7)% | (4.4)% | ||||
| Cdn. 10-Year Bond CGB yield | 3.25% | 3.30% | (2.4)% | 1.5% | ||||
| Recession Watch Spreads | ||||||||
| U.S. 2-year 10-year Treasury spread | 0.33% | 0.47% | 4.4% | 42.4% | ||||
| Cdn 2-year 10-year CGB spread | 0.30% | 0.65% | (1.5)% | 116.7% | ||||
| Currencies | ||||||||
| US$ Index | 108.44 | 98.82 | 0.6% | (8.9)% | down | down | down | |
| Canadian $ | 69.49 | 0.7277 | (1.1)% | 4.7% | up (weak) | up | down (weak) | |
| Euro | 103.54 | 115.17 | (0.2)% | 11.2% | up | up | up | |
| Swiss Franc | 110.16 | 122.20 | (0.8)% | 10.9% | up | up | up | |
| British Pound | 125.11 | 134.43 | (0.9)% | 7.5% | up | up | up | |
| Japanese Yen | 63.57 | 68.43 | (1.4)% | 7.7% | up | up | neutral | |
| Precious Metals | ||||||||
| Gold | 2,641.00 | 3,368.69 | (1.8)% | 27.6% | up | up | up | |
| Silver | 29.24 | 36.01 (new highs) | (0.7)% | 23.2% | up | up | up | |
| Platinum | 910.50 | 1,262.50 (new highs) | 4.5% | 38.7% | up | up | up | |
| Base Metals | ||||||||
| Palladium | 909.80 | 1,042.00 | 1.6% | 14.5% | up | up | down | |
| Copper | 4.03 | 4.83 | 1.9% | 19.9% | up | up | up | |
| Energy | ||||||||
| WTI Oil | 71.72 | 74.03 | 0.8% | 3.2% | up | up | down | |
| Nat Gas | 3.63 | 3.89 | 8.1% | 7.2% | up | up | neutral | |
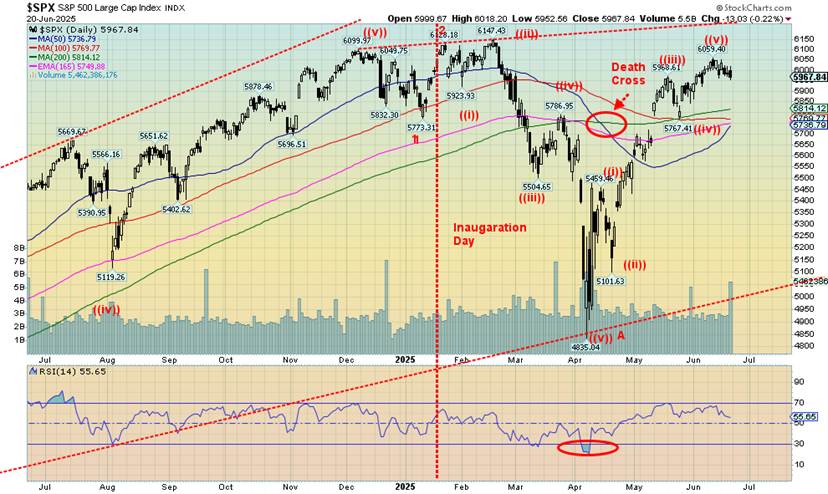
Could the stock market finally be rolling over? Naturally, we can’t say that yet, but we are getting some signs that the powerful up move from the April low may be coming to an end. On June 11, the S&P 500 made a higher high; however, indicators did not confirm the high. It was a small divergence and might mean nothing, particularly if we once again go on to make new all-time highs. However, as we have often noted, sharp rises like we have seen since April are normally not sustainable. So far, any pullbacks have been shallow.
On the week, the S&P 500 fell about 0.2%, the Dow Jones Industrials (DJI) was flat, the Dow Jones Transportations (DJT) rose 0.5%, and the NASDAQ was up a small 0.2%. The S&P 400 (Mid) rose 0.6% while the S&P 600 (Small) rose 0.2%. The S&P 500 Equal Weight Index rose 0.2% while the NY FANG Index fell 0.2%. Bitcoin fell 1.6% on the week.
In Canada, the TSX Composite was flat after making new all-time highs while the TSX Venture Exchange (CDNX) fell 1.4%. In the EU, the London FTSE fell 0.8%, the EuroNext was down 1.1%, the Paris CAC 40 was off 1.2%, and the German DAX was down 0.7%. The EU is more rattled by the Israel/Iran War than the EU markets were. In Asia, China’s Shanghai Index (SSEC) fell 0.5%, the Tokyo Nikkei Dow (TKN) was up 1.5%, while Hong Kong’s Hang Seng (HSI) fell 1.5%.
At this stage, all we can do is muse as to whether the stock market has topped. If it were to fall, then it could be possible that the Israel/Iran War is expanding, particularly with Trump’s threats to bomb Iran’s nuclear facilities at Fordow which are buried deep underground. Any expansion of the war that brings in the U.S. could then bring in other players such as China and Russia. Plus, attempts could be made to close or at least disrupt the Straits of Hormuz where 20% of the world’s oil flows. Any of these events could rattle markets.
The most recent low was at 5,767 for the S&P 500, so only a move below that would suggest a potential top. A drop under 5,700 would be more significant and confirm a top. Markets often turn on the solstice or, if not, then usually during the first week of January or July. The April low may have been a 4-year cycle low, given it was actually about five years from the pandemic low of 2020. The 4-year cycle range is 3–5 years while the 6-year cycle’s range is 5–7 years.
Sometimes the 4- and 6-year cycle low coincide. But the longer 18-year cycle is due in 2027 +/- 3 years. We suspect that we have yet to make that cycle low. The current market could be key, especially if the S&P 500, along with the DJI and the NASDAQ, fail to make new all-time highs once again. We can’t say that yet. A breakdown under 4,800 (the April 2025 low was 4,835) would confirm we are on our way to a more significant low. Only new highs can keep this market’s upward thrust going.
The Scorecard
Selected Performance Since Inauguration Day 2025
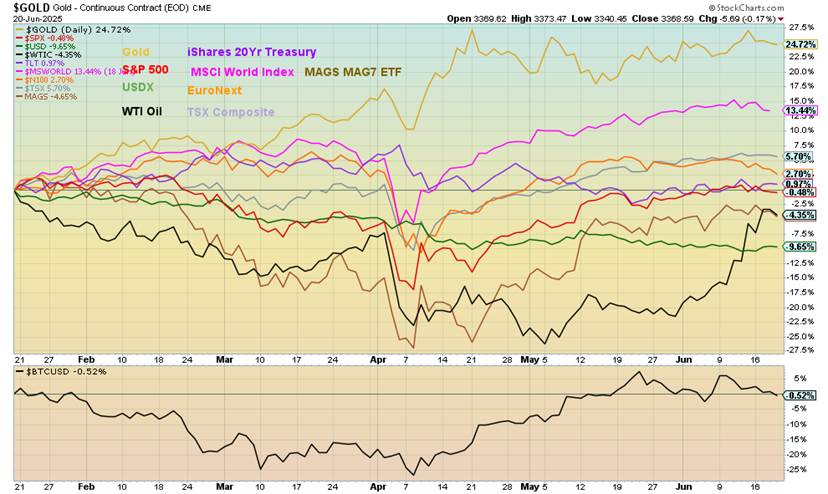
Despite a down week, gold maintains its lead, up 24.7%. The MSCI World Index maintains second place, up 13.4%. WTI oil is still down 4.4%, but its gains of late get it closer to break-even. It’s also no longer in last place as that belongs to the US$ Index, down 9.7%. Canada’s TSX Composite is clinging to a small gain of 1.0% but the S&P 500 is down 0.5%.
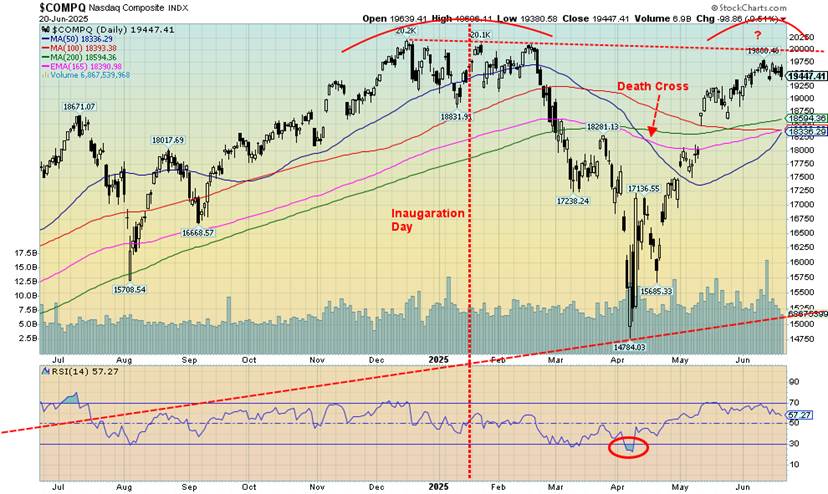
The NASDAQ appears to be rolling over. However, we don’t have any confirmation just yet. A move under 19,250 could start something to the downside, but under 18,600 we could break. The index is potentially near a golden cross to the upside. But it could also fail. The sharp up move from the April low appears to have unfolded in five waves, or we could argue it’s a zig-zag of abc, x, abc. The NASDAQ didn’t make any new highs this past week.
The MAG7 were generally off as the MAG7 ETF MAGS was down 0.4% on the week. Google was a big loser, down 4.6%. Microsoft made all-time highs, again up 0.6%. The NY FANG Index fell 0.2%. It’s not part of the MAG7, but Trump Media (DJT) fell 8.8%. At the other end, Advanced Micro (AMD) rose 10.4%. Tesla was off 1.0%. We could be rolling over or not, but we need a breakdown to confirm. A breakout over 20,000 would ensure new all-time highs ahead.
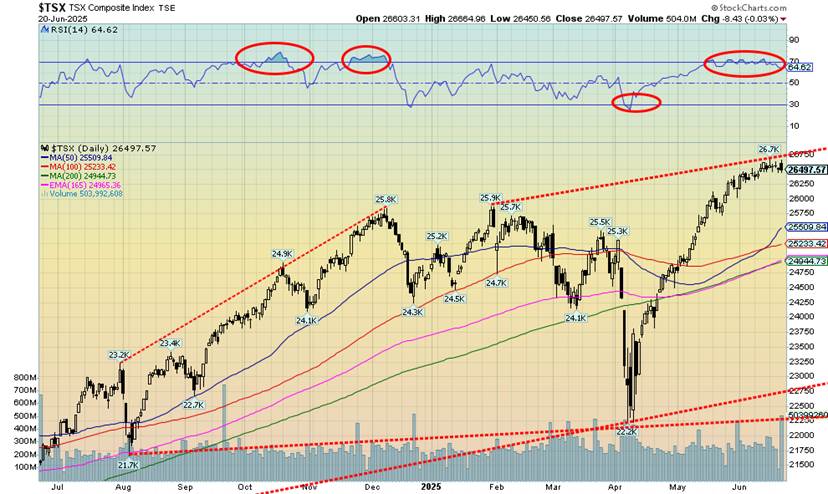
Once again, the TSX Composite hit new all-time highs. The end result, however, wasn’t that great as the TSX reversed and closed flat on the week. The TSX 60 didn’t fare as well and was actually down almost 0.2%, despite also making new all-time highs. The TSX Venture Exchange (CDNX) fared even worse; while it too made 52-week highs at the end, the CDNX was down 1.4%, a negative sign.
The major driver for the TSX was the TSX Financials (TFS) that also made all-time highs, up 1.0% on the week. That was good, but the TFS and Energy (TEN) and Information Technology (TTK) were the only ones up on the week. TEN gained a feeble 0.3% while TTK was up 1.4%. That meant that 11 of the sub-indices were down on the week. The big loser was Golds (TGD), off 1.7%, followed by Materials (TMT), down 1.6%, and Metals & Mining (TGM), down 1.5%. All the others losses were under 1%.
The TSX appears to be rolling over. However, the breakdown remains away, at 26,000. Under 25,750 it’s confirmed and we could head lower. Hard to say just yet as to whether we have made a top. A move over 26,750 would help keep things rising. But the move from the April low has almost been straight up with barely an interruption. Moves like that are not sustainable without some sort of pullback. The Materials sector (Golds, Metals, Energy) remain the key going forward. If they falter and the Financials (TFS) falter, the market is headed lower.
U.S. 10-year Treasury Note, Canada 10-year Bond CGB
As was widely expected, the Fed left the key rate unchanged this past week. In response, President Trump highly criticized Fed Chair Jerome Powell. Trump wanted a 1% cut to help make the carrying cost of the U.S.’s $37 trillion debt cheaper. A nasty fight between the president and the Fed chair remains possible. Powell’s mandate is not up until May 2026. Any fight between the president and the Fed chair would be negative for markets, particularly the bond market. Key foreign buyers are still holding out on buying U.S. treasuries.
The April figures for foreign holdings saw China’s holdings fall $8.2 billion in April. Overall, foreign holdings of U.S. treasuries fell $36.1 billion in April. Notably, Canada’s holdings fell $57.8 billion in April. But Canada wasn’t buying gold as Asian banks in particular have been doing as they convert out of treasuries into gold. Canada divested itself of all of its gold holdings in 2016.
So far, so good as bond yields fell slightly this past week with the U.S. 10-year Treasury note dropping to 4.38% from 4.41%. The Canadian Government of Canada bond (CGB) fell to 3.30% from 3.38%. The 2-year–10-year or 2–10 recession spread saw the U.S. at +47 bp vs. +45 bp while Canada’s 2–10 was +65 bp vs. +66 bp.
Of important economic numbers this past week, retail sales fell 0.9% in May when they expected a decline of only 0.4%. Year over year (y-o-y) retail sales were up 3.3% vs. the expected 4.9%. Initial weekly jobless claims were 245,000, below the consensus of 255,000. But the real story this past week was the Fed interest rate decision and, as noted, the Fed stood pat.
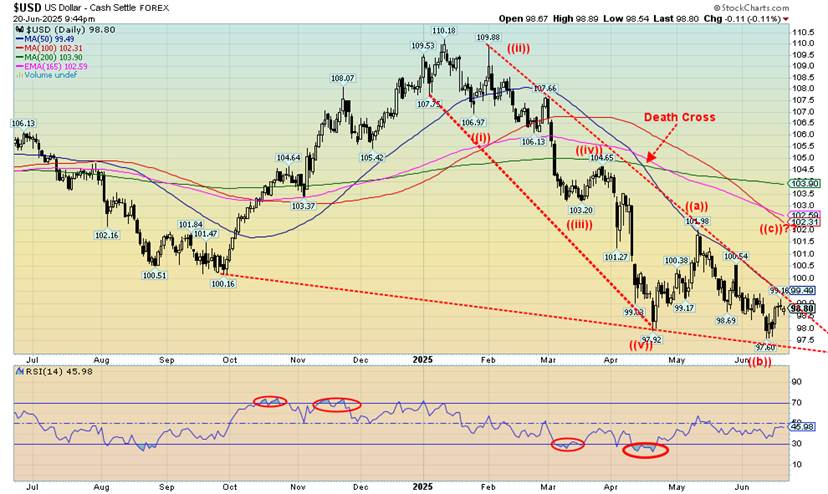
The US$ Index gained on the week as a result of the Iran/Israel conflict. While there are growing concerns about the U.S. both politically and fiscally given its huge debt, the U.S. dollar remains a global safe haven. On the week, the US$ Index gained 0.6%. A rising US$ Index means falling currencies. The euro fell 0.2%, the Swiss franc was down 0.8%, the pound sterling was off 0.9%, while the Japanese yen dropped 1.4%. The Cdn$ suffered as well, losing 1.1%. Despite the gain on the week, the US$ Index remains shy of a breakout.
A move over 99.50 could seal the deal. The US$ Index appears to have fallen in five waves from the early 2025 high of 110.18. Now we appear to be making the correction with a completed A wave and a B wave that actually was slightly below the April low. Are we starting a C wave? That remains to be seen as we need to break out over 99.50, then over 100.50 to confirm. Tempting would be those falling moving averages, currently up near 102/103. If the US$ Index were to break out, that would in turn be negative for gold. Something to keep in mind.
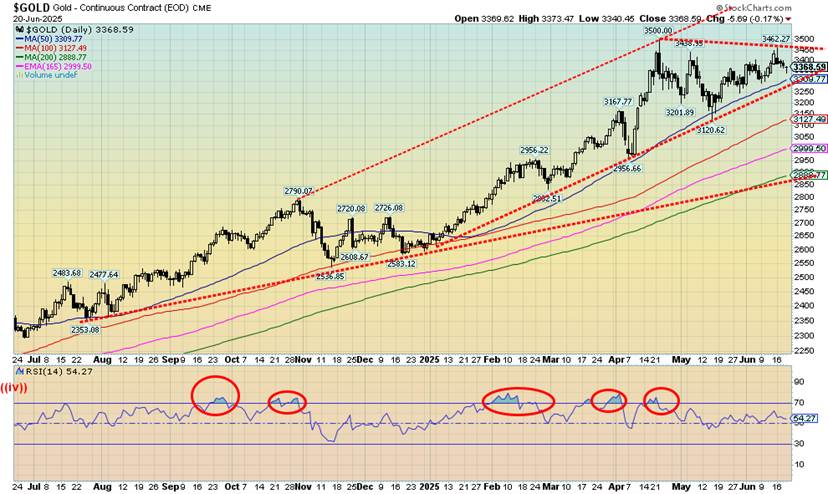
Due to confusion on what may or may not happen in the Israel/Iran war, gold faltered this past week. On the week, we ended down 1.8%. The Fed didn’t help with talk of inflation and no rate cuts, at least until the fall. Silver fared only somewhat better, down 0.7%. However, platinum gained 4.5%, palladium was up 1.6%, and copper rose 1.9%. Copper’s rising is a positive development as often gold follows copper’s lead. Also, silver’s not losing as much as gold we view positively. Nonetheless, a failure to make new highs while silver did is a bit of an unresolved negative divergence.
The goings-on in the Middle East could make or break gold’s near-term performance. For gold bugs, it has been a banner year. Gold is up 27.6%, silver is up 23.2%, and platinum is up 38.7%. Palladium is also up 14.5% and copper up 19.9%. However, it has been the gold stocks that have been on fire, as at week’s end, despite losses for both the TSX Gold Index (TGD) and the Gold Bugs Index (HUI), they are up in 2025 49.5% and 52.9% respectively. Again, while silver made a new 52-week highs, we note that both the TGD and the HUI failed to make new highs this past week. Divergences.
As a follower of cycles, we have often talked about gold’s 7.8-year cycle (range 83–104 months). The low in December 2015 was a major 7.8-year cycle low. The next 7.8-year cycle low occurred in November 2022. So, we are on a new up cycle in the 7.8-year cycle. Typically, that cycle breaks down into two 3.9-year cycles (47 months) or three 2.6-year cycles (31 months). The first 2.6-year cycle low could be due in June 2025 +/- 3-months. So here we are, but a low hasn’t been seen yet. It is possible the low was made in May at $3,120. However, to confirm that low we need to see new highs above $3,500. So far, we have not. Add in the divergence with silver and it remains possible we could have another down thrust to complete the cycle.
That could place a potential low for gold somewhere around mid-July 2025. It would also suggest the pattern that developed from the $3,500 top to be unfolding as an ABCDE-type pattern with ABCD complete and E wave down to come. A break under $3,300 would confirm we are on the E wave down. The drop could take us to $3,100. But if things went off the rails with the end of the Israel/Iran conflict, then we could fall in a worst case to $2,900 and major long-term support. Remember that this would only be the first 31-month cycle low with two more cycles to come. If on the other hand we break to new highs then we are also probably having an expansion of the Israel/Iran war.
If there is a down cycle to the 7.8-year cycle, it is the third 31-month cycle. However, the crest of the current 7.8-year may not come until into that third cycle. Since the 7.8-year cycle could break into two 47-month cycles, it remains possible that we have more to go in the current up cycle. New highs over $3,500 with no new lows could confirm that we are still rising with the 47-month still to crest.
We are short-term cautious on gold right now but long-term bullish. The bull pattern kicks back in with new highs over $3,500 and both gold and silver (and the gold stocks) making new highs. However, if the short-term caution does show, we should bottom sometime next month.
Coincidently, there appears to be a divergence of views on gold’s moves between two of the biggest players, Goldman Sachs and Citibank. Goldman is calling for gold $4,000 in 2026 while Citi is calling for gold to fall below $3,000 in 2026. Could they both be right? It is possible.
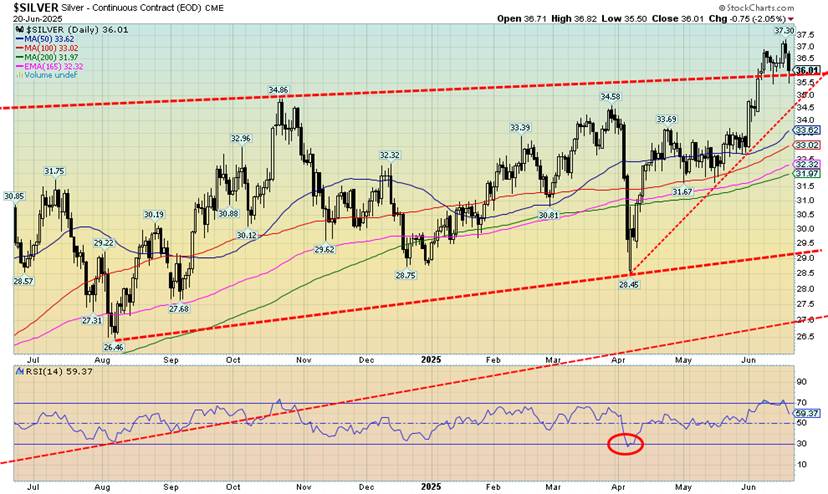
Silver finally broke out and made new 52-week highs. However, we don’t like the way it broke out. Platinum is doing something similar. Both made new 52-week highs this past week, then turned down. Silver ended the week down 0.7%; however, platinum held on to a 4.5% gain. A break now of $35 could suggest a top is in. Under $34.50 a top is in.
There is considerable support down to $32 to $34, but a break under $32 would be negative and we could fall to $29. New highs could end the down discussion. No negative divergences were seen at the top. If the breakout is correct, our target is up to $44. But false breakouts are all a part of the market as they bring in a lot of new players, setting them up for a fall. The bottom line is, a break of $34.50 is negative and could set us on the path towards $32/$34.
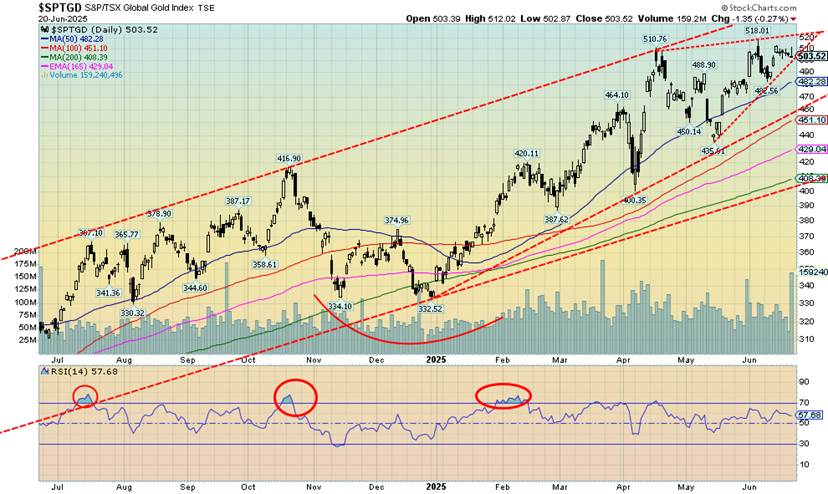
Have the gold stocks made a temporary top? Could be. We topped on the TSX Gold Index (TGD) on April 16 at 510.76. Another higher high top was made on June 5 at 518.01. On both days the high was made, then the market turned down. While the TGD made a higher high on June 5, the indicators did not confirm as all were making lower highs. Now we appear to be turning down from the June 5 top without making another high. All of these are negative divergences. On the week, the TGD fell 1.7% while the Gold Bugs Index (HUI) fell 2.4% as it made the same pattern as the TGD.
A break now of 500 would start to confirm the top and project a fall, most likely to that uptrend line that currently comes in at 460. If we were to take out the recent low at 435, the odds then favour a decline to around 400. Only firm new highs could break this pattern. Another new high that doesn’t firmly take out the June 5 high sets up a pattern we call three thrusts to a high. Once that happens, a larger decline could get underway. It’s a warning.
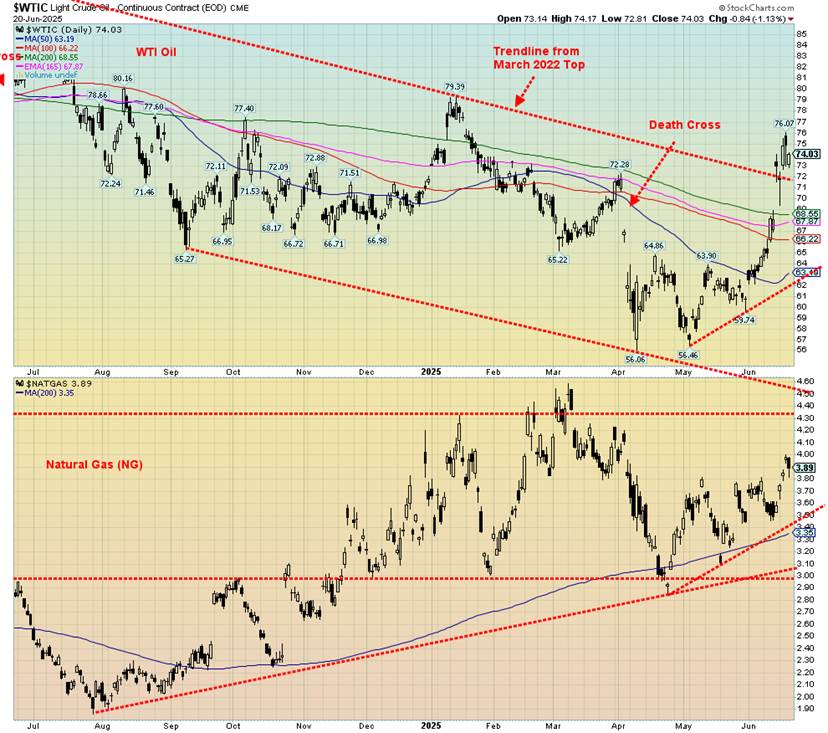
We covered oil prices substantially in our opening. Geopolitical risk is raising the price of oil. We don’t know what President Trump is going to do, given his threats to fully enter the war. The disruptions as a result of the war did cause natural gas (NG) prices to jump this past week. NG at the Henry Hub gained 8.1% this past week while NG at the EU Dutch Hub leaped 9.1%. By comparison, that was more than oil prices where WTI oil gained 0.8% on the week while Brent crude rose 3.5%. The energy stocks responded with the ARCA Oil & Gas Index (XOI) up 0.6% and the TSX Energy Index (TEN) gaining a small 0.3%.
WTI oil may have broken above the downtrend line from the 2022 high, but it is not out of the woods just yet. A move above $80 is needed to confirm the breakout. Above $85–88, the odds rise that we could go up to $100. NG appears to have room to rise to $4.30. If we do new highs are possible.
The Iran/Israel conflict has leaped to the top of the news. It remains unpredictable as to how it will turn out. If the U.S. enters the war, given its threats against Iran’s deep nuclear facilities, it could expand the war and bring in others, notably Russia and China. Then it would be a completely different ball game.
Copyright David Chapman 2025
__
(Featured image by sina drakhshani via Unsplash)
DISCLAIMER: This article was written by a third party contributor and does not reflect the opinion of Born2Invest, its management, staff or its associates. Please review our disclaimer for more information.
This article may include forward-looking statements. These forward-looking statements generally are identified by the words “believe,” “project,” “estimate,” “become,” “plan,” “will,” and similar expressions, including with regards to potential earnings in the Empire Flippers affiliate program. These forward-looking statements involve known and unknown risks as well as uncertainties, including those discussed in the following cautionary statements and elsewhere in this article and on this site. Although the Company may believe that its expectations are based on reasonable assumptions, the actual results that the Company may achieve may differ materially from any forward-looking statements, which reflect the opinions of the management of the Company only as of the date hereof. Additionally, please make sure to read these important disclosures.
David Chapman is not a registered advisory service and is not an exempt market dealer (EMD) nor a licensed financial advisor. He does not and cannot give individualised market advice. David Chapman has worked in the financial industry for over 40 years including large financial corporations, banks, and investment dealers. The information in this newsletter is intended only for informational and educational purposes. It should not be construed as an offer, a solicitation of an offer or sale of any security.
Every effort is made to provide accurate and complete information. However, we cannot guarantee that there will be no errors. We make no claims, promises or guarantees about the accuracy, completeness, or adequacy of the contents of this commentary and expressly disclaim liability for errors and omissions in the contents of this commentary. David Chapman will always use his best efforts to ensure the accuracy and timeliness of all information. The reader assumes all risk when trading in securities and David Chapman advises consulting a licensed professional financial advisor or portfolio manager such as Enriched Investing Incorporated before proceeding with any trade or idea presented in this newsletter.
David Chapman may own shares in companies mentioned in this newsletter. Before making an investment, prospective investors should review each security’s offering documents which summarize the objectives, fees, expenses and associated risks. David Chapman shares his ideas and opinions for informational and educational purposes only and expects the reader to perform due diligence before considering a position in any security. That includes consulting with your own licensed professional financial advisor such as Enriched Investing Incorporated. Performance is not guaranteed, values change frequently, and past performance may not be repeated.


The TopRanked.io Weekly Digest: What’s Hot in Affiliate Marketing [LiveChat Affiliates Review]
Quick Disclosure: We’re about to tell you how LiveChat Affiliates run a top-notch affiliate program. And we really mean it....


German SMEs Face Tighter Bank Lending, Turn to Alternatives
Access to bank loans for German SMEs is tightening despite strong financing needs. About 37.8 percent face restrictive lending, driven...

Bitcoin Stalls as Geopolitical Risks and Crypto Industry Tensions Persist
Bitcoin is moving sideways near $72,000 amid ongoing Iran tensions, while ETF inflows remain strong. Quantum security debates continue. Ethereum...


Geopolitical Tensions and Trade Disruptions Reshape Global Commodities Markets
Geopolitical tensions and disrupted trade routes, especially around the Strait of Hormuz, are reshaping global commodities markets. Agriculture faces supply...


Germany Sees 413 Cannabis Cultivation Clubs Two Years After Partial Legalization
Two years after partial cannabis legalization in Germany, 413 cultivation clubs have been established nationwide. Lower Saxony leads in clubs...
 |
|
 |  |
 |
|
-
 Fintech1 week ago
Credibur Scales Rapidly: €2 Billion in Structured Debt Facilities in Six Months
-
 Crypto5 days ago
Crypto Holds Steady as Tensions Rise and Regulatory Concerns Grow
-
 Crypto2 weeks ago
Bitcoin Slides, Ethereum EEZ Emerges, Worldcoin Hits Low
-
 Crypto2 days ago
Bitcoin Stalls as Geopolitical Risks and Crypto Industry Tensions Persist