Featured
When Rising Interest Rates Might Trigger a Major Default
Highlight of the week was the U.S. CPI that was higher than expected and that triggered another huge swoon in the stock market. Gold, oil also swooned while interest rates rose and the US$ Index jumped higher. The DJI had another 1,200 point drop and gold fell to fresh 52-week lows. But a funny thing happened on the way to the forum. Silver rose on the week instead of falling. And the US$ Index remains short of its previous highs.

“People who exit the market to avoid a decline are odds-on favorites to miss the next rally.”
—Peter Lynch, American investor, mutual fund manager, philanthropist, manager of the Magellan Fund at Fidelity Investments 1977-1990; b. 1944
DJI 2020–2022
We are still out here in Victoria, B.C., enjoying the mountains and the ocean. Tempting it is. But we thought we’d get out a short note on observations from what has been another bad week.
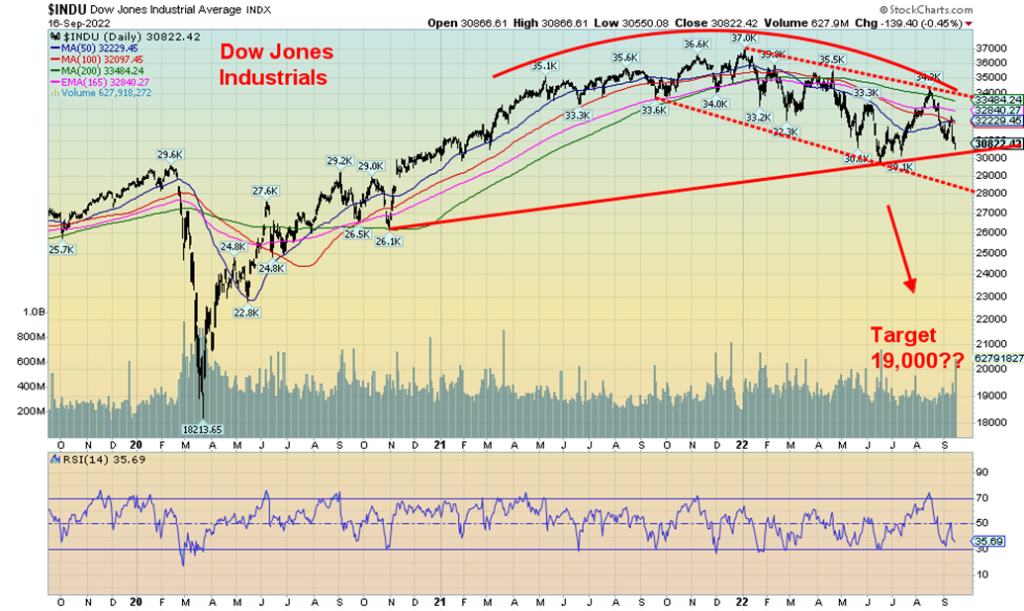
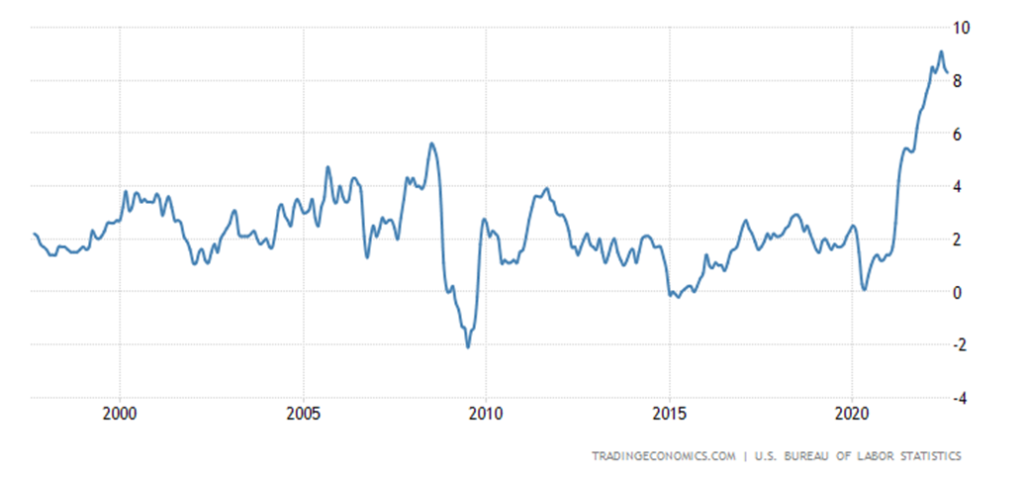
Here we have the Dow Jones Industrials (DJI) down 4.1% this past week, the third down week out of the last four. We are still in the grips of a bear market, thanks to the CPI that came in somewhat disappointingly higher than expected. The market had expected only 8.1% but instead, they got 8.3%. At least that was down from the previous 8.5%. But that set off a storm and the DJI dropped 1,276 points, the eighth worst day on record. The reaction was typical as stocks, gold, and oil all swooned while the U.S. dollar rose as did interest rates with the 10-year U.S. treasury note jumping to 3.45%, just shy of the recent high of 3.50%. The spreads continue to be negative as the 2–10 spread is at negative 43 bp but now we note that the 2–30 spread is also negative at negative 36 bp. The recession is still in the works. But given strong job numbers and a few other economic numbers coming in positively few are loath to say we are officially in a recession. Monthly (long term) stock market trends are close to turning down (see markets and trends at the end), joining the daily (short term) and weekly (intermediate) trends to the downside. We haven’t seen that since 2008.
U.S. CPI Rate 1997-2022
But what has become concerning here is the potential for the DJI, along with the other indices, to go into a bigger swoon. Thanks to Dagmar for bringing it to my attention. The three-year chart of the DJI appears a huge rounding top pattern. Rounding tops can develop over days, weeks, months, and even years. We have drawn the potential neckline of the pattern and that currently comes in around 30,000. What happens if that breaks?
The drop-through that level could come large and swift. The rounding top pattern suggests a drop to potentially 19,000, a decline of 38% from current levels and 49% from the January high. Minimum targets would be around 27,000 with everything else in between. Volume could start to pick up as the decline progresses. At current levels, we are not too far from that potential neckline. In 2008 the crack came at 11,000 and in no time the DJI had fallen to under 8,000 during the Lehman Brothers crash. One shouldn’t be too complacent that this couldn’t happen.
Complacency has always loomed large for markets prior to a crash. The Arab oil crisis and Watergate helped trigger the 1973-1975 crash; sharply higher interest rates and inflation helped trigger the 1980-1982 recession; sharply rising trade deficits were behind the 1987 stock market crash then coupled with rising inflation and interest rates the 1990-1991 recession was upon us helped in no small manner by the Iraq invasion of Kuwait; the collapse of the Russian economy led to the 1998 crash; the overblown, overvalued high tech/dot.com market coupled with 9/11 triggered the 2000-2002 collapse and recession; the sub-prime crisis triggered the 2007-2009 crash and recession spiked further with the collapse of Lehman Brothers; and, the pandemic triggered the March 2020 crash and brief but steep recession.
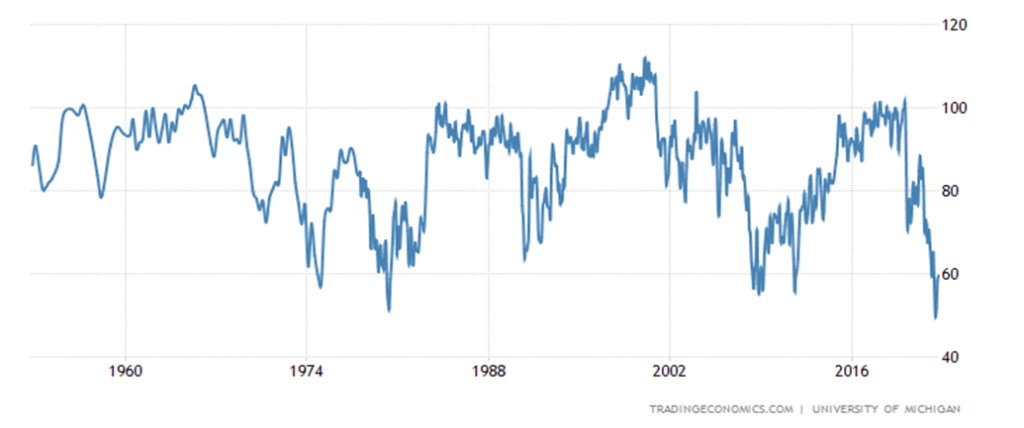
What will be the trigger? Well, next week the FOMC meets and now we hear rumors that the rate hike could be as high as 1.00%. Or something else? A huge unexpected default? And it is September—crash month. The Michigan Consumer Sentiment report that came in better than expected at 59.5 now does not seem so rosy. It’s still the lowest seen in roughly 40 years.
Michigan Consumer Sentiment Index 1957-2022
Gold 2020–2022
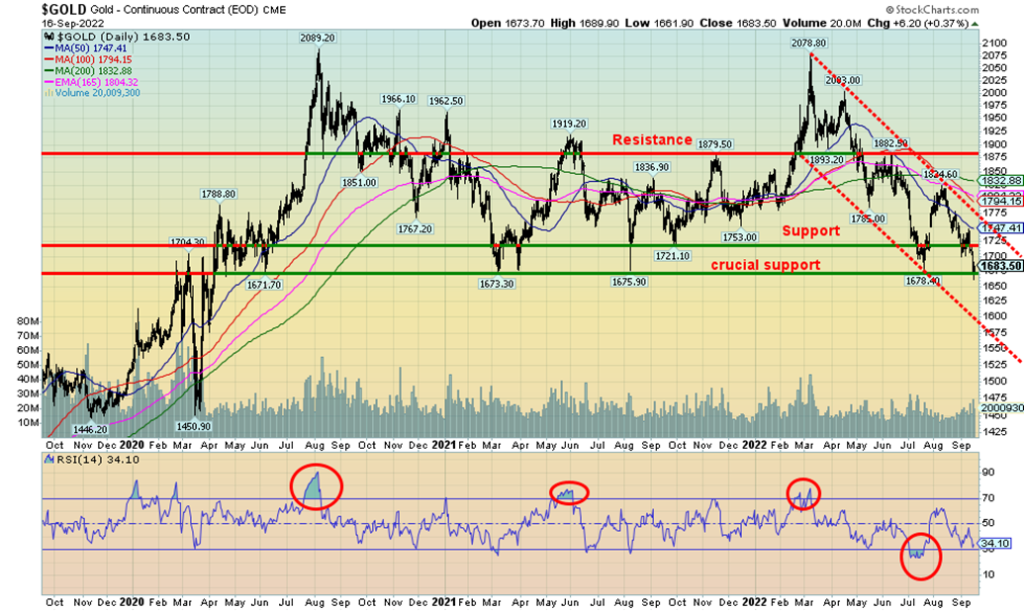
But wither gold? Gold did not have a very good week either, falling at one point 3% on the week to fresh 52-week lows and briefly breaking the March 2021 low of $1,673. Then we bounced on Friday, even as the stock markets swooned. The bearish sentiment for gold is very high. We have noted that the commercial COT for both gold and silver is the best we’ve seen in over two years. The last time the COT was this good it led to that big run-up in 2020, taking gold to a record $2,089. Right now, we are sitting on crucial support at around that $1,675 level, a level seen in March 2021, again in August 2021, and more recently in July 2022. The question is, will we crack? The low on the week was seen at $1,662. Strangely there seemed to be a lack of stops under $1,675 which might have triggered a larger decline. Is it a failed probe? We don’t know yet.
In testing there this past week we note that gold was falling to new lows; however, silver, platinum, and the gold stocks represented by the Gold Bugs Index (HUI) and the TSX Gold Index (TGD), did not see new lows. Nor was the US$ Index making new highs. In July it was the reverse. Gold didn’t make new lows but silver, the HUI, and the TGD did at the time and the US$ Index was at new highs. A divergence? Ideally, we’d like to view all of this as positive going forward. The alternative is a breakdown under the $1,675 and we get a 2013 washout that could take gold as low as $1,250 and silver to $12. No surprise that we are currently seeing a lot of bearish forecasts for gold and precious metals. Gold is trash according to many.
We look back at periods of previous crashes in the stock market and we note that in 1987, 2002, 2008, and 2020 gold and the PMs turned up before the stock market turned up. That’s one reason we were buoyed on Friday seeing gold slightly higher, even as the stock market turned lower once again. Our resistance zones remain the same. Gold must clear above $1,740 and then above $1,780/$1,800 and $1,820/$1,830 to help confirm a low. Meanwhile, any probe under $1,675 has to remain on low volume. However, if there are a lot of stops there, the pros will find them and take them out.
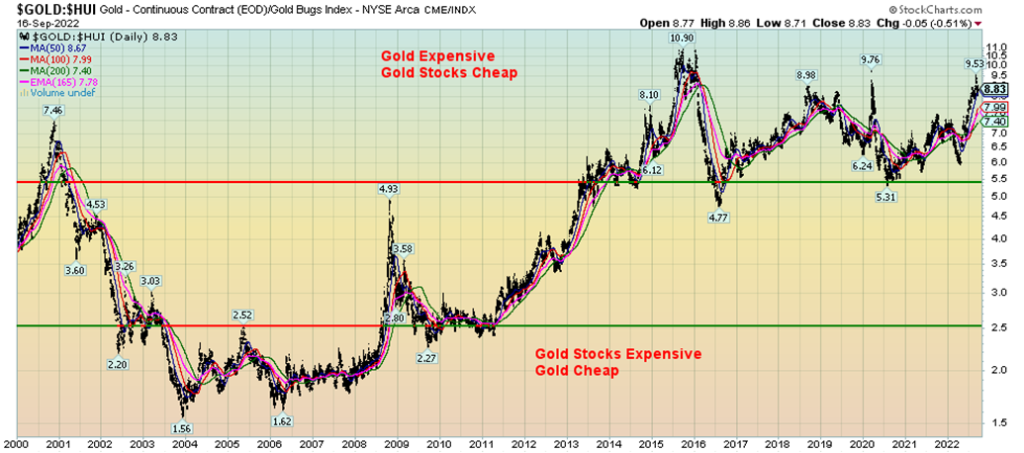
The sentiment for the gold stocks as represented by the Gold Miners Bullish Percent Index (BPGDM) is at the lowest levels seen since the March 2020 crash. It also remains above the levels seen in 2013 and 2015 and 2016 but not by much. The Gold/HUI ratio at 8.83 remains deep in gold expensive, gold stocks cheap territory. Indeed, it has been in that territory mostly since 2013. As much as we would like to say that this can’t last forever it keeps on lasting. It seems we have been forming that huge symmetrical triangle top forever. It will shift in favor of the gold stocks. However, even we question when. We do see ongoing accumulation in the gold stocks.
Gold/HUI Ratio 2000-2022
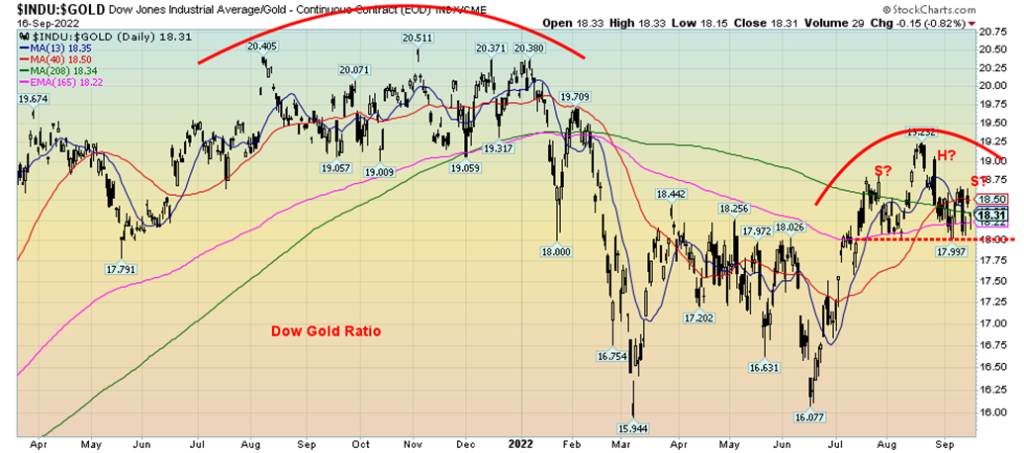
But it is also no surprise that we are seeing a shift potentially towards favoring gold over stocks. Our chart below of the Dow Gold Ratio shows a possible topping head and shoulders pattern. A break under 18 could trigger a sell-off with potential targets down to 16.75.
Dow Gold Ratio 2021-2022
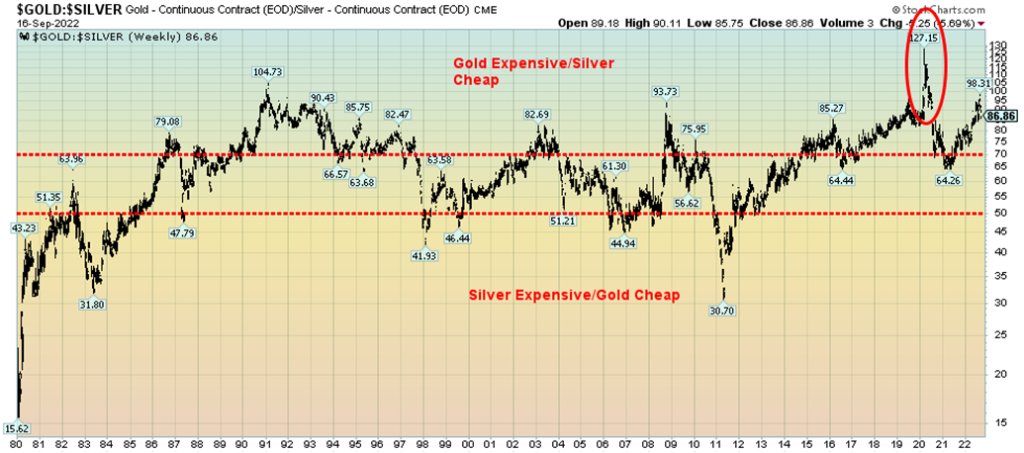
Finally, this week’s rally in silver, likely due to a short squeeze, has shifted the gold/silver ratio slightly in favor of silver. Like gold vs. the gold stocks, the gold/silver ratio has been overwhelming in favor of gold over silver. This week’s rally for silver against the backdrop of gold making new 52-week lows is encouraging for silver. Still the gold/silver ratio still must break under 65 to really shift the conversation to silver over gold. But at this stage we’d rather be long silver.
The deleveraging in the markets continues. And that includes a housing which is still in the early throes of its overdue (painful) correction. But pain is what bear markets are all about and out of it comes change. Hopefully positive change. But as confidence in the economy swoons gold usually shines.
Gold Silver Ratio 1990-2022
Markets & Trends
| % Gains (Losses) Trends | ||||||||
| Close Dec 31/21 | Close Sep 16/22 | Week | YTD | Daily (Short Term) | Weekly (Intermediate) | Monthly (Long Term) | ||
| Stock Market Indices | ||||||||
| `S&P 500 | 4,766.18 | 3.873.33 | (4.8)% | (18.7)% | down | down | up (weak) | |
| Dow Jones Industrials | 36,333.30 | 30,822.42 | (4.1)% | (15.2)% | down | down | neutral | |
| Dow Jones Transports | 16,478.26 | 12,825.34 | (8.8)% | (22.2)% | down | down | neutral | |
| NASDAQ | 15,644.97 | 11,448.40 | (5.5)% | (22.6)% | down | down | neutral | |
| S&P/TSX Composite | 21,222.84 | 19,385.88 | (2.0)% | (8.9)% | down | down | up (weak) | |
| S&P/TSX Venture (CDNX) | 939.18 | 630.06 | (2.4)% | (32.9)% | down | down | down | |
| S&P 600 | 1,401.71 | 1,144.98 | (4.1)% | (18.3)% | down | down | neutral | |
| MSCI World Index | 2,354.17 | 1,848.80 | 0.3% | (21.5)% | down | down | down | |
| Bitcoin | 47,907.71 | 19,650.17 | (3.5)% | (59.0)% | down | down | down | |
| Gold Mining Stock Indices | ||||||||
| Gold Bugs Index (HUI) | 258.87 | 190.75 | (4.1)% | (26.3)% | down | down | down | |
| TSX Gold Index (TGD) | 292.16 | 229.91 | (2.3)% | (21.3))% | down | down | down | |
| % | ||||||||
| U.S. 10-Year Treasury Bond yield | 1.52% | 3.45% | 3.9% | 127.0% | ||||
| Cdn. 10-Year Bond CGB yield | 1.43% | 3.15% | 0.6% | 120.3% | ||||
| Recession Watch Spreads | ||||||||
| U.S. 2-year 10-year Treasury spread | 0.79% | (0.43)% | (79.2)% | (154.4)% | ||||
| Cdn 2-year 10-year CGB spread | 0.48% | (0.66)% | (112.9)% | (237.5)% | ||||
| Currencies | ||||||||
| US$ Index | 95.59 | 109.74 | 0.2% | 14.8% | up | up | up | |
| Canadian $ | .7905 | 0.7527 (new lows) | (1.9)% | (4.8)% | down | down | down (weak) | |
| Euro | 113.74 | 100.15 | (0.3)% | (12.0)% | down | down | down | |
| Swiss Franc | 109.77 | 103.63 | (0.5)% | (5.6)% | down (weak) | down | down | |
| British Pound | 135.45 | 114.23 (new lows) | (1.5)% | (15.7)% | down | down | down | |
| Japanese Yen | 86.85 | 69.96 | (0.2)% | (19.5)% | down | down | down | |
| Precious Metals | ||||||||
| Gold | 1,828.60 | 1,683.50 (new lows) | (2.6)% | (7.9)% | down | down | neutral | |
| Silver | 23.35 | 19.38 | 3.3% | (17.0)% | neutral | down | down | |
| Platinum | 966.20 | 901.00 | 2.8% | (6.8)% | neutral | down | down | |
| Base Metals | ||||||||
| Palladium | 1,912.10 | 2,112.70 | (3.0)% | 10.5% | neutral | neutral | down (weak) | |
| Copper | 4.46 | 3.52 | (1.4)% | (21.2)% | down (weak) | down | neutral | |
| Energy | ||||||||
| WTI Oil | 75.21 | 84.76 | (2.3)% | 12.7% | down | down | up | |
| Nat Gas | 3.73 | 7.76 | (3.0)% | 108% | down | up | up | |
__
(Featured image by Yiorgos Ntrahas via Unsplash)
This article may include forward-looking statements. These forward-looking statements generally are identified by the words “believe,” “project,” “estimate,” “become,” “plan,” “will,” and similar expressions. These forward-looking statements involve known and unknown risks as well as uncertainties, including those discussed in the following cautionary statements and elsewhere in this article and on this site. Although the Company may believe that its expectations are based on reasonable assumptions, the actual results that the Company may achieve may differ materially from any forward-looking statements, which reflect the opinions of the management of the Company only as of the date hereof. Additionally, please make sure to read these important disclosures.
David Chapman is not a registered advisory service and is not an exempt market dealer (EMD) nor a licensed financial advisor. He does not and cannot give individualised market advice. David Chapman has worked in the financial industry for over 40 years including large financial corporations, banks, and investment dealers. The information in this newsletter is intended only for informational and educational purposes. It should not be construed as an offer, a solicitation of an offer or sale of any security. Every effort is made to provide accurate and complete information. However, we cannot guarantee that there will be no errors. We make no claims, promises or guarantees about the accuracy, completeness, or adequacy of the contents of this commentary and expressly disclaim liability for errors and omissions in the contents of this commentary. David Chapman will always use his best efforts to ensure the accuracy and timeliness of all information. The reader assumes all risk when trading in securities and David Chapman advises consulting a licensed professional financial advisor or portfolio manager such as Enriched Investing Incorporated before proceeding with any trade or idea presented in this newsletter. David Chapman may own shares in companies mentioned in this newsletter. Before making an investment, prospective investors should review each security’s offering documents which summarize the objectives, fees, expenses and associated risks. David Chapman shares his ideas and opinions for informational and educational purposes only and expects the reader to perform due diligence before considering a position in any security. That includes consulting with your own licensed professional financial advisor such as Enriched Investing Incorporated. Performance is not guaranteed, values change frequently, and past performance may not be repeated.


Ecobnb Turns Sustainable Tourism Into Measurable Impact
Ecobnb’s sustainable tourism platform generated significant environmental and social impact in 2025, avoiding 58,207 kg of CO₂ and adding 583...


Sugar Markets Balance Biofuel Demand and Global Supply
Sugar markets in New York and London were mostly unchanged as the Iran conflict renewed interest in biofuels. Drought concerns...


The $40 Trillion Trap: Disinflation Is Not Deliverance
U.S. debt has reached $40 trillion, with $24 billion weekly interest, while deficits accelerate. Despite disinflation in CPI, from cooling...


FinTech Matures as AI and Infrastructure Drive the Next Growth Phase
Fintech markets are entering a mature phase, shifting from rapid growth to consolidation, specialization, and sustainable business models. Zurich and...


Bitcoin, and Ethereum Rise, While Cardano Enters Transition
Bitcoin and Ethereum posted modest weekend gains, supported by ETF inflows. A new proposal may protect Bitcoin from quantum threats....
 |
|
 |  |
 |
|
-

 Crypto2 weeks ago
SpaceX Bitcoin Move Sparks Debate Amid Market Uncertainty
-
 Crypto1 week ago
Bitcoin Rally Faces Tests from Fed, ETFs, and Market Fear
-

 Impact Investing2 weeks ago
Milione Secures €80M EIB Financing to Drive Venice Airport’s Green Transformation
-

 Biotech4 days ago
Legend Biotech: Growth Driven by CAR-T Innovation and Carvykti Expansion