Featured
Where is the gold sector heading?
In contrast to the depression I predicted earlier this year, I am now predicting some of the best economic data on record to be reported in late June and July. Of course, this will only mean we are moving from a deep depression to a seriously bad recession. Determining the direction of real interest rates—and therefore, the direction of gold—is critical.

The sad truth is that few people really know very much about gold, especially when it comes to investing in the metal. They don’t understand what makes it so valuable and unique, and they know even less what moves its price. Since I don’t want to spend an hour on why it is so precious, I’ll just try and sum it up in a sentence: Gold is extremely rare, beautiful, portable, transferable, divisible without losing value, and virtually indestructible. Very few things on this earth can meet all those criteria, and that is why it is the most perfect form of money humankind has ever found.
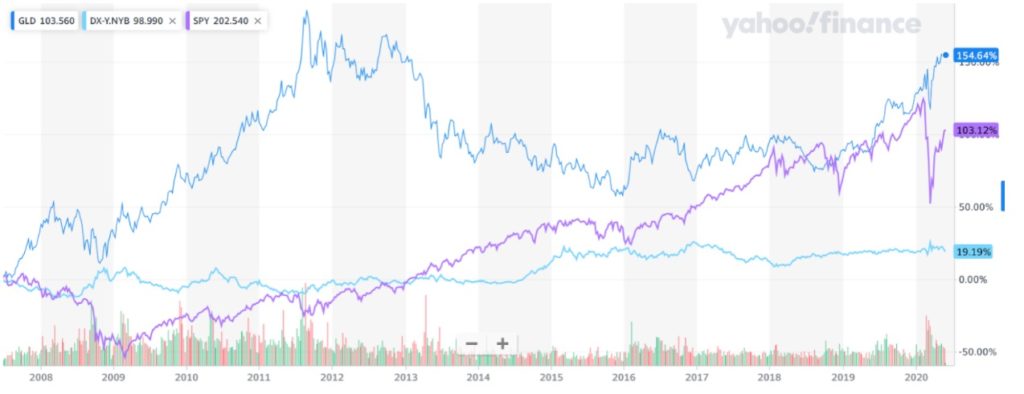
Now more than ever, investors desperately need to know what really influences the dollar price of gold. This is the case given the unprecedented falsification of asset prices and debt monetization taking place today. Gold is not driven by the fear of a crash in the major market averages. Nor is it even primarily concerned about the inverse correlation to the U.S. dollar (USD). Indeed, the massive interest rate suppression scheme by the Fed since the Great Recession has been the main reason behind the outperformance of gold compared with the S&P 500. This is true even in the context of a rising USD.
This is why the astute investor begins his portfolio allocation with a 5% investment to physical gold.
The above chart proves that a secular gold bull market can and does occur while the USD and stocks are rising. So then, what does have the highest correlation with the price of gold? The direction of real interest rates is what matters the most. Hence, it is always important to determine both the direction of nominal interest rates along with the rate of inflation in factoring in how much above the minimum 5% physical gold allocation investors should garner.
If nominal Treasury yields are rising in the context of relatively benign Consumer Price Inflation (CPI), then gold may significantly underperform. This is especially the case with the miners, which are simply a leveraged play on the price of the metal. It is clear that exposure to miners during a gold bear market can be a very dangerous thing.
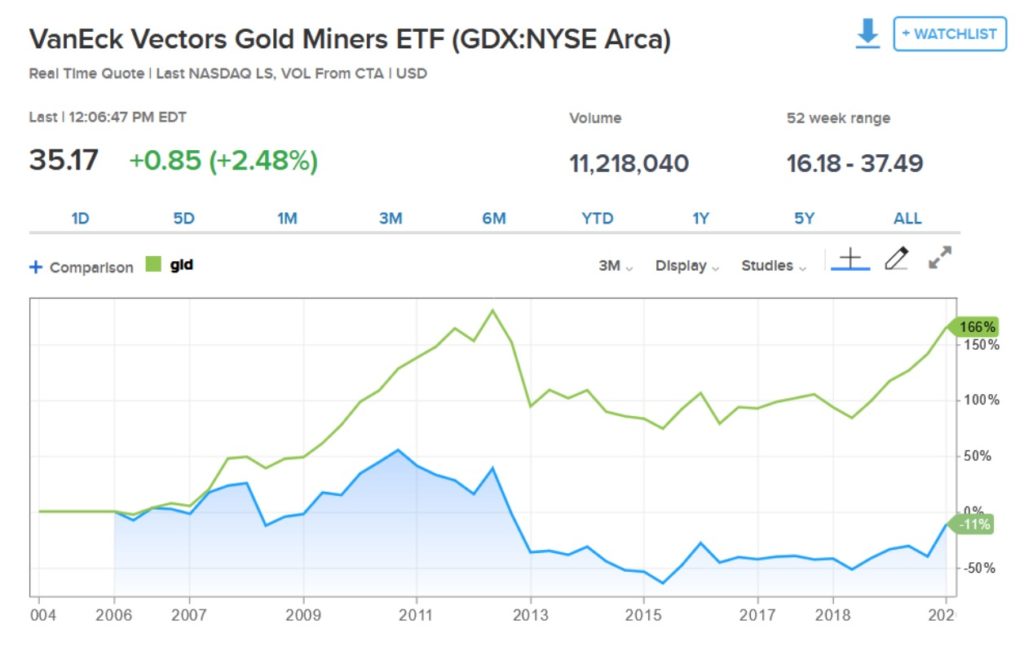
However, when bonds yields fall in the context of rising inflation, gold can really boost your overall performance. Just take a look at the Gold Miners Index (GDX) shown in blue vs. the Physical Metal (GLD) shown in green in the chart below.
The truth is physical gold competes with cash and the “risk-free rate” on U.S. Treasuries. This comparison is calculated by using the interest your money receives in the bank and/or sovereign bonds, minus the rate of decline in its purchasing power (inflation). This is what hedge funds and the machines on Wall Street are most focused on. Another way of looking at this is that the carrying cost of gold moves in tandem with real interest rates. Therefore, the ideal scenario for gold ownership is when real interest rates are falling. And, that environment is best when nominal interest rates are virtually zero and inflation is rising. This means the carry cost on gold becomes negative, while the lost opportunity for holding cash is next to nothing.
So, where does the gold sector go from here? Well, we can be fairly certain that the Fed will peg the short end of the yield curve at zero for the foreseeable future. But the salient question remains to what extent Mr. Powell will allow longer-duration Treasury yields to rise. Our central bank rejoined the ECB and BOJ in the yield capping game back in Mid-March when the 10-year Note shot up to 1.26% on March 18, from 0.31% on March 9. Such volatility in Treasury yields is indeed off the standard deviation chart and scared the Fed out of its mind. Since then, Mr. Powell has authorized the purchase of $1.5 trillion worth of bonds during the past ten weeks. However, as yields have since settled back into the mid-single-digit range, the Fed has reduced its purchases from the peak of $75 billion per day to just $4.5 billion. For now, the bond market is ok with Fed tapering in the context of a $4 trillion annual deficit.
Perhaps this is because the predicted depression is now here. For example, in 1930, the U.S. Gross Domestic Product plunged by 8.5%. Economists now predict that 2020 GDP will crash by 6% after a sharp rebound from Q2, which is expected to suffer an output catastrophe of more 52.8%, according to the Atlanta Fed! This type of data is helping to suppress yields even while the Fed exits the market. Hence, yields are still near record lows.
In contrast to the depression I predicted earlier this year, I am now predicting some of the best economic data on record to be reported in late June and July. Of course, this will only mean we are moving from a deep depression to a seriously bad recession. Nevertheless, the rate of change in the data will be profound. For example, Continuing Jobless Claims, which surged from 2 million in March, to 25 million in May, will be plunging by the millions each week during the summer. This should still leave the unemployment rate, which is above 20% currently, a budding teenager by year’s end. But again, it is the rate of change in the data that is most important. Will Mr. Powell cap the 10-year Note yield at 1%, or will it be 2%? Or, will he just let real rates rise until gold and the stock market once again fall apart under the weight of surging borrowing cost on an overleveraged corporate sector?
Again, determining the direction of real interest rates—and therefore, the direction of gold—is critical because getting caught on the wrong side of this trade can become a complete portfolio debacle. For instance, from 1980 through 2000, gold fell from $800 to $250 per ounce, as CPI was falling faster than nominal rates. Likewise, it can spare you from the $1,900 to $1050 plunge that took place from 2011 through 2015 when a similar dynamic was in place. By the way, this is also why gold tends to crash during times when the rate of deflation is profound—nominal rates tend to stop around the zero percent floor, but real rates can still rise due to rampant deflation.
Therefore, in the next couple of months, I will be myopically focused on the “better” news and how it affects interest rates and the rate of inflation. An improving economy in the context of a dissipating Wuhan virus–coupled with Fed tapering–could (temporarily) send nominal yields rising much faster than inflation. This is especially true given the ridiculously low level of Treasury yields and the incredible amount of supply that must be taken in by whatever is left of the free market.
But this is the purview of active managers like myself who try to avoid big drawdowns in the portfolio. Of course, in the longer-term stagflation is the most likely macroeconomic destination, which is the perfect storm for gold. The inflation will come from the Fed’s new proclivity towards Helicopter money and its unshrinkable $7 trillion balance sheet that has grown 7-fold in the past dozen years. The stag part will be derived from trillions of dollars in unproductive new debt being issued and the damage it is causing to public and private sector balance sheets.
This means the Fed will be forced to peg the entire yield curve close to the zero-bound range indefinitely, as the economy does not recover sufficiently enough to allow the 10’s of millions of newly unemployed people to find work. Hence, your stated return on risk-free money will be zilch, just as rising CPI causes real yields to fall into record-low territory.
The Conclusion: Knowing when (and when not) to overweight gold in your portfolio can provide an opportunity to vastly increase your overall returns.
—
(Featured image by Michael Steinberg via Pexels)
DISCLAIMER: This article was written by a third party contributor and does not reflect the opinion of Born2Invest, its management, staff or its associates. Please review our disclaimer for more information.
This article may include forward-looking statements. These forward-looking statements generally are identified by the words “believe,” “project,” “estimate,” “become,” “plan,” “will,” and similar expressions. These forward-looking statements involve known and unknown risks as well as uncertainties, including those discussed in the following cautionary statements and elsewhere in this article and on this site. Although the Company may believe that its expectations are based on reasonable assumptions, the actual results that the Company may achieve may differ materially from any forward-looking statements, which reflect the opinions of the management of the Company only as of the date hereof. Additionally, please make sure to read these important disclosures.

-

 Africa2 weeks ago
Mozambique Nears End of Rate Cuts as Flooding Risks Mount
-
 Markets1 day ago
Silver Dips Sharply, While Gold Gains Amid Mixed Stock Market
-

 Crowdfunding1 week ago
EvenFi Launches Run-Off Service to Protect Investors as Crowdfunding Platforms Exit
-

 Crypto5 days ago
Ethereum’s Growing Capacity Puts Pressure on Layer 2 Platforms


