Business
Why markets and the economy continue to rattle on
Another historic week in the U.S. but markets and the economy continue to rattle on. We are seeing some divergences in the indicators suggesting that volatility could heat up. The put/call ratio hit another record low in favour of calls. Bond yields have been rising and spreads between the short and long end are as favourable as they have ever been. That, at least, is great for banks.

The news continues to be earth-shattering. What we have been witnessing over the past couple of weeks is nothing less than a political earthquake. The final chapter has yet to be written. Setting aside the attempted putsch on Capitol Hill and the historic second impeachment of a sitting president, the U.S. economy continues to rattle along. But it is being both shaken and stirred.
The U.S. unemployment numbers are coming in worse than expected. The new COVID-19 strain is sparking a political storm. Stimulus and assistance are being delayed or are insufficient. And coming are more deficits, more debt, and more reckonings. We say this as it applies not only to the U.S. but here in Canada as well and in the EU and elsewhere. For roughly a year now the world has been in a global recession. There is little sign that the world is coming out of it. Q1 is also expected to show negative growth. But beyond that?
As we have noted before, only three economies are expected to grow in 2020: China, Taiwan, and Egypt. The two key ones here are China and Taiwan. They are expected to grow because of the drastic measures they took at the outset to contain the spread of the COVID-19 as a result of their experience with the SARS outbreak in 2002–2004. Compared to the COVID-19 outbreak the SARS outbreak was relatively paltry. As to the West, the response was generally mismanagement almost everywhere. The result is the West is paying a heavy price in cases, deaths, and economic costs. The U.S. is expected to contract 3.7% in 2020, Canada 5.8%, Germany 5.4%, France, 9.2%, the U.K. 11.3% (Brexit not helping), Japan 5.3%, and Italy 9.1%. (Source: The Economist).
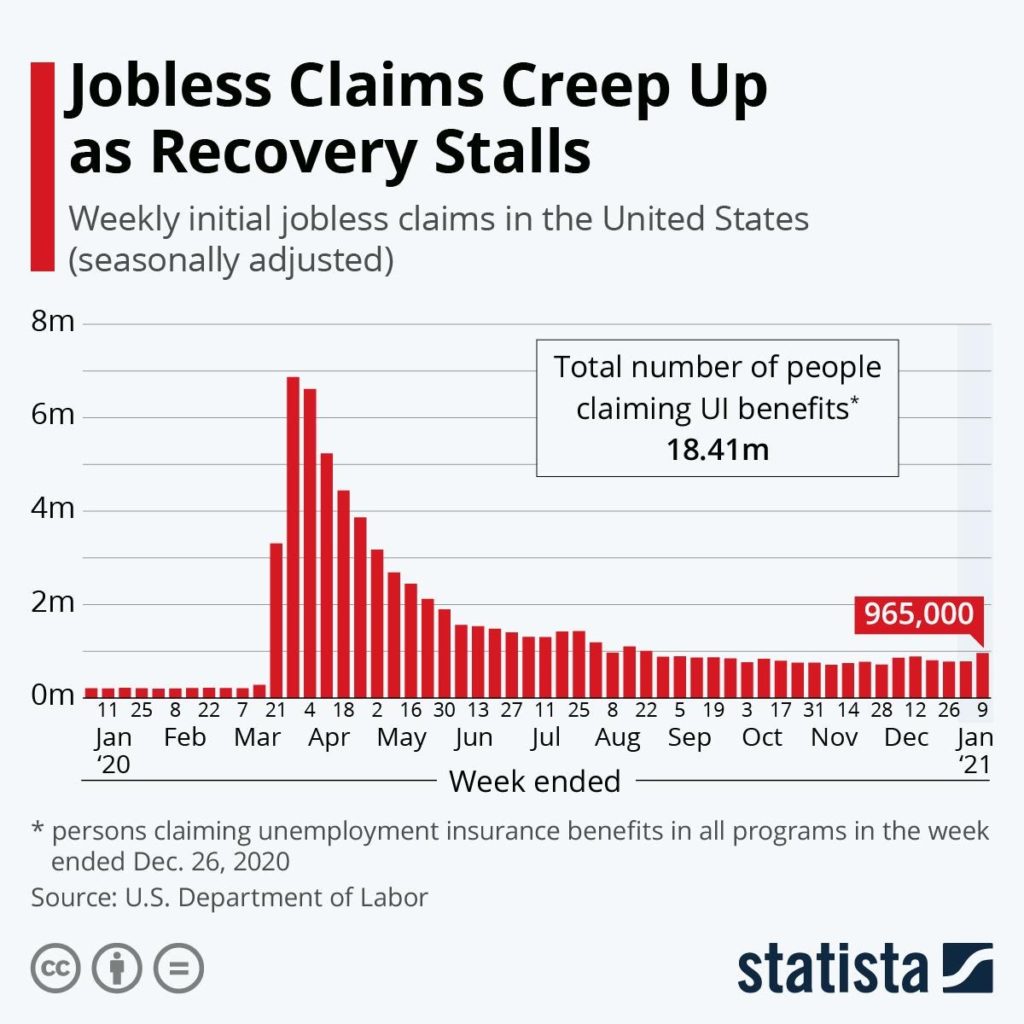
The miss on the employment numbers was quite dramatic. The December nonfarm payrolls came in at a loss of 140,000 jobs when the market had expected a gain of about 75,000 jobs. Then this week’s initial claims missed big time as well as they came in at 965,000, well above last week’s level of 784,000 and well above expectations of 795,000. This was interesting coming when it did. It appears to signal that decisions were made about jobs going forward and what might be needed in 2021.
If that is correct, then the West faces a potentially deeper recession as 2021 proceeds. The drop in December was happening before even the new year started. But the unemployment rate was unchanged, suggesting many more just dropped out realizing there are no jobs to be found. The category not in labour force did rise 115,000 between November and December. Expect that to rise further. The labour force participation rate was unchanged, but we do note the labour force participation rate for Blacks or African Americans fell from 60.2% to 59.8%. The 16–19 age group also saw its rate drop from 35.8% to 35.7%. As well, the rate for the 65 and older group saw their participation rate fall from 24.1% to 23.7%. We wouldn’t be surprised to see the labour force participation rate fall further. Even in Canada, the latest labour force participation rate fell to 64.9% from 65.1% in December. And that is down from the 65.5% rate in February 2020 before the full outbreak of the COVID-19.
With the unemployment situation deepening, it is probably no surprise it is linked to the still rising COVID-19 numbers, a record death toll in the U.S., and announced lockdowns. The vaccine may be out, but it will be months before the positive effects from the vaccine are seen. In the interim, a new strain has taken hold. That is not surprising as many predicted that would happen. But will the vaccine work on that? The U.S. has had days where the death toll has exceeded 4,000. The past seven days have an average of over 3,300/day. Since the beginning of the year the U.S. has added over 3 million cases and over 40,000 dead. The goings-on in Washington have taken some of the attention away from the COVID-19 but the reality is, it is still raging. The U.S. regularly records 250,000 cases a day.
And all of that brings the next link. More stimulus. The talk is a $1.9 trillion stimulus package from the incoming Biden administration. The question is, how will it proceed? Will it have broad bipartisan acceptance? Already there is pushback against it. Will it be at the top of the agenda? Or will it be pushed back by Senate hearings on the impeachment of Trump. The incoming senate also has to deal with Biden’s cabinet picks. The result is a potentially overcrowded senate in the early days of the Biden administration as it tries to sort out the priorities. Yet the stimulus cheques that have been delayed time and again are badly needed to prop up Main Street as it wallows in unemployment with thousands facing eviction.
And that in turn adds to the debt. By the time Trump officially leaves office on January 20, 2021, the national debt under his watch will have increased $7.8 trillion or 39%. Naturally, that will be compared to the Obama era where the national debt climbed $9.3 trillion or 87%. But the biggest part of that was due to the 2008 financial crisis and the growth was over 8 years, not 4 years. Under Biden the debt is sure to continue to explode upward. By 2025 the national debt could be $50 trillion, not quite double from current levels. But that forecast, which is at the high end of forecasts, was irrespective of who was in the White House. Official forecasts of debt from the Office of Budget Management (OMB) and the Congressional Budget Office (CBO) pegged the debt at anywhere from $28.0 trillion to $31.7 trillion. The reality is likely somewhere in between. Given the current debt is $27.8 trillion we are already at the lower end estimate.
With a debt to GDP ratio already at 130%, the debt is an economic drag. By 2025 that ratio could be as high as 200%. The budget deficit balance is already almost 15% of GDP and could climb further. But if the Fed is purchasing a big chunk of the debt the U.S. might be able to manage it just as Japan has with a debt to GDP level of 270% already. However, the choice is between additional stimulus and debt or a deeper economic contraction and possibly even a depression.
The question on everyone’s mind is, when does the debt spark an inflationary death spiral à la Weimar Germany or Zimbabwe? Given the U.S. remains the world’s reserve currency they have a distinct advantage over both of those basket cases. But, as we note in our Chart of the Week, the U.S. dollar remaining the world’s reserve currency is not a given. The problem is down the road and probably at least a decade away, but it is a growing one and that in turn engenders other conflicts.
One of the more interesting aspects out of last week’s insurrection in Washington and the historic second impeachment of a sitting president was the response of corporate America. Rather than stand by, many corporate CEOs have condemned the insurrection and the result is that Trump and Trump companies are paying a price. Shopify took down Trump’s online stores, while Stripe, PayPal, and Square cracked down on the processing of payments, Deutsche Bank announced they will no longer deal with Trump and could be calling in his loans, the PGA pulled out of his golf tournament and his golf clubs, and New York City is ending contracts with the Trump organization. Many have announced the end of political donations.
But the most fascinating was the cultural backlash as Google (GOOG), Amazon (AMZN), and Apple (APPL) pulled the plug on Parler, a social media platform. And Twitter (TWTR) and Facebook (FB) pulled the plug on Trump using their social media web sites. It should be noted all of these are private companies so use of their web services is effectively at their discretion. Since January 6 these companies have, for the most part, not fared well. Google is flat, Amazon is off 1%, while Apple is a winner, up 1.8%. But Twitter, the president’s main communication venue, is down 14.3% and Facebook is off 3.9%.
Our chart below of Twitter and Facebook shows Twitter poised to break the long up-trend from the March 2020 lows. Facebook is also showing major distribution and topping action but continues for the moment to hold above support. Both have fallen below the 50-day MA.
The markets appear to be walking themselves into the January 20, 2021 inauguration with prices somewhat under pressure. But there is no sign of an impending bigger breakdown. This coming week could have more fireworks as thousands are planning to march once again on Washington and even state capitols while in Washington 20,000 troops await them. What could go wrong? We live in interesting times.
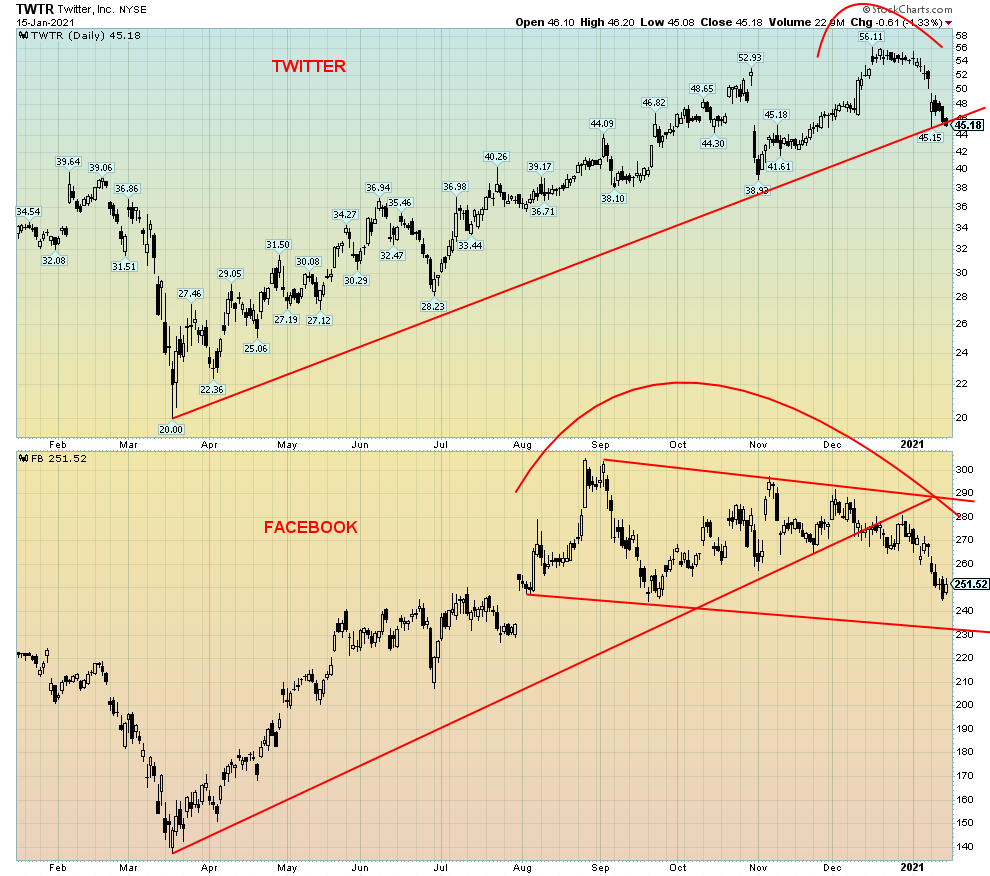
Chart of the Week
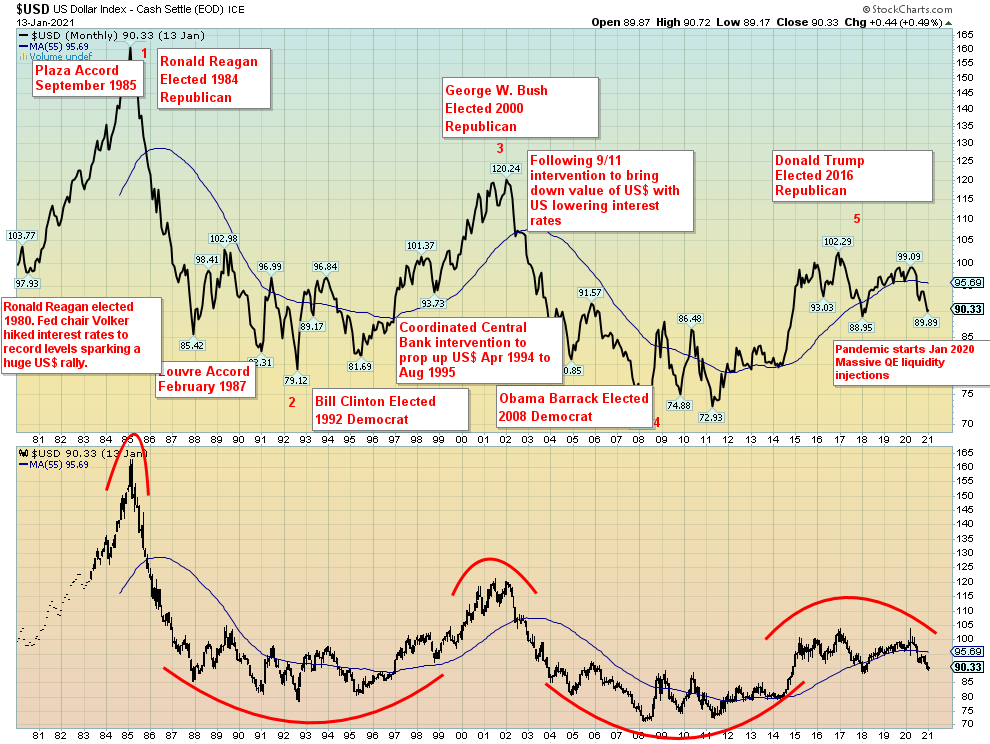
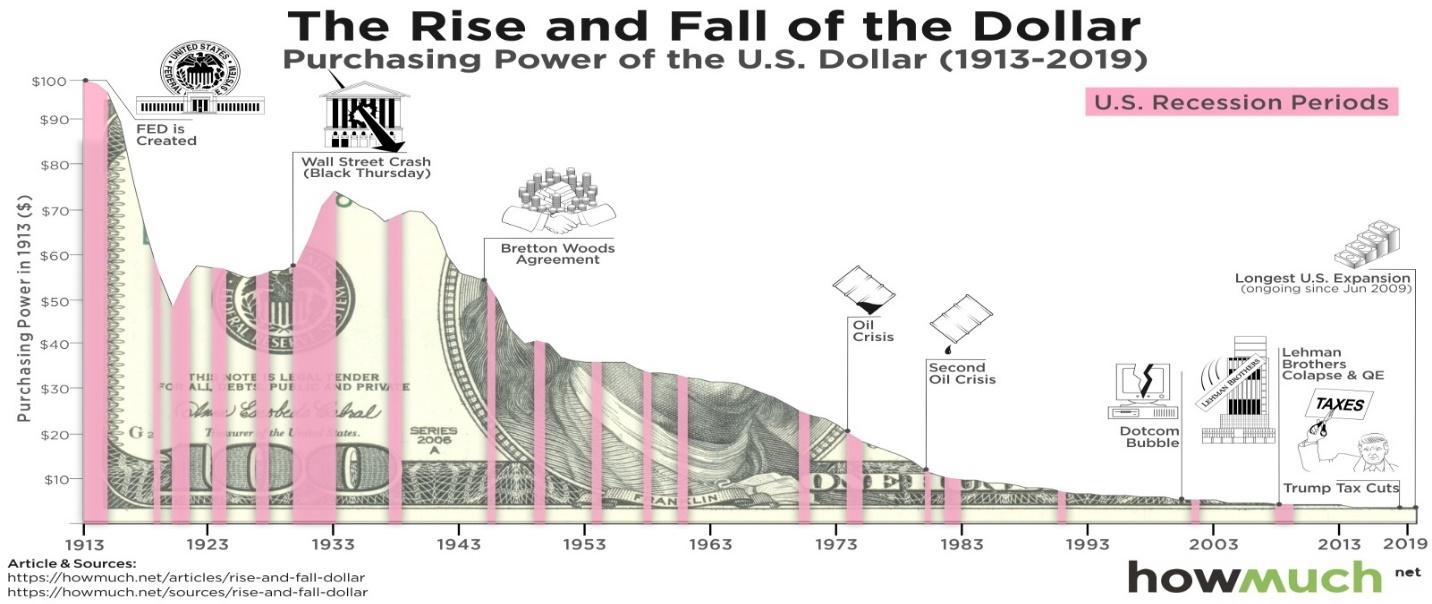
For the past four years, the US$ Index has been forming what appears to be a large top. First in December 2016 at 103.63 and a possible double top in March 2020 at 103.96. (Note: the monthly chart above shows closing highs, not the actual high.) Since then, the US$ Index has fallen below the 55-month MA. This zone has provided both support and resistance since the US$ became free trading in the 1970s, after the end of the US$ being tied to gold in August 1971. By 1973 the Bretton Woods system had completely collapsed and the US$ was set free to float against the major currencies of the world.
The free float of currencies can be both good and bad. One result was the world became more unstable and tumultuous financially. Debt exploded. In 1971 U.S. national debt was $398 billion. Today it is $27.8 trillion, the world’s largest national debt. In 1971 the U.S. trade deficit was $2 billion, the first trade deficit in a century. Today the trade deficit is $867 billion, the largest in the world. In 1971 the US$ was the kingpin, the strongest currency in world, the world’s reserve currency. But as a fiat currency (meaning currency not backed by anything except the promise to pay, like an IOU), the US$ began a long descent in the 1970s.
As can be seen in the chart above, the US$ has followed a rather volatile path for upwards of 50 years with huge downward swings (1971–1980, 1985–1995, 2002–2011), followed by huge upward swings (1980–1985, 1995–2002, 2011–2016). Each time the US$ rose, the high was lower than the previous high and each time the US$ fell the low was lower than the previous low. The classic definition of a downtrend. Grant you, there have been only three major highs over about 50 years (1985, 2002, 2016) and two major lows (1995, 2011).
Given the global dominance of the U.S. after World War II and through the Bretton Woods Agreement in 1944 the US$ became the world’s reserve currency. Why? Because the U.S. was the world’s dominate economy and also dominated trade and finance. As the reserve currency, central banks are obligated to hold large amounts of U.S. dollars to finance international transactions in trade, investments, debt, and commodities. It makes for ease of transaction with everyone using the same currency for international transactions.
But the long decline of the US$ has put the reserve currency status of the US$ in question. The result is central banks are holding fewer and fewer US$s and more of other currencies including the euro, the Japanese yen, the Swiss franc, the Canadian and Australian dollar, the U.K. pound sterling, and the Chinese yuan. The IMF has recognized these eight currencies as global reserve currencies. The US$ remains the dominant currency. The IMF also holds Special Drawing Rights (SDRs), a supplementary foreign currency reserve. Today the SDR is made up of 42% US$, 31% euros, 11% Chinese yuan, 8% Japanese yen, and 8% U.K. pound sterling. It is the rise of the Chinese yuan that bears watching.
In our presentation at the International Money Show in September 2020 we showed how the US$ is latest in a long line of reserve currencies throughout history. The world’s dominant currency was usually associated with the world’s dominant economy and empire at the time. Greece, Rome, the Byzantines, the Moors, the Venetians, the Portuguese, the Dutch, the Spanish, the British, all had their place at one time or another as the world’s most powerful economy and empire and therefore the world’s dominant currency. (https://www.youtube.com/watch?v=P5RiDEhjebM) But in all cases their reign eventually came to an end.
History showed that the life of a reserve currency was roughly 80–110 years. The currency came to the forefront following a long period of build-up. The US$ came into dominance after World War II but its rise really began following the end of WW1. 2020 marked the 100th anniversary of US$ dominance. In the history of world reserve currencies, the US$’s dominance could be nearing its end.
By the end of this decade the world’s most powerful economy is projected to be China, not the U.S. Since the top in March 2020 the US$ Index has been falling. There has been a sharp rise in the debt through QE, zero interest rates, an economy in recession, and political destabilization following the November election. International capital hates uncertainty and right now there is considerable uncertainty surrounding the U.S. economy and the political situation. The result is the US$ Index has fallen about 10% since March.
The U.S. dollar is under threat from digital currencies, gold, and the realization that the IMF and the U.S. cannot necessarily be trusted any more. The U.S. has made moves to try and shut out its alleged enemies from the international payment system known as SWIFT. Since its beginnings, the IMF and SWIFT have been under U.S. control. The countries most impacted include Russia, China, and Iran. China, as a part of its Belt and Road Initiative (BRI), is trying to create not only its own digital currency but a new SWIFT. Already trade in yuan is increasing. The U.S. dollar remains the most dominant but its share is falling. The second most dominant currency is the euro, followed by the U.K. pound sterling. But the use of the Japanese yen and Chinese yuan is rising, particularly the yuan.
Is the end near for the U.S. dollar? No, not immediately for sure. But the direction is down. Interestingly our chart shows the US$ tends to do well under Democrat governments and poorly under Republican governments. The rise of China as the world’s dominant economy sets it on a collision course with the U.S. over who will emerge on top. A reminder that, during other periods where the dominant currency and economy were coming to an end, the world fell into global wars as the dominant economy/currency tried to preserve its status. Does history repeat itself?
History of World’s Reserve Currencies: 1450–Present
Purchasing Power of the U.S. Dollar 1913-2019
MARKETS AND TRENDS
| % Gains (Losses) Trends | |||||||
| CloseDec 31/20 | CloseJan 15/21 | Week | YTD | Daily (Short Term) | Weekly (Intermediate) | Monthly (Long Term) | |
| Stock Market Indices | |||||||
| S&P 500 | 3,756.07 | 3,768.25 | (1.5)% | 0.3% | up | up | up |
| Dow Jones Industrials | 30,606.48 | 30,814.26 (new highs) | (0.9)% | 0.7% | up | up | up |
| Dow Jones Transports | 12,506.93 | 12,946.28 (new highs) | 0.6% | 3.5% | up | up | up |
| NASDAQ | 12,888.28 | 12,998.50 (new highs) | (1.5)% | 0.9% | up | up | up |
| S&P/TSX Composite | 17,433.36 | 17,909.03 | (0.7)% | 2.7% | up | up | up |
| S&P/TSX Venture (CDNX) | 875.36 | 907.99 | 1.3% | 3.7% | up | up | up |
| S&P 600 | 1,118.93 | 1,211.91 (new highs) | 1.8% | 8.3% | up | up | up |
| MSCI World Index | 2,140.71 | 2,179.62 | (1.4)% | 1.8% | up | up | up |
| NYSE Bitcoin Index | 28,775.36 | 35,910.10 | (12.0)% | 24.8% | up | up | up |
| Gold Mining Stock Indices | |||||||
| Gold Bugs Index (HUI) | 299.64 | 284.53 | (5.9)% | (5.0)% | down | down (weak) | up |
| TSX Gold Index (TGD) | 315.29 | 306.59 | (4.5)% | (2.8)% | down | down | up |
| Fixed Income Yields/Spreads | |||||||
| U.S. 10-Year Treasury yield | 0.91 | 1.09% | (2.7)% | 19.8% | |||
| Cdn. 10-Year Bond yield | 0.68 | 0.81% | (1.2)% | 19.1% | |||
| Recession Watch Spreads | |||||||
| U.S. 2-year 10-year Treasury spread | 0.79 | 0.98% | flat | 24.1% | |||
| Cdn 2-year 10-year CGB spread | 0.48 | 0.65% | 4.8% | 35.4% | |||
| Currencies | |||||||
| US$ Index | 89.89 | 90.75 | 0.8% | 1.0% | neutral | down | down |
| Canadian $ | 0.7830 | 0.7860 | (0.1)% | 0.3% | up | up | neutral |
| Euro | 122.39 | 120.79 | (1.2)% | (1.3)% | neutral | up | up |
| Swiss Franc | 113.14 | 112.18 | (0.7)% | (0.9)% | neutral | up | up |
| British Pound | 136.72 | 135.86 | 0.1% | (0.6)% | neutral | up | up |
| Japanese Yen | 96.87 | 96.25 | 0.1% | (0.6)% | neutral | up | up |
| Precious Metals | |||||||
| Gold | 1,895.10 | 1,829.90 | (0.3)% | (3.4)% | down | neutral | up |
| Silver | 26.41 | 24.87 | 0.9% | (5.8)% | neutral | up (weak) | up |
| Platinum | 1,079.20 | 1,089.90 | 1.7% | 1.0% | up | up | up |
| Base Metals | |||||||
| Palladium | 2,453.80 | 2,395.10 | 1.3% | (2.4)% | up | up | up |
| Copper | 3.52 | 3.60 | (1.9)% | 2.3% | up | up | up |
| Energy | |||||||
| WTI Oil | 48.52 | 52.42 | 0.3% | 8.0% | up | up | neutral |
| Natural Gas | 2.54 | 2.74 | 1.5% | 7.9% | up | up | neutral |
Note: For an explanation of the trends, see the glossary at the end of this article.
New highs/lows refer to new 52-week highs/lows.
Markets fell the past week for the first time in five weeks. The S&P 500 dropped 1.5%, the Dow Jones Industrials (DJI) was off 0.9%, the NASDAQ fell 1.5%, but the Dow Jones Transportations (DJT) gained 0.6%. The DJI, DJT and NASDAQ all made new all-time highs on Thursday before falling on Friday, but the S&P 500 did not make a new all-time this week as their high was on January 8. A divergence? Too early and too small to mean anything yet. Also making new highs was the small cap S&P 600 and they gained as well, up 1.8%. Others making all-time highs this past week included the Value Line, the NYSE Composite, the S&P 500 equal weight index, the S&P 400, the Russell 1000, 2000, and 3000, and the Wilshire 5000. After making the new high on Thursday they all fell on Friday. One that didn’t make a new high this week was Bitcoin as it fell 12.0% taking its first hit in a while. Is the party over there? A harbinger?
The TSX Composite fell 0.7% while the TSX Venture Exchange (CDNX) was up 1.8% but short of a new 52-week high. In the EU the London FTSE was down 2.2%, the Paris CAC 40 was off 1.7%, and the German DAX dropped 1.9%. In Asia, China’s Shanghai Index (SSEC) did make new 52-week highs but closed down 0.1% while the Tokyo Nikkei Dow (TKN) did make new 52-week highs and gained 1.4%. The MSCI World Index was down 1.4% with no new highs.
This week is a key week with the inauguration on Wednesday, January 20. Will there be fireworks like we saw on January 6? Even with 20,000 National Guard troops there? What about the state capitals? Demonstrations are planned for Sunday, January 17 as well. We’ll see what happens. But it could be a volatile week. A reminder that on Monday, January 18 the U.S. markets are closed for Martin Luther King Jr. Day. Some irony here somewhere.
One interesting thing we read this week was apparently volumes were historic on the over-the-counter Pink Sheets in December. For those unfamiliar with the Pink Sheets—known affectionately as “the pinks”—it is an over-the-counter market for a lot of penny stocks and really junior start-up companies. Apparently, it traded over $1 trillion worth of shares in December. Never had it been this high. Since the market is totally unregulated it also contains its share of outright scams. But then there are some large foreign companies who don’t wish to be regulated by the SEC who list themselves there even as they are multi-billion-dollar companies with a profile in either the EU or Asia. Many Canadian junior mining stocks also trade in the U.S. on “the pinks.” “The pinks” also has very active chatter boards to talk up the stocks. A mania?
As we note next, the VIX volatility indicator is diverging with the large cap indices. And we note that margin debt is sitting at record highs while the put/call ratio is at record lows. What could go wrong?
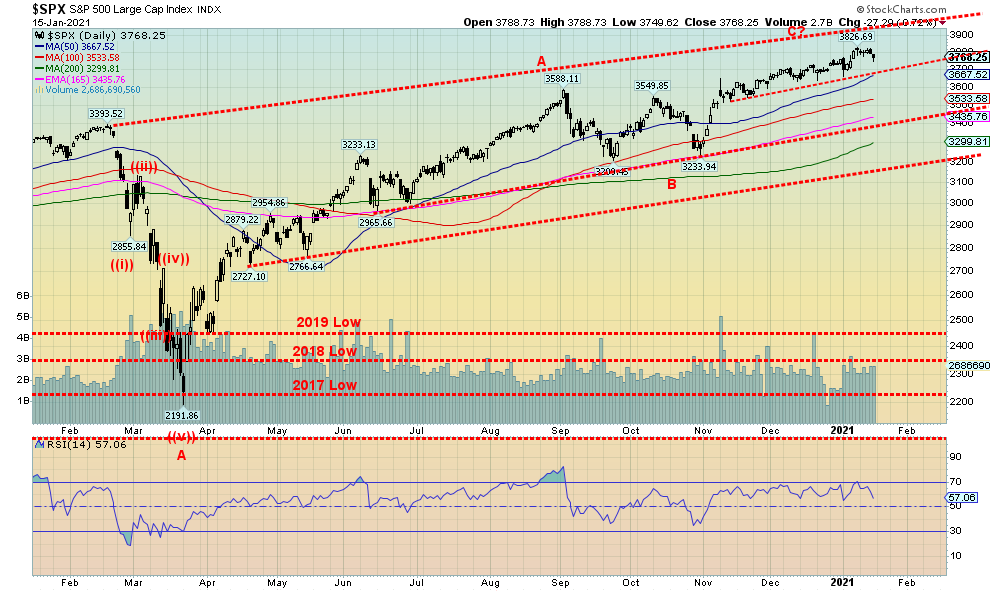
New highs could end any talk of a collapse. The first breakdown zone is at 3,680. That could spark a drop to 3,550 or even down to 3,375 where the S&P 500 would find support. The major breakdown zone remains at 3,200 where below that level a panic could follow. So, this could be a telling week. Are we going to have our blow-off or are we topping out? We’ll see what happens once we are past Wednesday. Irrespective of what occurs, volatility appears to be poised to rise.
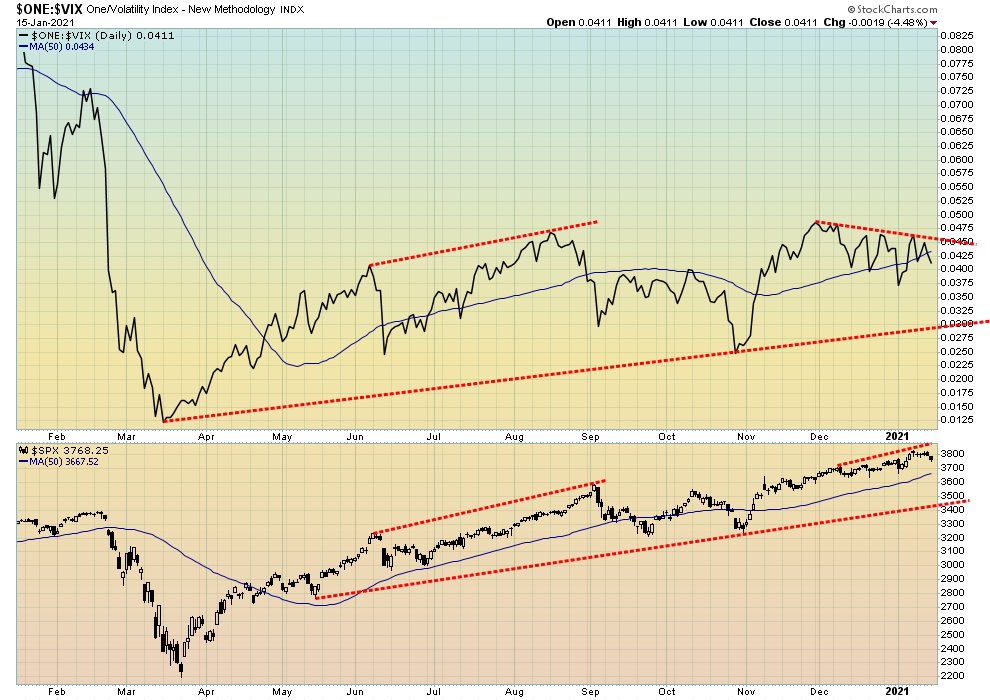
A chink in the armor? The VIX volatility indicator and the S&P 500 are diverging. This has become somewhat more visible over the past few weeks since November as the S&P 500 moved to higher highs while the VIX made lower highs. This divergence suggests that there could soon be a jump in volatility. So, we do have to watch the downside.
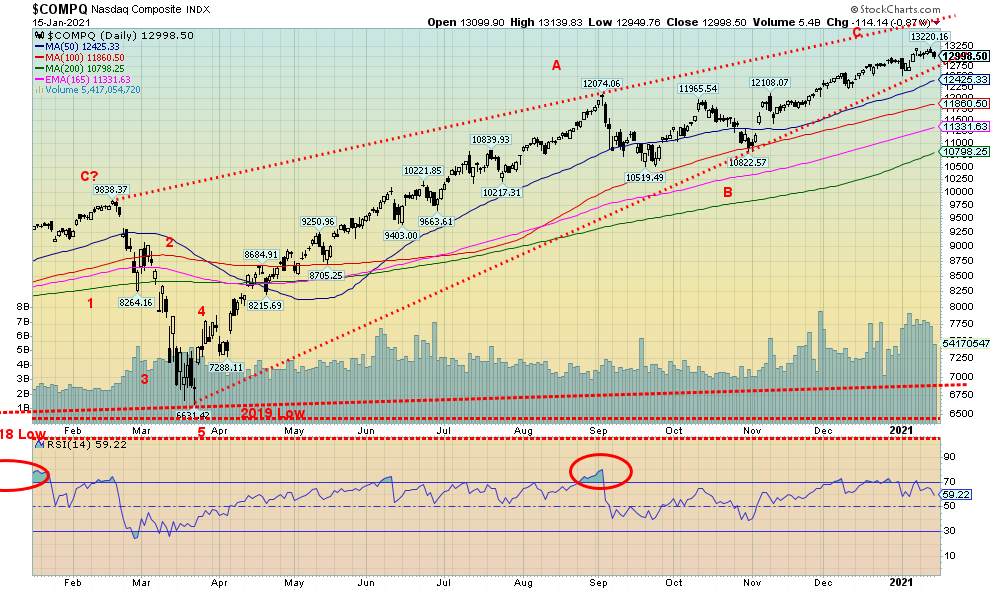
The NASDAQ faltered this week as the FAANGs took a hit. Well, most of them anyway. The NASDAQ fell 1.5% on the week and fell for the first time in five weeks. The NASDAQ did make a small new all-time high at 13,220 this week before closing at 12,998. As to the FAANGs, Facebook fell 6.1%, Apple was off 3.7%, Amazon dropped 2.5%, Netflix was down 2.4%, and Google was down 3.9%. Microsoft dropped 3.2% and Tesla, the star, was down 6.1%. Just to make them feel better Berkshire Hathaway also fell off 0.5%. Completing the social media drop was Twitter, down 12.2%. It should be noted that all the social media stocks took a hit with Trump being booted off Twitter and Facebook and Parler booted by Google and Amazon. Does that mean the social media sites have become socially conscientious? No, it more likely means they are just protecting profits. We could argue that the NASDAQ is making an ascending wedge—a huge one, it seems. Irrespective of this, 12,750 is the first breakdown area but a breakdown under 12,000 would be more important. New highs would end any breakdown talk. Given the expected volatility this coming week we are loath to try and determine which way the market will go.
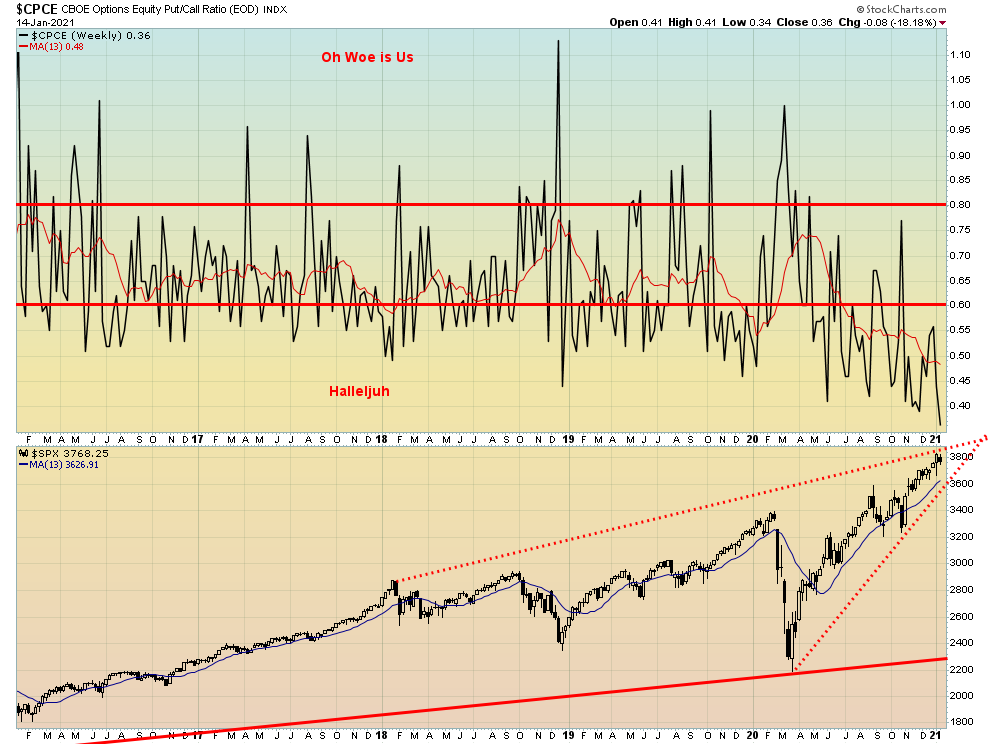
We continue to be surprised by the put/call ratio that has fallen to another record low in favour of calls. Bullish extremes? Seems that way, but until the market falls bullish extremes are now almost normal. No point in showing the others as they too continue to reflect a powerful bull market. Is there a bear anywhere? Alive?
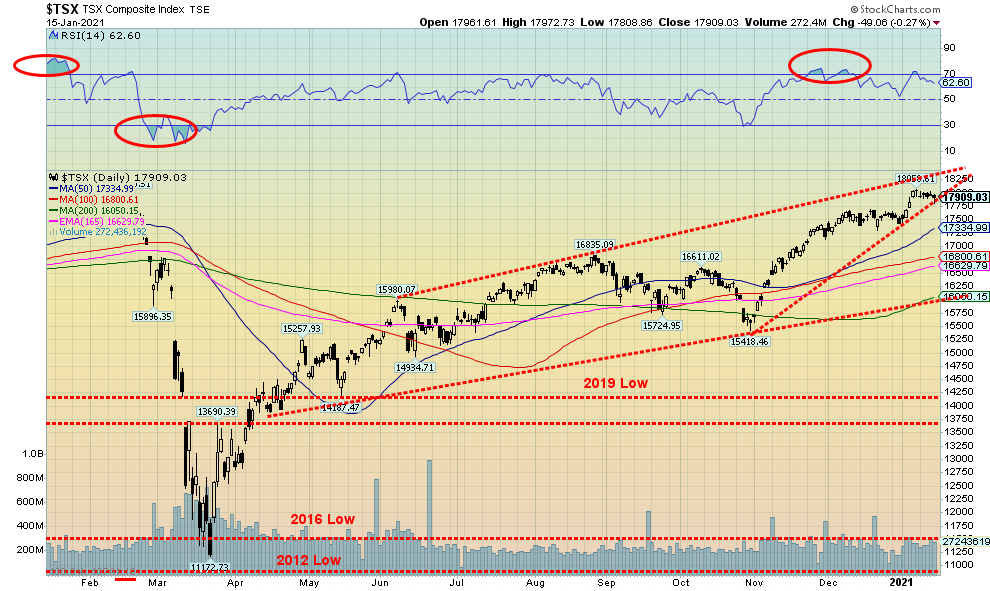
The TSX slipped off making record highs this past week. Overall, the TSX fell 0.7%, joining most of the other indices with small losses on the week. The TSX Venture Exchange (CDNX), however, gained about 1.3% and is now up 3.7% year to date. The TSX Composite continues to climb higher in what may be an ascending wedge triangle as the range narrows. If so, it sits near a breakdown and could in theory imply a breakdown to the 16,000 area. Four of the fourteen sub-indices posted gains this past week led by a resurgent Health Care (THC), up 14.4%. Other gainers were Financials (TFS) up 0.9%, Income Trusts (TCM) up 0.5%, and Utilities (TUT) up 0.2%. We note below how spreads have widened between the short end and the long end of the yield curve. That is quite beneficial for interest rate type stocks—helping financials in particular—but also for income trusts and utilities. Of the losers, the leader was Materials (TMT) off 4.9%, Metals & Mining (TGM) down 4.8%, and Golds (TGD) down 4.5%. We still expect those three to do well this year and view this pullback as temporary. But what’s key right now is, what does the TSX do? If that really is an ascending wedge, then we could soon be faced with a pullback.
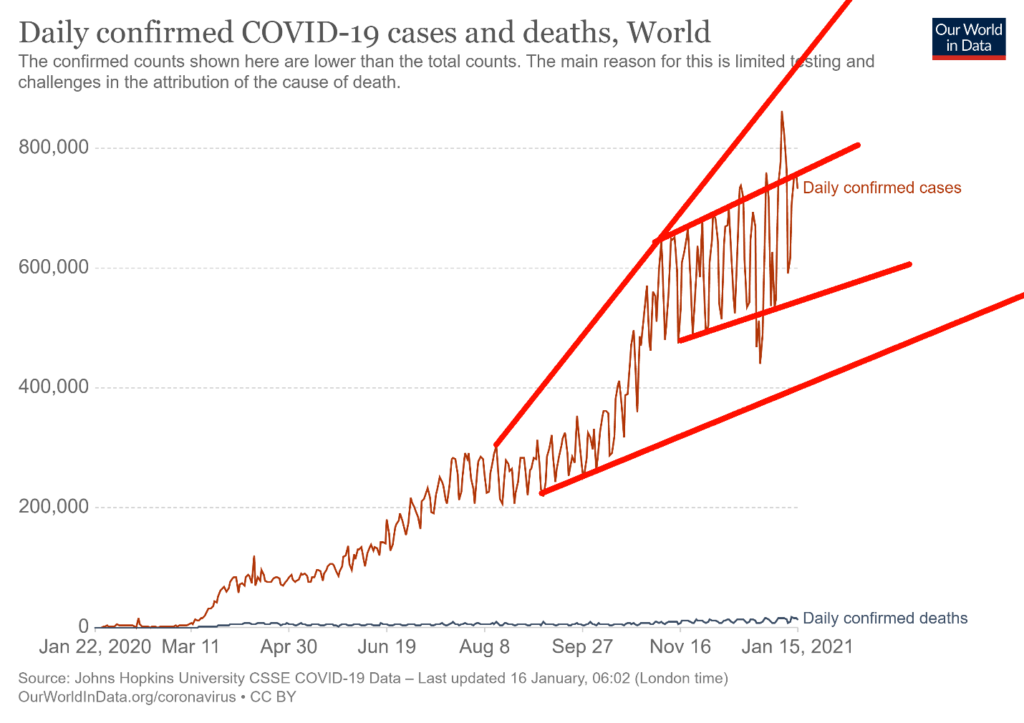
Onward and upward. We have climbed over 95 million cases and are rapidly approaching 100 million. Should be there sometime this week possibly even by inauguration day. We are over 2 million dead. The world adds in excess of 700,000 cases every day and over 13.5 thousand die every day. All led by the U.S. The vaccine is out but the roll-out so far is slow. The COVID has mutated and this is what many expected it would do. Sure, a lot recover but many of those who recover are left with permanent issues. It will take months to determine how well the vaccine works. The trend remains up with no sign of a top. According to many the case and death count is very likely underestimated by at least 20%.
Coronavirus cases and deaths: Sunday January 17, 2021 16:02 GMT
Cases: 95,112,848
Deaths: 2,033,614
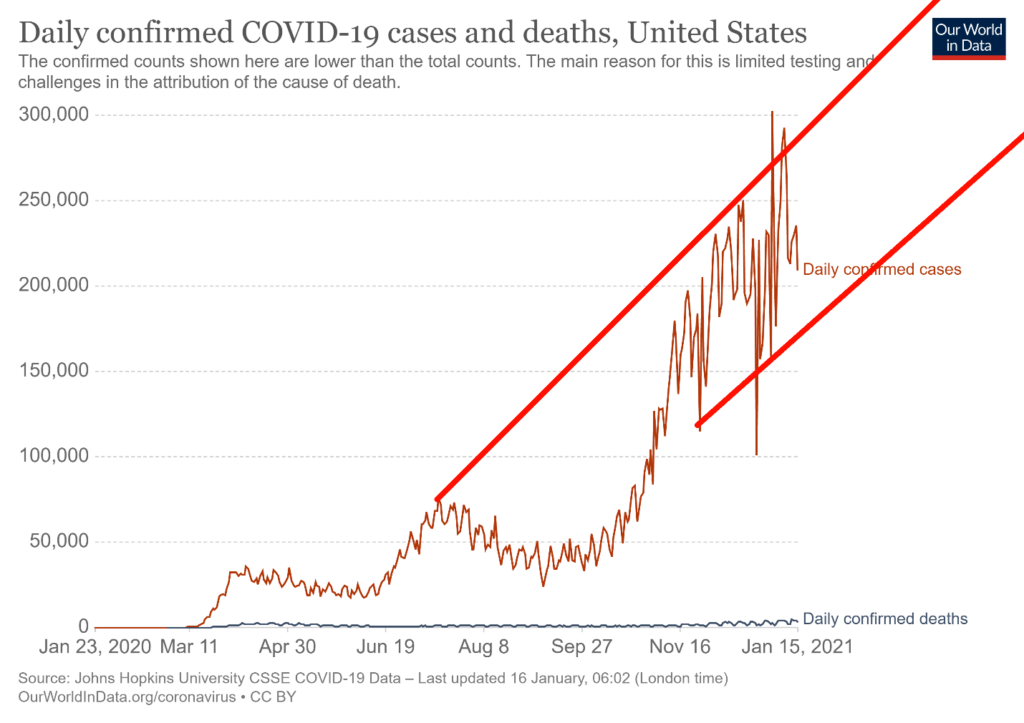
The situation in the U.S. continues to be bad. The U.S. adds roughly 230,000 cases every day and on average 3,400 die every day with days that have seen over 4,000 deaths and over 300,000 cases. Hospitals are overwhelmed although not all, of course. Bodies are stacked in hallways like something out of medieval times. The rumours are that Biden will order a complete lockdown. But is it too late? The vaccine is out but it is proceeding slowly, even if the U.S. is ahead of some other countries including Canada. California, Texas, and Florida continue to be the big three states most affected. Although New York still leads in deaths, the others are rapidly catching up. The U.S. should cross 25 million cases by inauguration day at current rates.
Coronavirus cases and deaths: Sunday January 17, 2021 16:02 GMT
Cases: 24,322,125
Deaths: 405,418
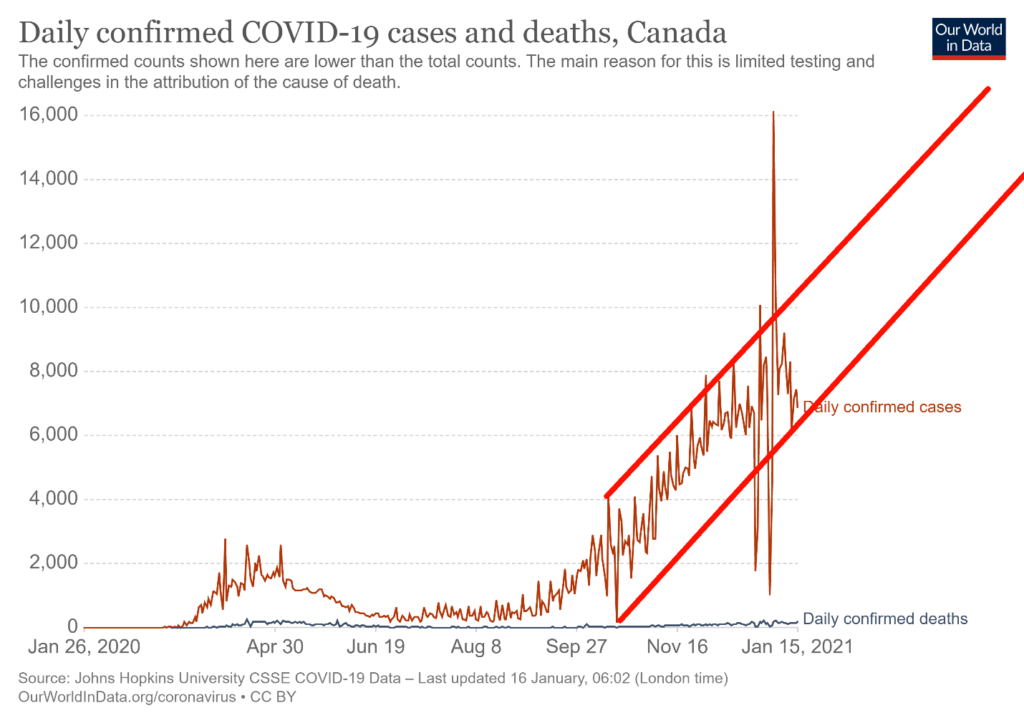
Canada continues to struggle. Roughly 7,000–10,000 cases are added every day, although on average only about 150 die every day. But the trend remains up. Some of those outlier numbers are suspect. Canada’s numbers remain high but their cases and deaths per million are lower than many. That may reflect a better reality as to how hard-hit Canada is compared to other countries.
Coronavirus cases and deaths: Sunday January 17, 2021 16:02 GMT
Cases: 705,605
Deaths: 17,934
US 10-Year Treasury Note, Canada 10-Year Government Bond (CGB)
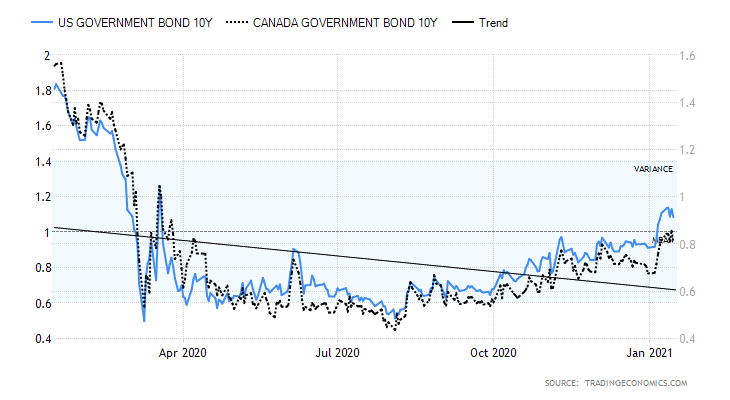
Yields remained relatively static this past week. The U.S. 10-year treasury note eased slightly to 1.09% while the Canadian 10-year Government of Canada bond (CGB) eased to 0.81%. Like the markets, they appear to be walking into the inauguration this coming week. Economic numbers this past week were mixed. Inflation expectations are rising, the JOLTS job-openings fell in November to 6.527 million from 6.632 million, the December year-over-year inflation rate was 1.4% so the spread over the 10-year is still negative, the core inflation rate came in at 1.6%, retail sales for December fell 0.7% but year over year were up 2.9% (before inflation), PPI year over year December was up 0.8%, industrial production for December was up 1.6% but year over year it was down 3.6%, capacity utilization for December was 74.5%, and the Michigan Consumer Sentiment Index came in at 79.2 vs. 80.7. If there were surprises in there it was retail sales for December. The fall in the JOLTS job openings compounds the problems for the unemployed as there is an estimated 18.1 million receiving benefits. There are more people unemployed than there are jobs. The recent rise in yields has helped push up the U.S. dollar on one side and push gold down on the other.
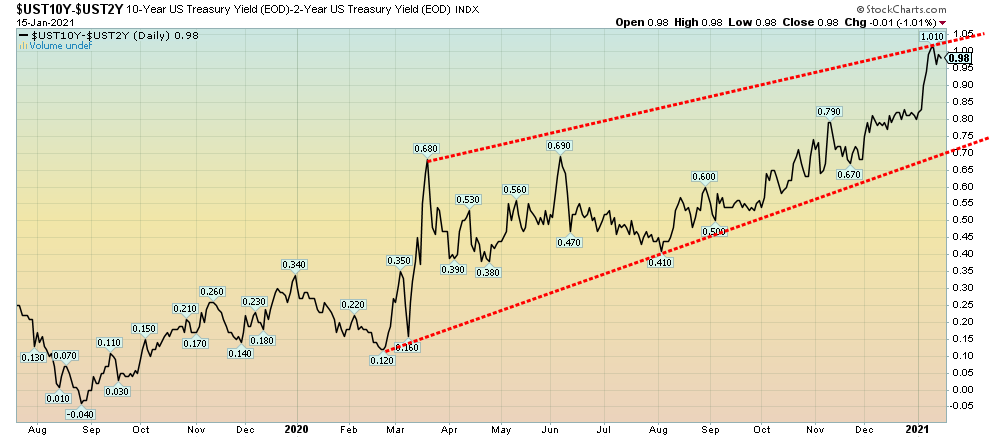
It has been some time since we noted the 2–10 spread (U.S. 10-year treasury note less the U.S. 2-year treasury note). The spread is quite positive, currently at 98 bp. In Canada the spread is 65 bp. This positive spread is the prime reason banks are doing well and should continue to do so as long as the spread remains this wide or even if it narrows somewhat. It’s called carry, in that one can buy the 10-year and sell the 2-year and pick up the spread differential. Play this scenario out amongst other differing credit instruments and the banks are able to book the spread with little fear of a drop to impair their profits as the spread narrows. As long as the spread remains relatively wide like this the financial sector should do relatively well, particularly the banks.
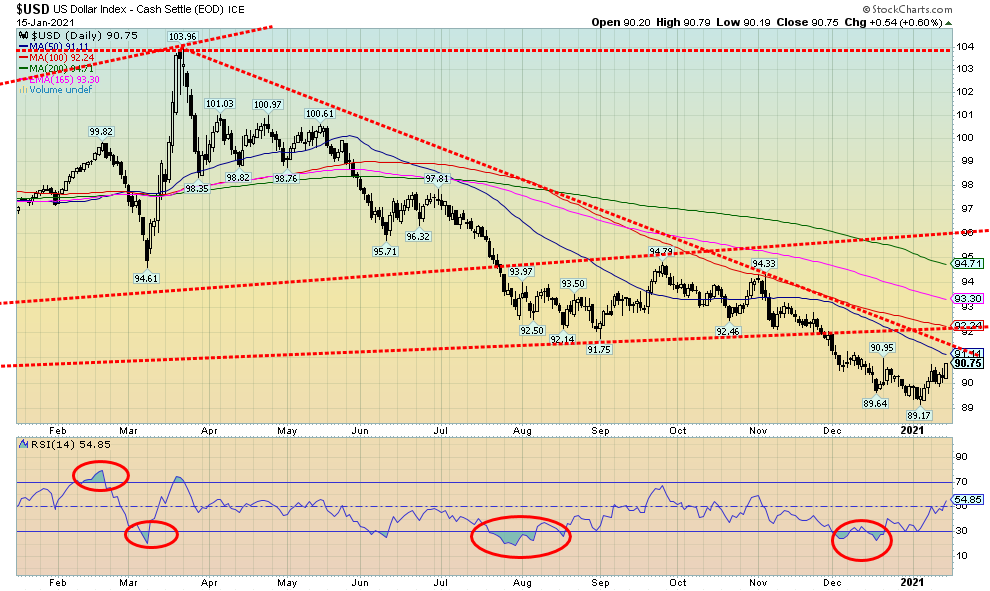
The US$ Index had its best week in weeks, rising almost 0.8%. The currencies were hit with the Cdn$ down 0.1%, the euro off 1.2%, the Swiss franc down 0.7%, but the pound sterling bucked the trend rising 0.1% and the Japanese yen was also up about 0.1%. The US$ Index is approaching resistance near 91 but above 91 the index could rise to 92. The US$ Index has been in a downtrend since the September high of 94.39. A normal correction of that decline could take the US$ Index to at least 91.30 with higher potential to 92.00 and even up to 92.65. Above 93.50 new highs are possible. So far this looks like an overdue rebound following a steady downtrend. The stronger US$ Index is weighing on gold prices. Major resistance is at 92.25 but above that level a rise to higher levels is probable. The US$ Index does have some positive seasonality into January but the strongest seasonality comes into March.
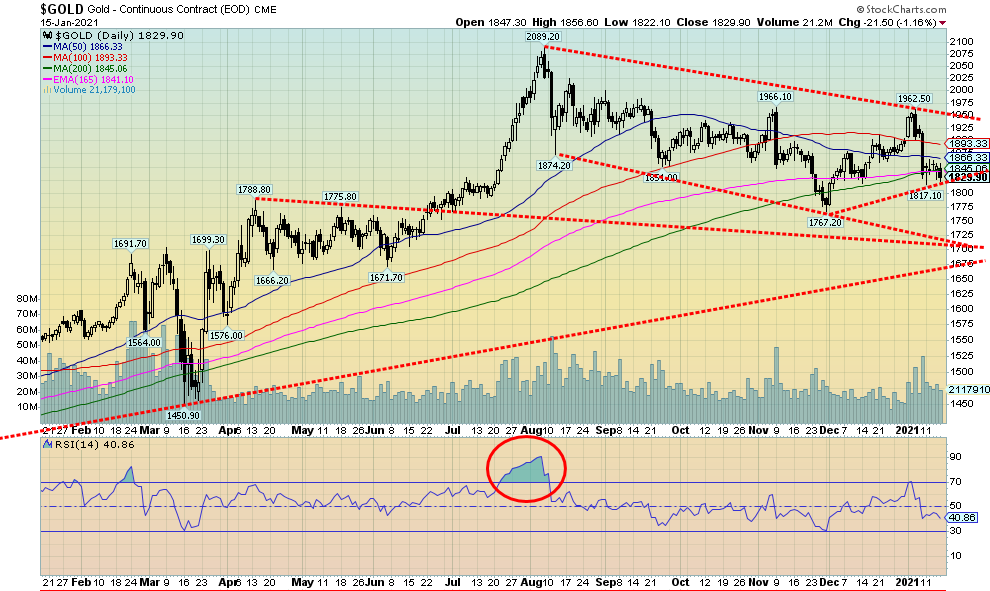
With bond yields and the U.S. dollar rising, gold didn’t take kindly to either and fell roughly $6 on the week or 0.3%. Friday was the worst, down about 1.2%. It was the second straight weekly drop and helped turn the short-term trend down. Silver managed to hang in, rising 0.9% as did platinum up 1.7%. Palladium also rose up 1.3% but copper fell 1.9%. The gold stocks didn’t take kindly to the drop and both gold indices were down on the week.
With the US$ Index up again and the 10-year treasury note remaining above 1% they weighed on gold prices. Seemingly overlooked is the huge coming stimulus package. Oddly, we also heard rumours of a potential Fed tapering. Not sure why but we do note in the previous tapering gold performed poorly. What’s key might be the stimulus efforts to come from the Biden administration. But with the inauguration this coming week and threats of violence, gold may be pausing in front of it all to make sure Biden actually gets inaugurated. So, until then gold is caught in cross-currents.
Gold is currently at some support here at $1,830, but a break under $1,825 would suggest that the $1,800/$1,815 support zone could fall. Under $1,800, a retest of the November low of $1,767 would be underway. The bottom of the channel is down near $1,700. A breakdown under $1,700 would signal the bull market is over. However, we continue to believe there remains more upside ahead. We have noted how we are trying to find our 31.3 month low. The November low would qualify but the center is around April 2021 for that low. It still keeps in play a possible runup into February that could take gold prices to $2,200 to $2,300. While we continue to see considerable bullish reports for gold, we are also aware of bear reports. So, we never like to get ahead of ourselves until we see which way things break. We do note that, despite the improvement in the gold COT, overall, it remains bearish.
Despite the notes of caution, we remain optimistic and positive towards gold going into 2021. We await an upward breakout confirmation. $1,950/$1,960 remains key resistance. Once we break above that level, we should be going over $2,000 again.
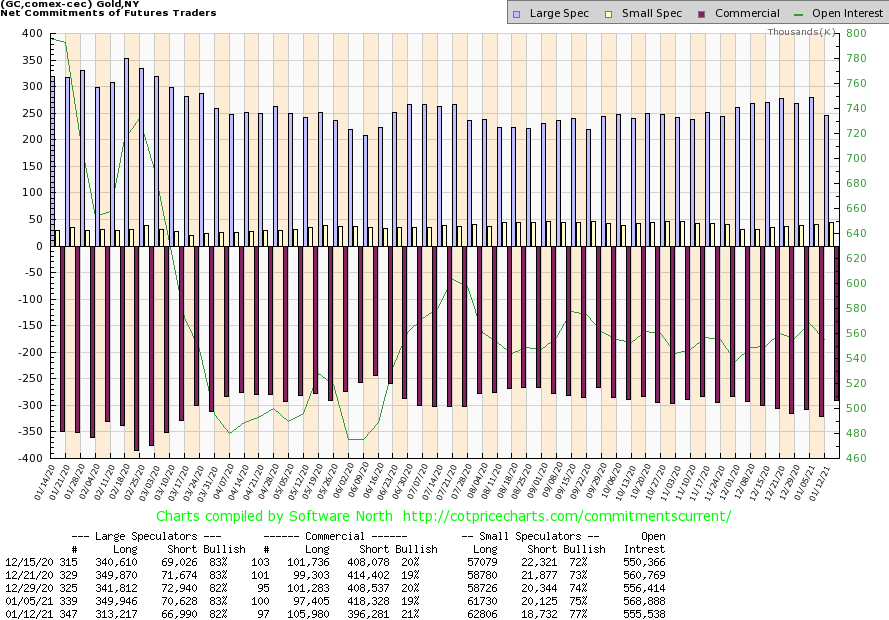
At last, an improvement in the commercial COT. The gold commercial COT improved to 21% this past week from 19%. Short open interest fell roughly 22,000 contracts while long open interest rose almost 9,000 contracts. Total open interest fell about 13,000 contracts on a down week suggesting short covering. The large speculators COT (hedge funds, managed futures, etc.) slipped to 82% from 83%. Short open interest fell there too by about 4,000 contracts but long open interest took a kicking, down over 36,000 contracts. The large speculators were bailing their long positions. The gold COT is still a bit too bearish for our liking but we’ll take the improvement. A glimmer of hope.
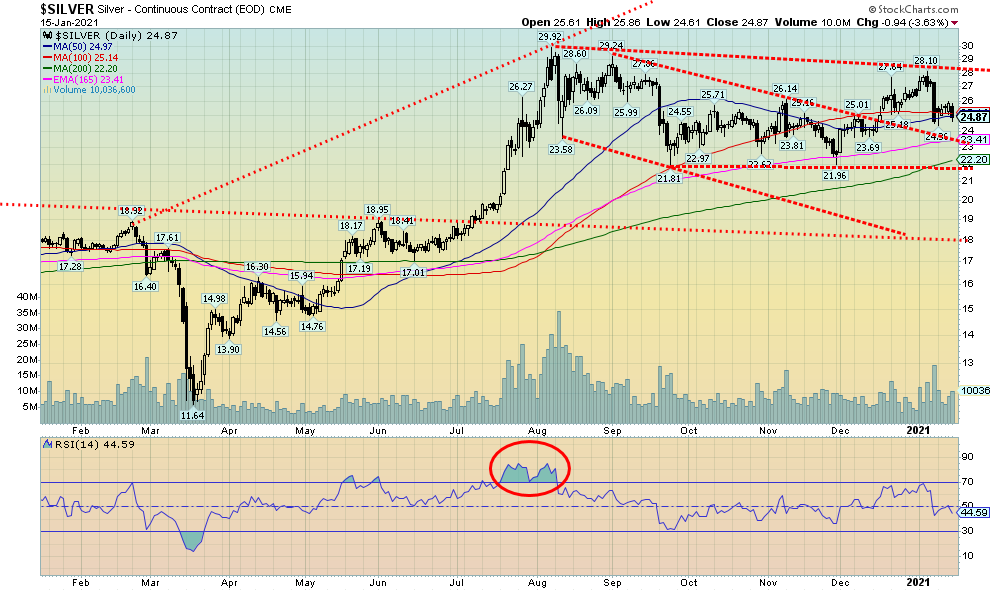
Silver did not have a good Friday as it fell 3.6%. Despite the fall on Friday, silver did eke out a gain of 0.9% on the week. The gain came despite gold falling. Since silver’s sharp down day on January 8, it has traded in a general range of $24.50 to $25.90. That defines our current parameters, so a break under $24.50 could send silver lower towards $23.40 and the bottom of the channel. A break above $25.90 could signal a return to the upside; however, we suspect more work might be needed. If silver truly does break to the downside, then $23.40 might only be a pause before falling further towards $22.00. The current pattern forming is a bit fuzzy as, since topping back in August at $29.92, silver has largely traded in a range between $22 and $27 with a brief foray above $27. So, is this a topping pattern or a consolidation pattern? We have been treating it as a consolidation pattern following the run-up from the March 2020 low of $11.64 to the August high of $29.92. That suggests the break should be to the upside to complete a potential large ABC-type pattern. Confirmation of the breakout would only come above $28. We, along with many others, remain bullish and some others are very bullish. But we are also cautious just in case, as they say. We continue to believe that the March low was a half-cycle low of the current 7–8-year cycle which last bottomed in late 2015. The next 7–8-year cycle low would be due 2022–2024. The question right now is, was the August high the crest of this cycle? That would be confirmed only with a breakdown under $22. So, we have to keep all these things in mind until we do break out to the upside above $28.
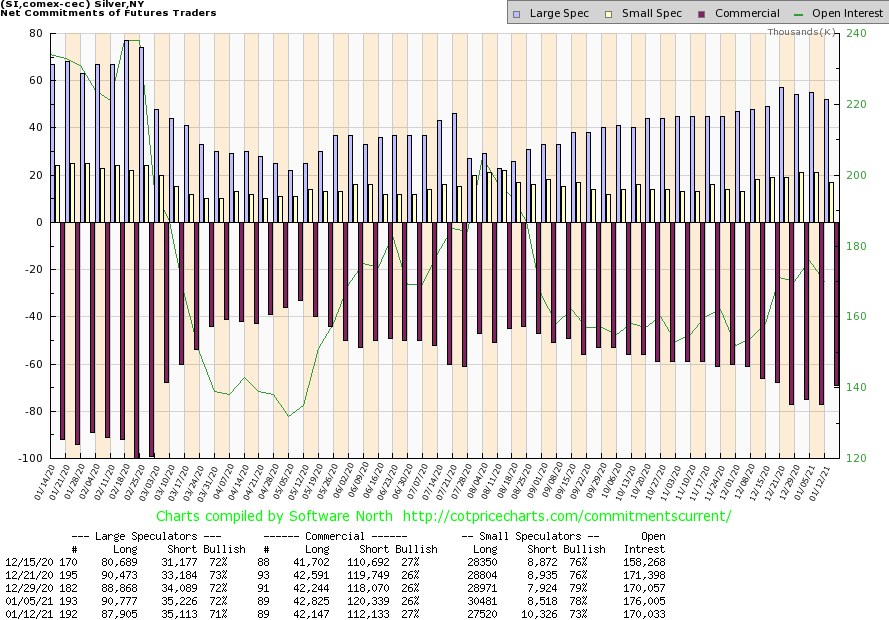
Like gold, we did have an improvement in the commercial COT for silver this past week. It improved to 27% from 26% as short open interest fell over 8,000 contracts. Long open interest remained steady. Overall, open interest fell this past week, suggesting that what we saw was short covering. The large speculators COT slipped to 71% from 72%.
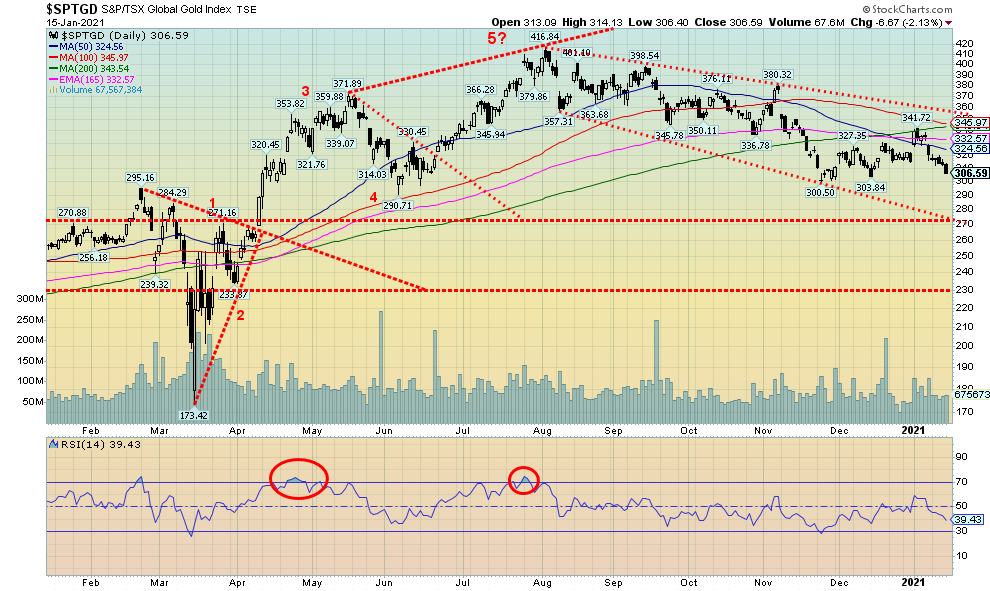
It wasn’t a good week for the gold stocks as the TSX Gold Index (TGD) fell 4.5% and the Gold Bugs Index (HUI) was off 5.9%. The recent failure at 342 signaled a potential retest of the lows at 300/304. At just under 307 we are getting close. The bottom of the channel is down near 270. That area would also be major support. That level would come into focus if we were to break under 300. The MACD indicator (not shown) crossed to the downside this past week. But if new lows are seen below 300 it would set up positive divergences as the MACD is unlikely to make new lows. However, we can’t rule out a test of 300 or even new lows below that level. At minimum, we’d need to regain 325 to suggest to us that we could be regaining the uptrend. Ultimately it would need to break out over 342 but above lies major resistance at 360. Only above that could we safely say the bull uptrend is back in play. Volume has not been overly impressive which is typical of corrective periods.
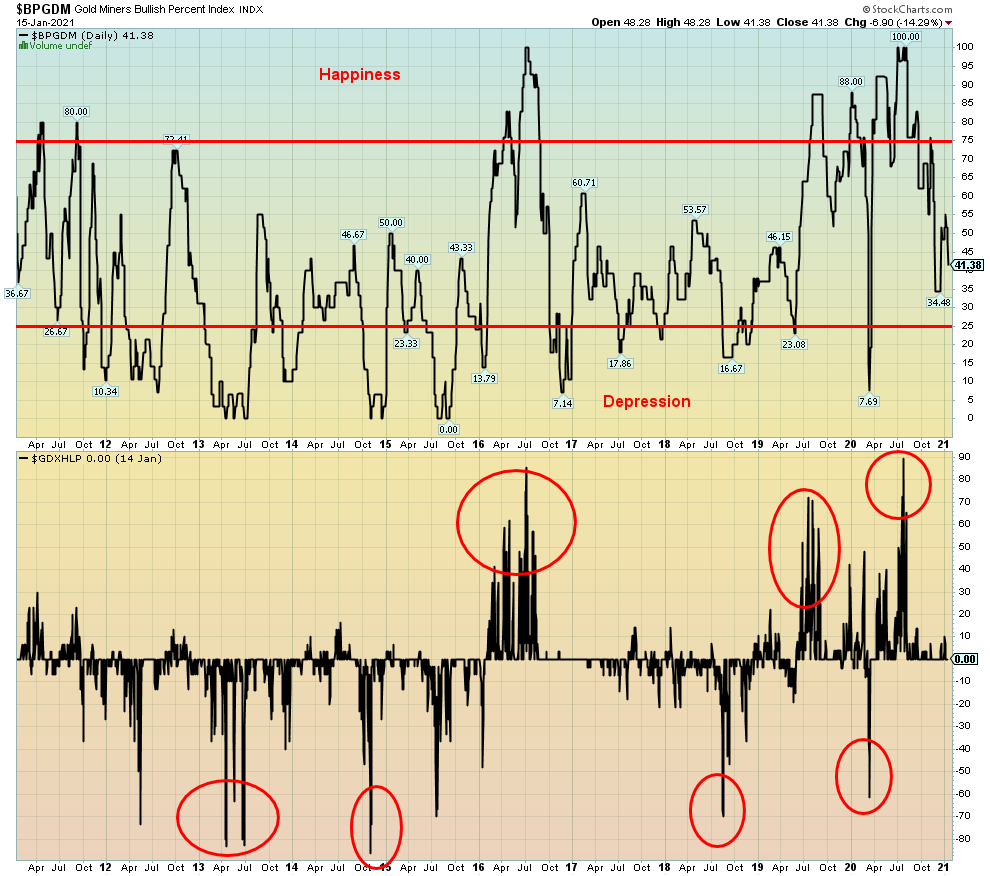
The Gold Miners Bullish Percent Index (BPGDM) fell to 41 this past week as it appears poised to test the recent low near 34. This is not particularly bearish or bullish. We note that the other indicator, the Gold Miners New Highs – New Lows Percent Index is pretty neutral here as well. With both these indicators so neutral it makes it trickier trying to predict the next move that could be either up or down. Nonetheless, we wanted to note the sentiment for gold silver stocks. Even neutral readings tell us something.
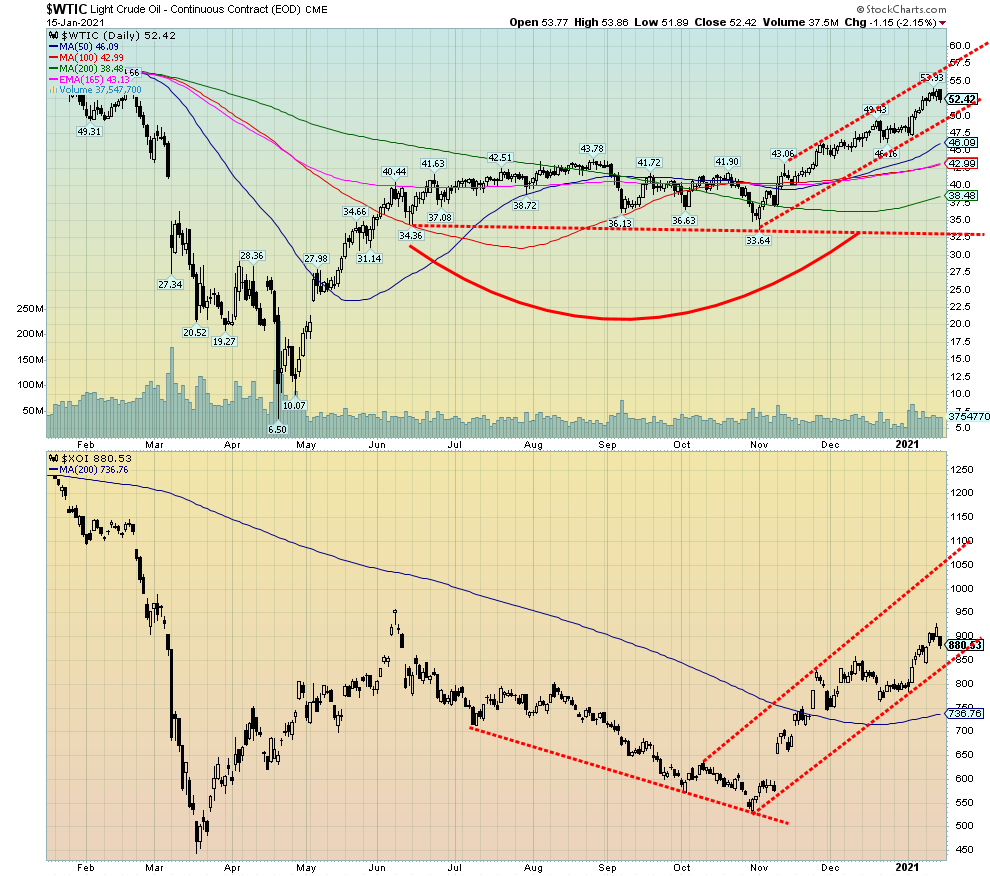
There is not much to say on the oil front this week. WTI oil rose 0.3% this past week but fell 2.2% on Friday on demand concerns and some uptick in cases in China. Not that 144 cases on January 15 were really that much but it was higher than usual. They have a 7-day average of 93 cases which is also a small uptick. We mention it as it was noted this week. One thing the higher prices are doing is increasing predictions of a rebound in the U.S. shale industry. However, like the Canadian oil sands, the shale industry really needs even higher prices over $80 and sustained higher prices. Despite the drop on Friday, WTI oil has support down to $50. But a break under $50 could now signal the end of this mini-bull run. Under $47.50 would confirm the end of the bull run.
The energy stocks were mixed on the week as the ARCA Oil & Gas Index (XOI) rose 1.3% but the TSX Energy Index (TEN) dropped 1.5%. Still, the XOI remains in a good uptrend. The break comes under 850 and is confirmed with a break under 800. The TEN looks a little more precarious as it breaks under 98 and is confirmed with a break under 89. Major support lies down at 75/77. Otherwise, like WTI oil, the XOI remains in a good up-trend but, as noted, the TEN looks a little more tenuous.
Natural gas (NG) improved another 1.5% this past week and, following a pullback to the 200-day MA recently, NG appears poised to rise again. A break above $3 would confirm that and, at minimum, a retest of the $3.40 high seen in late October could be underway.
With President Biden taking the helm later this week, the question will be, how soon they can get the stimulus package out including $1,400 in cheques? That too would help oil demand.
__
(Featured image by Karolina Grabowska via Pexels)
DISCLAIMER: This article was written by a third party contributor and does not reflect the opinion of Born2Invest, its management, staff or its associates. Please review our disclaimer for more information.
This article may include forward-looking statements. These forward-looking statements generally are identified by the words “believe,” “project,” “estimate,” “become,” “plan,” “will,” and similar expressions. These forward-looking statements involve known and unknown risks as well as uncertainties, including those discussed in the following cautionary statements and elsewhere in this article and on this site. Although the Company may believe that its expectations are based on reasonable assumptions, the actual results that the Company may achieve may differ materially from any forward-looking statements, which reflect the opinions of the management of the Company only as of the date hereof. Additionally, please make sure to read these important disclosures.
Futures and options trading involves substantial risk of loss and may not be suitable for everyone. The valuation of futures and options may fluctuate and as a result, clients may lose more than their original investment. In no event should the content of this website be construed as an express or implied promise, guarantee, or implication by or from The PRICE Futures Group, Inc. that you will profit or that losses can or will be limited whatsoever. Past performance is not indicative of future results. Information provided on this report is intended solely for informative purpose and is obtained from sources believed to be reliable. No guarantee of any kind is implied or possible where projections of future conditions are attempted. The leverage created by trading on margin can work against you as well as for you, and losses can exceed your entire investment. Before opening an account and trading, you should seek advice from your advisors as appropriate to ensure that you understand the risks and can withstand the losses.


The TopRanked.io Weekly Affiliate Marketing Digest [The Top VPN Affiliate Programs Roundup]
Want to be let in on a little secret about two massive affiliate opportunities you can take advantage of today?...


Sustainable Finance Faces Hurdles as Green Asset Ratio Reforms Fall Short of Full Transparency
The Green Asset Ratio (GAR) measures banks' alignment with the EU Taxonomy but remains low due to methodological flaws and...


XRP Hits New All-Time High Amid U.S. Crypto Policy Shift and Ripple’s Expansion
XRP surged past its 2018 all-time high, reaching $3.65 amid renewed political support for crypto in the U.S. under Trump....


Germany Moves to Curb Medical Cannabis Abuse, Sparking Access Concerns
Medical cannabis imports in Germany have surged, but health insurance-covered prescriptions remain low. Easy online access raises concerns about abuse...


JPMorgan’s Data Fees Shake Fintech: PayPal Takes a Hit
JPMorgan Chase will charge fintechs for customer data, threatening business models reliant on free access. PayPal’s stock plunged 5.7% after...
 |
|
 |  |
 |
|
-
 Markets2 weeks ago
The Big Beautiful Bill: Market Highs Mask Debt and Divergence
-

 Africa2 days ago
ORA Technologies Secures $7.5M from Local Investors, Boosting Morocco’s Tech Independence
-

 Markets1 week ago
A Chaotic, But Good Stock Market Halfway Through 2025
-

 Business4 days ago
The Dow Jones Teeters Near All-Time High as Market Risks Mount