Featured
The world is still in the early stages of a new commodity Supercycle
Our Chart of the Week looks at surging copper prices and how that impacts gold, silver and even platinum. Platinum has also been surging. Commodities are rising as WTI oil approaches $60. With markets surging so much we ask is the shoeshine boy giving out stock tips? Gold continues to flounder seeking its low. But silver has been hanging in outperforming gold to the upside.
The mania continues. The market was taken by surprise to learn from a regulatory filing that CEO Elon Musk of Tesla fame had purchased $1.5 billion of Bitcoin. Ostensibly it was to achieve “more flexibility to further diversify and maximize returns on our cash.” Okay, they had some $19 billion in cash lying about. So, what’s a billion and a half? As well, Tesla will now accept Bitcoin as payment for its cars. Bitcoin soared to a record high near $48,000. Elon Musk, already the richest man in the world just got a little richer. So, what is Elon Musk worth? Well, the last we saw it was about $183 billion. That would make Elon Musk roughly the 55th largest economy in the world (out of 211) above Hungary that would slip to 56th. Elon Musk would also be about the 37th or 38th largest corporation in the world by market cap.
Legendary investor Jeremy Grantham (Chairman Grantham, Mayo & Van Otterloo) has said, “We have very seldom seen levels of investor euphoria like this.” And the bubble is in everything. We’re looking at high-flying stocks and cryptocurrencies (Dogecoin, an admitted joke of a cryptocurrency, has a market cap of over $9.0 billion, having shot up over 1000% since January 27, 2020 and Lindsay Lohan was in an ad pitching Ethereum, with a market cap of $200 billion). Also, housing and collectibles are soaring. But what about commodities? They are just beginning to stir with the CRB Index up 73% since its April 2020 low, primarily due to growing shortages, not rising demand. Even marijuana stocks have come to life again in a new mania with Tilray (TLRY) shooting up over 700% since January 1, 2021.
It is, of course, all spurred on by record low interest rates, oodles of liquidity provided by Treasury departments around the world, and QE from the central banks. It doesn’t matter whether it’s the U.S., Canada, Japan, or the EU, but all markets are surging. Grantham famously pulled the plug before the Japanese bubble bursting in 1990 and the dot.com bubble bursting in 2000. It is, we suppose, not surprising that we are seeing a lot of come-ons in our email pumping the latest in Blockchain and cryptocurrency related stocks.
Birds of Feather Stick Together? Tesla and Bitcoin
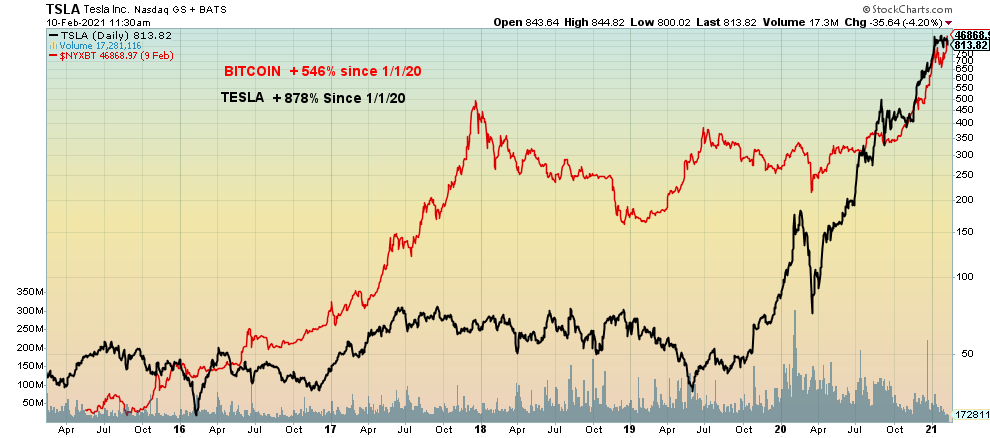
Suddenly, with all of this $50,000 Bitcoin no longer seems outlandish. Naturally there were doubters as to the sanity of Elon Musk. It was even referred to as a hoax. Still, Bitcoin is now higher than the cost of a Model 3 Tesla. For one Bitcoin you could buy one and get change back. Nobody knows exactly what a Bitcoin is for, but since it survived its first mania that peaked in December 2017 who knows where this one is going? Some are calling cryptocurrencies the new precious metals. The coming of the automobile in the early 20th century and the advent of the computer age in the 1970s were seminal events that sparked major technological booms.
The advent of Blockchain and DigiCash is still in its infancy and appears poised to spark yet another technological boom. It is still trying to figure out what is supposed to be. But when it does, a bigger boom could get underway. But will Bitcoin and cryptocurrencies become the currency of choice? Don’t count on it. Governments control currency. And crypto mining is an incredibly dirty business, needing increasing amounts of energy consumption to mine and maintain it. Few pay attention to that fact.
All this crazy action in the markets brings thoughts of Charles McKay’s famous book published way back in 1841, Extraordinary Popular Delusions & The Madness of Crowds. The key element of any bubble is psychology. Whether it was the South Sea Bubble or more recently the dot.com Bubble, all were basically panics to the upside. Investors were driven like a herd. In this case the herd came from Reddit and Robinhood. Valuations and fundamentals are largely irrelevant. Too much money is chasing too few goods (stocks). But then when a catalyst hits, whether it is a liquidity issue, government actions, or something else the psychology reverses and there is panic selling to the downside. How do GameStop traders deal with a 1,900% increase in 12 trading days followed by a 90% collapse in the next 12 trading days?
Robinhood put a clamp on trading and, poof, after hitting a high of $483 GameStop (GME) on January 28, 2020 it promptly collapsed. They were calling it the democratization of the stock market, but the reality is if you are going to take on the big boys (i.e., hedge funds, banks, and even central banks) you will ultimately lose. And “poof” it did. Psychological manias can work both ways. Somebody made money, though. The intermediary for Robinhood is a firm called Citadel Securities. They are the market maker. They are both the buyer and the seller and they handle virtually all of Robinhood’s trades and also for others. And that trading differential is Citadel’s profit and they don’t care if you are a buyer or a seller. They made $6.9 billion in 2020 without taking any risk. So how does Robinhood make money when they charge no commissions? Citadel pays them a fee on all of their trading flow. The market makers own the market. (See also www.epsilontheory.com/hunger -games for further enlightment on the subject).
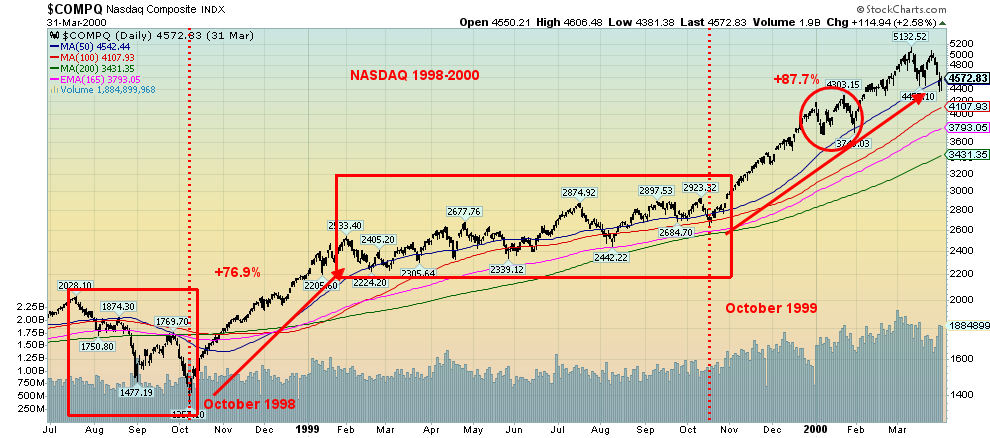
Manias are not a straight-up affair. Even on the way to the highs of March 2000 the NASDAQ experienced a few bumps along the way. What has struck us is an amazing similarity between the chart of the NASDAQ in 1998–2000 and the current one for 2018–2021.
NASDAQ 1998–2000
NASDAQ 2018–Present
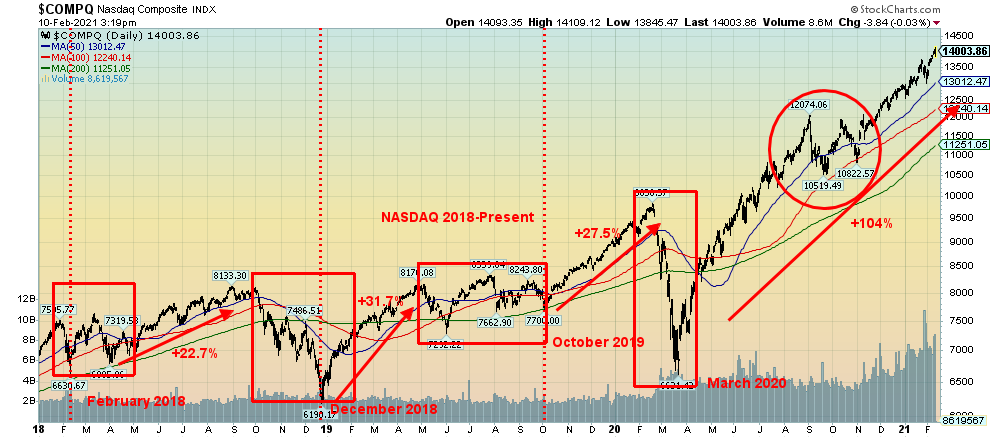
Okay, they are never exact but we were intrigued to notice the correction that took place in December/January 1999–2000. It looks eerily similar to the one that took place in August/October 2020. None of this tells when the high will occur, except that it will. That final high could be forming now or months from now. After the euphoria comes the hangover.
Some are already experiencing a hangover. Renaissance Funds, the world’s second largest hedge fund behind Bridgewater Associates, with an estimated $133 billion under management, has faced over $5 billion of redemptions since December 1, 2020 because of losses. Renaissance’s Institutional Equity Fund lost 19% in 2020 while its Institutional Diversified Alpha Fund was down 32% and its Institutional Global Equity Fund dropped 31%. All of this in a year when the S&P 500 was up 16%, gold gained 24%, and silver was up 47%. Big losers were real estate (funds) and energy.
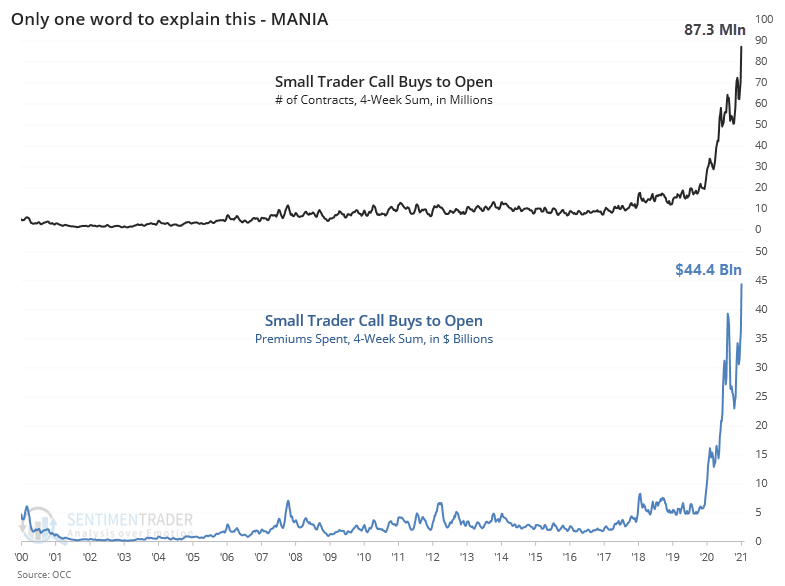
We have often noted the heavy overweight of call options to put options. How else do we explain this huge surge in option buying? It has gone what one can only call “bananas” over the past year.
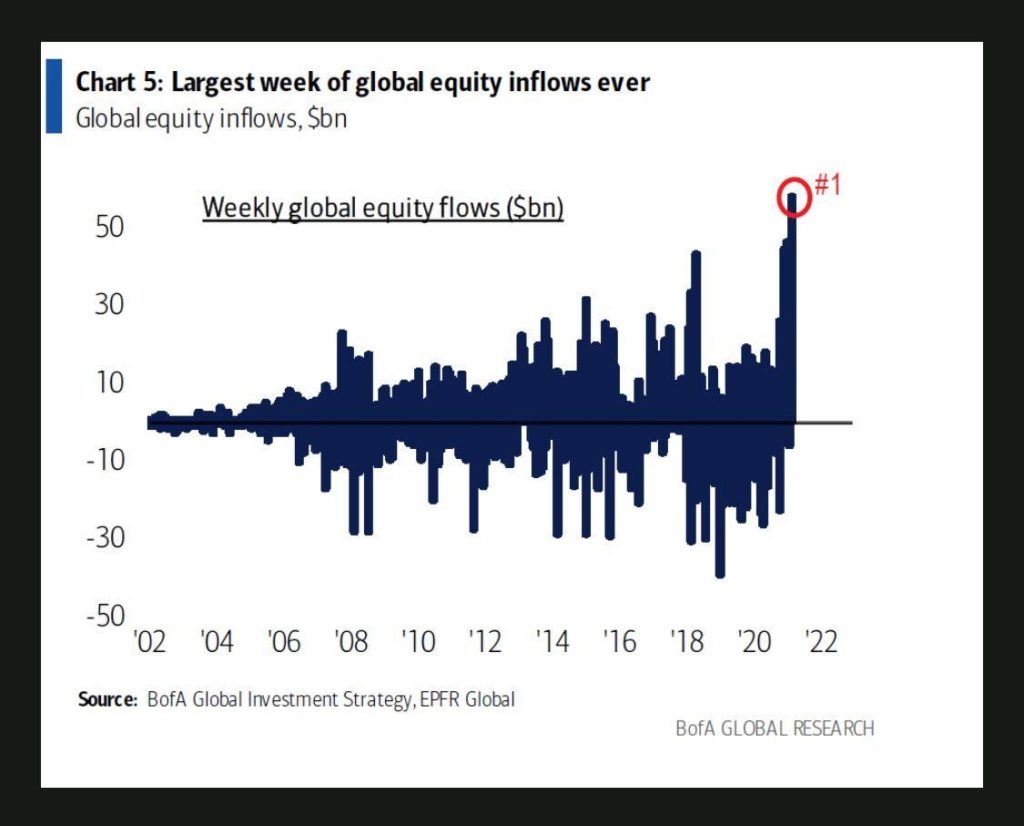
And then there is all the money floating around as a result of QE and more. Seems that there was a record weekly inflow of funds, estimated at $58 billion in January. Bond funds and ETFs, both domestic and global, were the prime recipients. And where does all this money go? Primarily into the stock market.
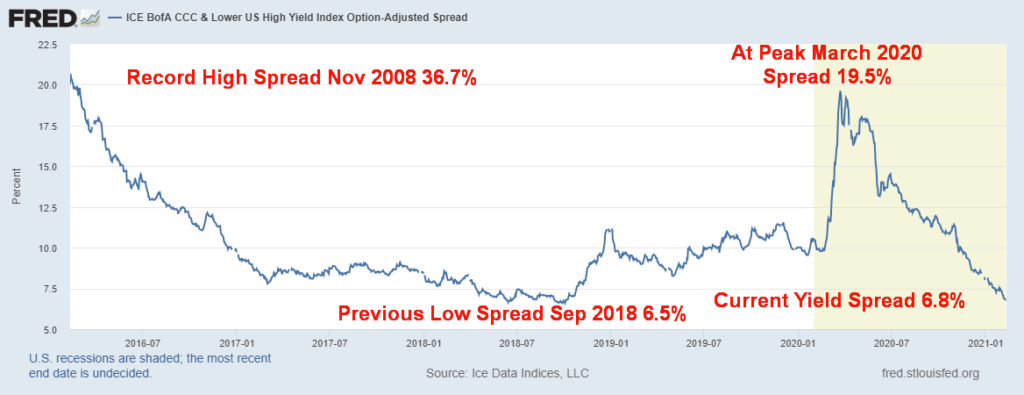
Another area that has seen a huge surge is what is known as SPACs (Special Purpose Acquisition Companies), also known as “blank cheque” companies. This area has surged to record levels. In January over $26 billion poured into SPACs. Previously this was an area that only attracted roughly a billion each month. The companies that have no assets are seeking assets such as cryptos and they issue debt to pay for it. Bizarrely, the spreads on junk bonds have plummeted.
CCC and Lower U.S. High Yield Index Spread to U.S Treasuries
With the huge surge in stock prices fueled by ultra-low interest rates and endless amounts of liquidity supplied through the central banks (QE) and Treasuries (fiscal stimulus), it is no surprise that the benefits have largely fallen to the 15% who actually own stocks directly not necessarily through retirement funds and other means. The K recovery. The rich get richer while millions of others hang on. Is it creating a two-tiered world? What is the potential for the formation of a dystopian world such as was portrayed in The Hunger Games (2012), Blade Runner (1982), or Children of Men (2006) or in the books of Cormac McCarthy or Margaret Atwood? Science fiction? Or growing reality? What is the future effect of deeply divided politics, climate change and the environment, pandemics, technology? Glimpses of a dystopian world were seen during World War II in concentration and internment camps and on the battlefields of World War I.
We don’t know how or when the current euphoria will end. We know it will end. This time is not different.
“Men, it has been well said, think in herds; they also go mad in herds, while they only recover their senses more slowly, and one by one.”
Charles Mackay, from Extraordinary Popular Delusions & The Madness of Crowds (1841); 1814–1889
The Pandemic Rages On!
The number of daily cases has slowed from highs of over 700,000 daily to under 400,000 daily. Deaths have slowed from over 14,000 daily to under 12,000 daily. In the U.S. daily cases have slowed from 250,000/day to just under 100,000/day. Deaths not so much as still averaging over 2,700 daily and should reach 500,000 dead by either Monday or Tuesday this week. Canada is also seeing a comparable slowdown in daily cases and deaths. Is this a pause before a 3rd wave hits? Some think so.
Sunday February 14, 2021 – 17:32 GMT
World
Number of cases: 109,249,889
Number of deaths: 2,408,055
U.S.A.
Number of cases: 28,211,089
Number of deaths: 496,209
Canada
Number of cases: 823,353
Number of deaths: 21,228
Source: www.worldometers.info/coronavirus
Chart of the Week
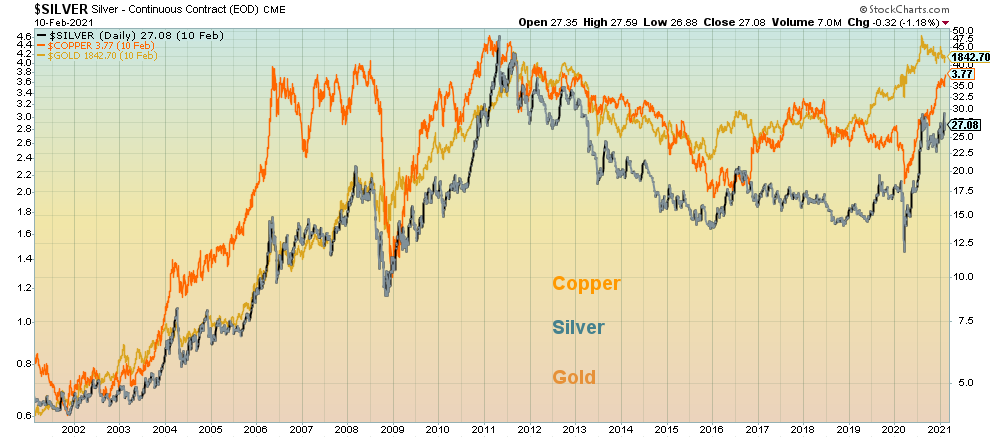
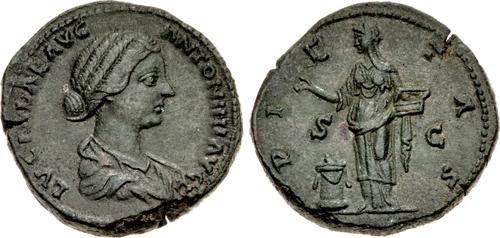
We can’t help but notice that copper prices have been rising. Not only are they rising, but they are starting to approach the highs seen in February 2011 at $4.65. We also see platinum prices have been rising, hitting their highest levels since 2014. So, what’s going on? Copper is an essential ingredient in green energy along with uses in electricity, heating etc. There is rising demand in China and elsewhere; copper has faced labour unrest at key mines, particularly in Peru and Chile; and inventories are low. The reality is that demand, mine problems, and falling inventories are all coming together to help push copper prices higher. Oh, and did we mention copper also has monetary value as it is still used in coins. If one looks back in history, coins from Ancient Greece, through Ancient Rome, Ancient China and more issued copper/bronze coins. Copper is also a key ingredient in bronze and brass and still used in jewellery.
Lucilla, Augusta AD164-182, AE Sestertius, Rome – daughter of Marcus Aurelius and Faustina, the younger, wife of Lucius Versus, sister of Commodus – portrayed by Sophia Loren in Fall of the Roman Empire (1964) and Connie Nielson in Gladiator (2000)
If copper prices are rising, the odds also favour that gold and silver will follow. Our chart dating back to 2000 shows that gold, silver, and copper tend to move up and down in tandem. The correlation is quite tight. Gold and silver’s correlation is 0.89. Gold and platinum are 0.73 and gold and copper 0.75. Silver’s correlation is even tighter with platinum and copper. It is noteworthy that the gold/silver ratio has fallen to its lowest level in years. It is also no surprise that the gold/copper ratio has also fallen to its lowest level in years as well. What all of this suggests to us is that, given the recent weakness in gold prices and given the ongoing strength of both silver and copper relative to gold, at some point gold will catch up.
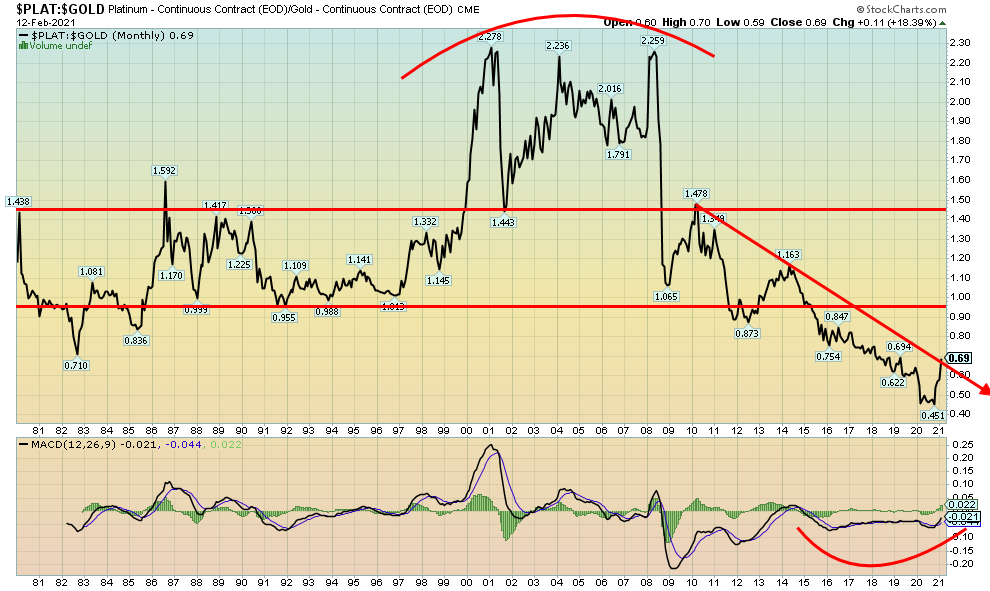
Our second chart below shows the gold/platinum ratio. The gold/platinum ratio peaked, or should we say triple-peaked way back in 2000 and off and on through to 2008. Since then, it has been in a long downtrend favouring gold over platinum. But now the gold/platinum ratio appears poised to break out over a twelve-year downtrend. Platinum prices have recently broken out over $1,200, their highest levels since 2014.
Platinum, copper, and silver all have an historical tendency to lead gold prices both up and down. Given their leadership, the recent weakness in gold will end and we should embark on another up trend favouring not just gold but also silver, copper, and platinum. Note the monthly MACD buy signal for the gold/platinum ratio that would favour platinum over gold. Targets would appear to be up into that broad congestion zone between 1.00 and 1.40. It is currently at 0.69.
Gold/Platinum Ratio 1980 –
MARKETS AND TRENDS
| % Gains (Losses) Trends | |||||||
| CloseDec 31/20 | CloseFeb 12/21 | Week | YTD | Daily (Short Term) | Weekly (Intermediate) | Monthly (Long Term) | |
| Stock Market Indices | |||||||
| S&P 500 | 3,756.07 | 3,934.83 (new highs) | 1.2% | 4.8% | up | up | up |
| Dow Jones Industrials | 30,606.48 | 31,458.40 (new highs) | 1.0% | 2.8% | up | up | up |
| Dow Jones Transports | 12,506.93 | 13,175.09 | 3.0% | 5.3% | up | up | up |
| NASDAQ | 12,888.28 | 14,095.47 (new highs) | 1.7% | 9.4% | up | up | up |
| S&P/TSX Composite | 17,433.36 | 18,460.21 (new highs) | 1.8% | 5.9% | up | up | up |
| S&P/TSX Venture (CDNX) | 875.36 | 1,067.44 (new highs) | 4.4% | 21.9% | up | up | up |
| S&P 600 | 1,118.93 | 1,297.90 (new highs) | 3.6% | 16.0% | up | up | up |
| MSCI World Index | 2,140.71 | 2,224.93 (new highs) | 2.1% | 3.9% | up | up | up |
| NYSE Bitcoin Index | 28,775.36 | 47,164.74 (new highs) | 23.5% | 63.9% | up | up | up |
| Gold Mining Stock Indices | |||||||
| Gold Bugs Index (HUI) | 299.64 | 284.29 | (0.8)% | (5.1)% | down | down | up |
| TSX Gold Index (TGD) | 315.29 | 303.85 | (0.9)% | (3.6)% | down | down | up |
| Fixed Income Yields/Spreads | |||||||
| U.S. 10-Year Treasury yield | 0.91 | 1.21% (new highs) | 3.4% | 33.0% | |||
| Cdn. 10-Year Bond yield | 0.68 | 1.03% (new highs) | 2.0% | 51.5% | |||
| Recession Watch Spreads | |||||||
| U.S. 2-year 10-year Treasury spread | 0.79 | 1.10% (new highs) | 3.8% | 39.2% | |||
| Cdn 2-year 10-year CGB spread | 0.48 | 0.84% (new highs) | 5.0% | 75.0% | |||
| Currencies | |||||||
| US$ Index | 89.89 | 90.47 | (0.6)% | 0.6% | up (weak) | down | down |
| Canadian $ | 0.7830 | 0.7877 | 0.6% | 0.6% | up | up | up |
| Euro | 122.39 | 121.21 | 0.6% | (1.0)% | down | up | up |
| Swiss Franc | 113.14 | 112.12 | 0.8% | (0.9)% | down | up | up |
| British Pound | 136.72 | 138.52 (new highs) | 0.8% | 1.3% | up | up | up |
| Japanese Yen | 96.87 | 95.28 | 0.4% | (1.6)% | down | up (weak) | up |
| Precious Metals | |||||||
| Gold | 1,895.10 | 1,823.20 | 0.6% | (3.8)% | down | down (weak) | up |
| Silver | 26.41 | 27.41 | 1.4% | 3.8% | up | up | up |
| Platinum | 1,079.20 | 1,259.00 (new highs) | 11.1% | 16.7% | up | up | up |
| Base Metals | |||||||
| Palladium | 2,453.80 | 2,382.60 | 2.4% | (2.9)% | down | up (weak) | up |
| Copper | 3.52 | 3.80 (new highs) | 4.7% | 8.0% | up | up | up |
| Energy | |||||||
| WTI Oil | 48.52 | 59.47 (new highs) | 4.6% | 22.6% | up | up | neutral |
| Natural Gas | 2.54 | 2.91 | 1.8% | 14.6% | up | up | up (weak) |
Note: For an explanation of the trends, see the glossary at the end of this article.
New highs/lows refer to new 52-week highs/lows.
Onward and upward. My colleague Mike Ballanger of GGM Advisory shared a story of Joseph Kennedy of Kennedy family fame (the father): how, while taking a break from his bootlegging days and hanging around with the Irish mafia and other assorted mafia, he was down on Wall Street and decided to get his shoes shined. The shoeshine kid started offering the already wealthy Kennedy stock tips. Kennedy thanked him for the advice, tipped him well, and went back to his office and sold everything. It was September 1929.
“When the shoeshine boys start offering stock tips, it’s time to exit the markets.”

The story has been told by many and who knows whether it is true or not. Shoeshine boys and newspaper boys were ubiquitous on the streets of New York back in the 1920s. So, if they had a couple of stockbrokers talking above them while they shined their shoes, who knows what tips they may have picked up.
The blind optimism of markets. Up, up, and away. Nothing can stop this. The Fed will save the day. Tesla, Bitcoin, GameStop. Their names are shouted from the highest rafters. Valuations? Who cares!
Notice we didn’t include gold because, since August, while the S&P 500 is up 12%, gold is actually down about 8%. But Bitcoin? Up 302%. Tesla, up a more modest 64%. GameStop? Up 684%, but at one time it was up over 7,000%. What can we say? When things get loony, things get loony.
We keep repeating that we don’t know when this market will top—we just know it will top and the correction might not be too pleasant for many. The up and away continues. This past week almost everybody made all-time highs—again. The S&P 500 was up 1.2%, the Dow Jones Industrials (DJI) gained 1.0%, the Dow Jones Transportations (DJT) was up 3.0% but remains just shy of its all-time high, and the NASDAQ gained 1.7%. The S&P 500 Equal Weight Index also hit new all-time highs, gaining 2.0% on the week. The S&P 600 small cap was up 3.6%. Canada joined the party with the TSX Composite up 1.8% and new all-time highs. The TSX Venture Exchange (CDNX) hit new 52-week highs, up 4.4%. In the EU the London FTSE gained 1.5%, the Paris CAC 40 was up 0.8%, and the German DAX fell about ½% but did make new all-time highs. In Asia, China’s Shanghai Index (SSEC) made new 52-week highs, up 4.5% and the Tokyo Nikkei Dow (TKN) made new 52-week highs, up 2.6%. The MSCI World Index was up 2.1% to new all-time highs.
We can note that others made new all-time highs but obviously not everybody. Making new all-time highs were the Value Line Index, the Dow Jones Composite (DJC), NASDAQ 100, S&P 100 (OEX), S&P 400 mid caps, Wilshire 5000, Russell 1000, 2000, and 3000.
The bottom line is, if you are not making money something is wrong with your broker. But the real test comes when the market goes down. Main Street may be wallowing in COVID-19 and unemployment or, more likely, severe under-employment, but if you are amongst the 15% of the population directly in the stock market you are doing well, thank you. The rich get richer. As to everyone else, well… And all of this is played out against the trial of the century in Washington. Except the markets could care less. Acquittal was a foregone conclusion. But what of criminal investigations in Georgia, New York and Washington DC? The market? Yawn!
They say inflation is returning but how can one have inflation when the velocity of money (how fast money turns over in the economy) is the lowest it has ever been in the past 60 years. The biggest boom was the 1990s when the velocity of money was at its peak. But the shift towards the rich getting richer and everyone else standing still really got underway in the 1980s with tax policies that helped the wealthy, and the bailouts started with the stock market crash of 1987. Since then, every crisis is worse than the previous one and the bailouts get bigger and bigger and bigger. Where it all leads no one knows for sure but history is not supportive. When you have a deeply polarized society, wide wealth, and income inequality, at some point there is a loss of confidence and then things will get rocky.
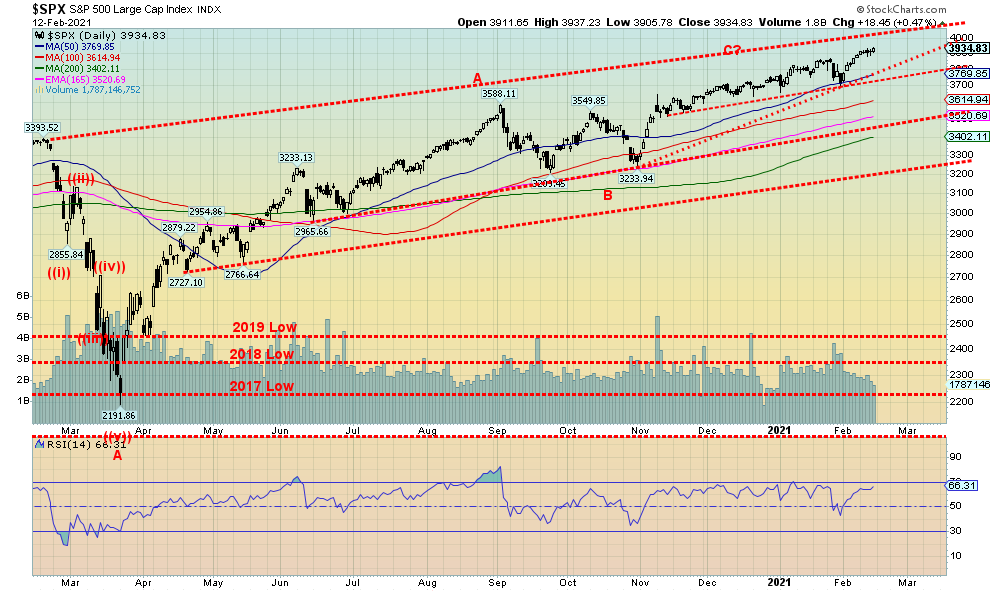
There has never been a bubble that did not end in tears. We expect nothing different this time. In the interim, all we can note is where the breakdowns start. For the S&P 500 the first break point is under 3,800. The second is at 3,700. The third 3,500 and the final one that could spark a panic is under 3,200. Still, our chart of the S&P 500 shows there is room to move higher in the channel towards 4,000. That cannot be ruled out. Indicators such as the advance/decline line, McClellan Oscillator ratio-adjusted (RASI), the ARMS Index and TICK Index, All Bulls – All Bears Index are all still good with few, if any, divergences. Market bullish percent indicators have some divergences but remain positive. Stocks still trading above their 200-day MA are still positive. The VIX Volatility Indicator has divergences but not major ones and is moving lower as it should when the market is rising. The put/call ratio has never been this bullish for this long but it too has shown few signs that the market could be topping. Other technical indicators have some divergences but they have not been seen for any length of time and divergences can go on for some time before the market finally goes down.
Pullbacks, when we do get them, are like we saw last August/September – shallow and short-lived. When everyone knows that the Fed will continue with QE and buy up the bond issues and that the Treasury will bring forth another $1.9 trillion stimulus plan, deficits don’t seem to matter especially when the Fed is purchasing the bulk of the debt. That and the vaccines that are getting into arms.
3,200 S&P 500 is the major line in the sand. That is the last significant weekly low. It is also the last significant monthly low. When markets break significant weekly and monthly lows then the panic could start. Heaven help the yearly low of 2,191 seen in March 2020.
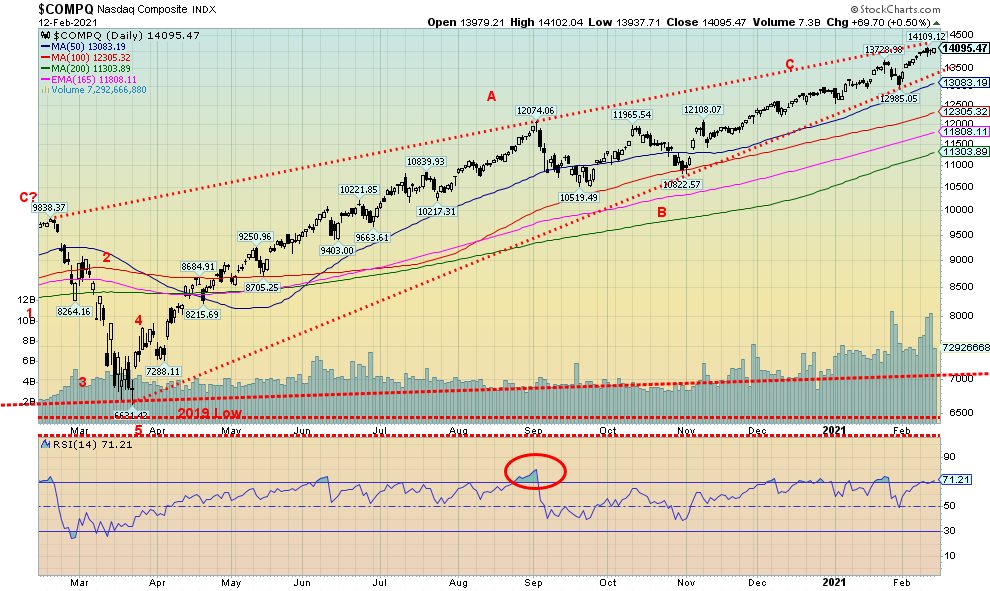
The NASDAQ continued its winning upward ways this past week with another record high, gaining 1.7% on the week. The NASDAQ is now up 9.4% on the year. The FAANGs, along with the other biggies, helped push the record run but this past week they were decidedly mixed. Facebook gained 0.9%, Netflix was up 1.0%, Google gained 0.3% and new all-time highs, Microsoft also made new all-time highs up 1.2%, but Apple lost 1.0% and Amazon dropped 2.2%. Twitter jumped 26.6% to new all-time highs (go figure) but Tesla slipped 4.2%. For comparison’s sake, Berkshire Hathaway, the ultimate value stock, also jumped to new all-time highs, up 3.0%. The NASDAQ hit a high of 14,109, coming close to the top of that channel. The day it hit the high the NASDAQ reversed and closed lower with a small outside day. But since then, there has been no follow-through to the downside. Still, it could be signaling at least another temporary top. With the top of the channel looming above it could prove difficult to breakthrough. But that might not stop a creepy-crawly rise towards 14,500. The last low was seen at 12,985 so any break under that level would signal a further drop. What could be a wedge triangle forming breaks under 13,380. That could suggest a decline to 10,900. That in turn would set up a test of the 200-day MA currently at 11,300. We keep wondering how this market can keep going higher, but higher it keeps going. Until it doesn’t.
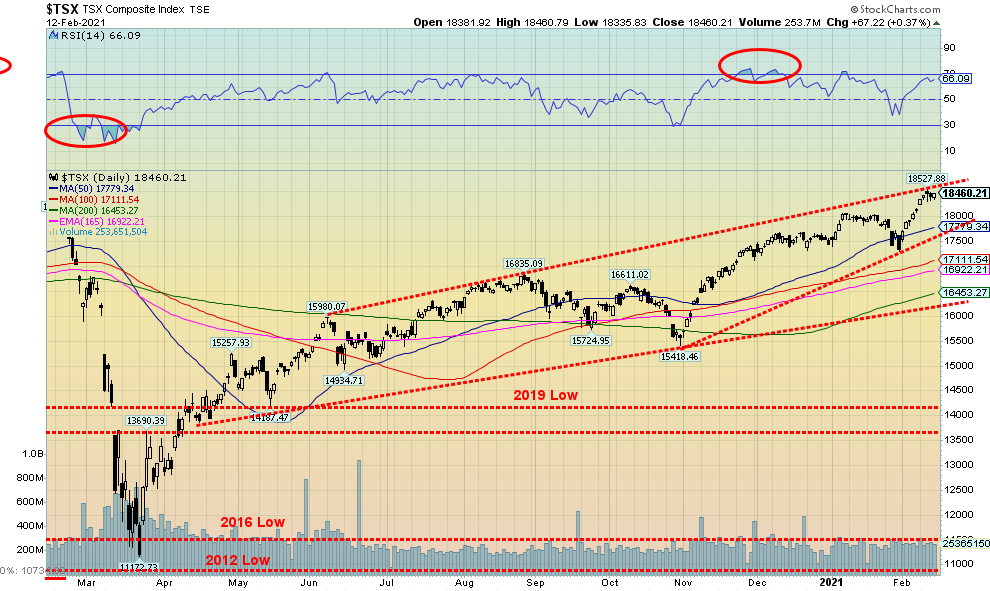
The TSX Composite continued its winning highs, hitting fresh all-time highs once again this past week with a gain of 1.8%. The TSX Venture Exchange (CDNX) continued its winning ways, up 4.4% and now up 21.9% on the year. The CDNX also hit fresh 52-week highs and is now establishing above 1,000—a long way from the 330-low seen in March 2020. The CDNX should benefit from the commodity cycle, given its high number of mining stocks and junior oil and gas as well. That should help propel the CDNX even higher. Despite the rise to record highs, only 9 of the 14 sub-indices were up on the week. Information Technology (TTK) hit new all-time highs, up 2.9%. Health Care (THC) made fresh 52-week highs, up 0.8% on the week and now up 50% on the year. But the leader was Energy (TEN), up 5.3% and now up 14.8% on the year. The biggest loser was Utilities (TUT), down 1.7%. Income Trusts (TCM) were down 1.1%. Both are negatively impacted by rising bond yields as that helps push up the yields (and conversely lower prices which move inversely to yields) on these stocks. The TSX hit the top of a channel this past week. The TSX also appears to be rising within the confines of an ascending wedge triangle. A breakdown under 17,575 could signal a breakdown to near 16,200 to 16,500. A breakout above 18,550 would end thoughts of a breakdown. A move back under 18,000 would be mildly negative and suggest further declines.
U.S. 10-year Treasury Bond/Canadian 10-year Government Bond (CGB)
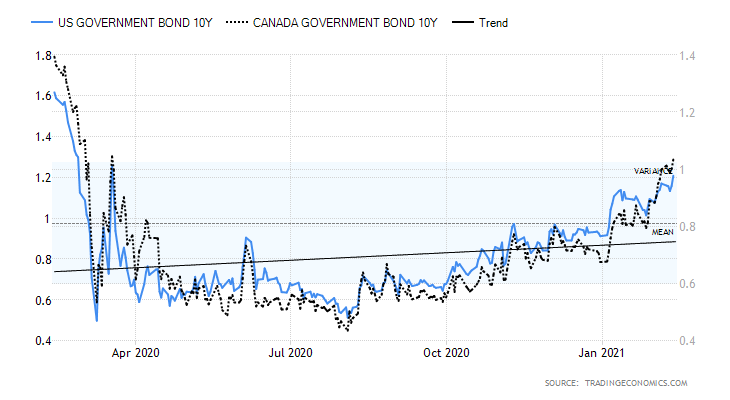
Bond yields continued to rise as commodity prices rose and there are signs that of some positive economic performance. The U.S. 10-year treasury note rose 4 bp this past week or 3.4%. Canadian yields also rose up 2 bp or 2.0%. That helped widen the 2–10 spread as the U.S. rose 4 bp to 1.10% and the in Canada it was up 4 bp as well to 0.84%. Great for banks. Consumer inflation expectations rose 3.5% in January when a rise of only 3% was expected. The key CPI was up 1.4% year over to January, but the January rate rose 0.3% which was above the 0.2% expected. The core inflation rate to January was also up 1.4%. That was actually below the expected 1.6%. Yet bond people keep pointing to rising inflation expectations, not the actual inflation rate. Elsewhere, the weekly jobless claims came in at 793,000 vs. 812,000 the previous week. The market had actually expected a rise of 750,000 but there was little reaction to the slightly higher than expected number. The Michigan Consumer Sentiment Index was at 76.2, below the previous month’s 79 and below expectations of 81. Bond yields are not being helped by the potential for a $1.9 trillion stimulus package as it leads to more borrowing. Higher borrowing attracts higher bond yields. But then the Fed will purchase a big chunk of it which doesn’t in effect spark much in the rise of bond yields. As well, the Fed is pushing for more longer dated bonds or even perpetuals. Still, traders are focused on higher bond demand due to borrowings from the government as well as higher inflation expectations. Both help push up bond yields (prices fall as prices move inversely to yields). As well, the pace of vaccines is encouraging bond dealers to expect a faster economic recovery.
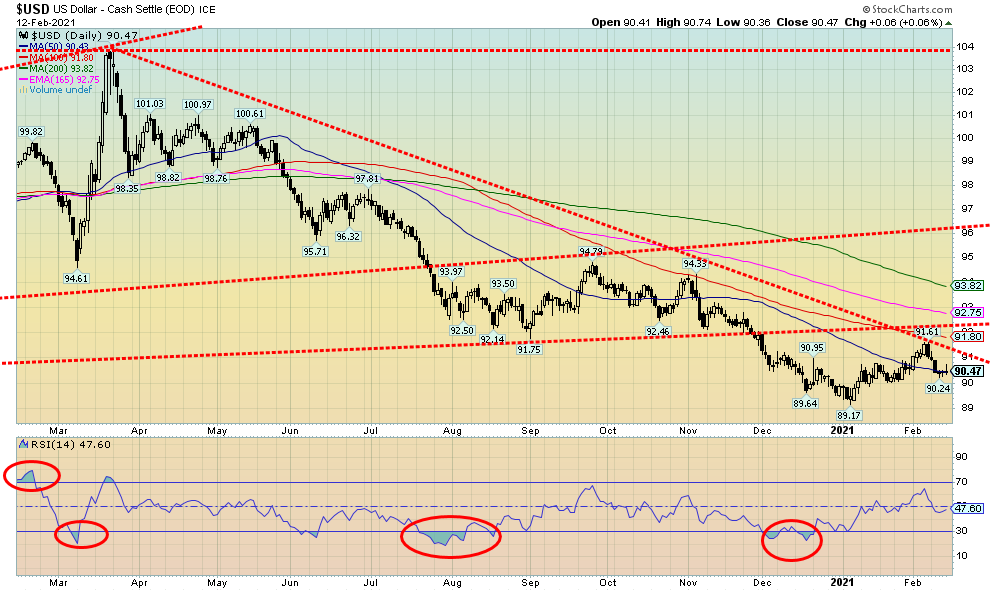
The US$ Index faltered this past week as it fell 0.6%. The euro gained 0.6% while the Swiss franc was up 0.8%. The pound sterling was up 0.8% to new 52-week highs while the Japanese yen gained 0.4%. The Canadian dollar also gained up 0.6% on the week thanks again to higher oil prices. The US$ Index closed at support of the 50-day MA on Friday. That may be it for this pullback before the US$ Index begins another upward trek. A break below 90 might negate that thought and under 89.75 we could have a new downtrend underway. The U.S. dollar is benefitting from a slightly better economic performance by the U.S., rising bond yields which are attracting funds from both the EU and Asia, and the stronger performance of the U.S. stock market. If that continues, expect the U.S. dollar to continue higher. A higher U.S. dollar is negative for gold prices. Resistance for the US$ Index is now up to 91.40 and then up to 92.20. Above 92.25 a run to 92.75 and even 93 is possible. Given the fundamental factors we cited, we see no reason why the U.S. dollar should fall unless there is a loss of confidence in the U.S. But we don’t see that. Not yet anyway.
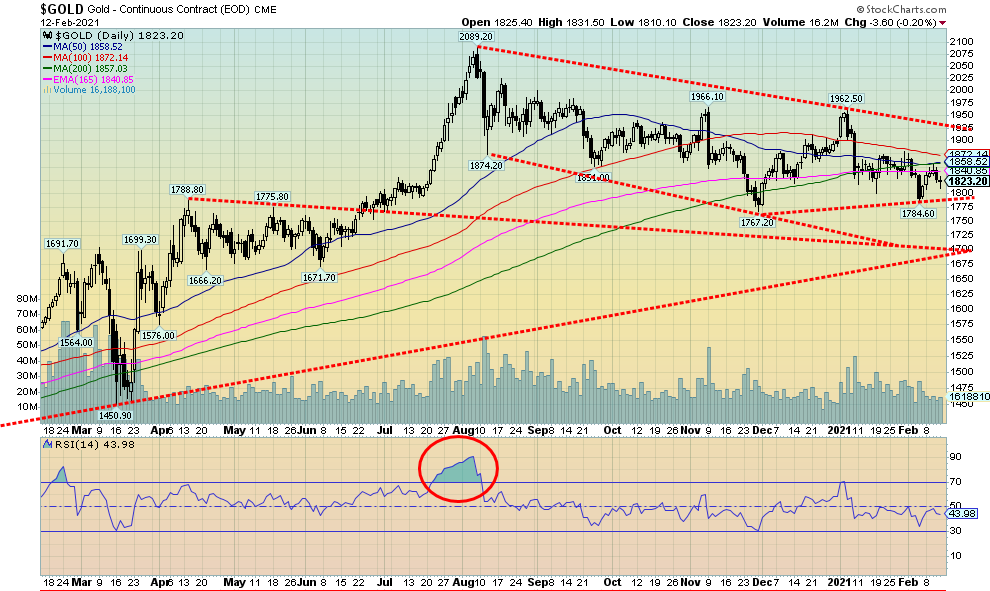
There may be a new grand Supercycle underway for commodities but gold, which is the key commodity in the precious metals sector continues to struggle so far in 2021. Gold did gain 0.6% this past week but it remains down 3.8% on the year. Silver on the other hand gained 1.4% and platinum continues to soar up 11.1% this past week. Platinum is now up 16.7% in 2021 and it made fresh 52-week highs this past week. Copper also made fresh 52-week highs this past week gaining 4.7%. Palladium did not want to be left out and gained 2.4% on the week. So, only gold stood out for its losses. Or, as we call it, an assault on gold via the futures (paper gold not real gold). With the commercial COT still quite short we are sure some of those commercials want out of their short positions so they help push it lower in the hopes of sparking a panic selling so they can buy back their positions.
Some could argue that gold appears to be forming a potential head and shoulders top pattern. The neckline lies just below $1800 around $1,790. A breakdown under that level could in theory lead to a decline to $1,595. That would spook a few people. It would also break that long-term uptrend line currently near $1,700. That would suggest that the gold bull market has ended and we are now in the throes of seeking our 7.83 cycle low and the 23–25-year cycle low, both of which are due centered around 2024. We currently believe we are still trying to find our 31.3-month cycle low which was last seen in August 2018 at $1,167. It is due April 2021 +/- 5 months. So anywhere from December 2020 to September 2021. That low on November 30, 2020 at $1,767 might have been it but it was rather early. If we do break under $1,790 minimum targets would be around $1,735-$1,750. We would certainly be more comfortable if we did hold above $1,700 on any decline to find that 31.3-month cycle low.
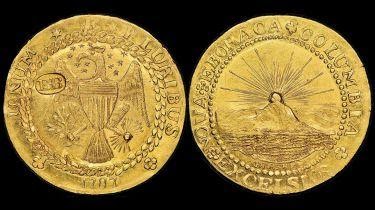
The prime reason for the weakness has been the stronger U.S. dollar of late. It is also unusual to see the lows for the year in February or anywhere in that January to May area. But two significant lows do stand out: February/April 2001 and February 2010. Both proved to be significant lows prior to gold taking off on strong bull runs. The February 2010 low is significant as after that we started the strong bull run that culminated in the September 2011 top over $1,900. Normally we look for strength into March for gold, but there have been years when gold faltered during that normally strong seasonal period. Demand in Asia for gold hasn’t been as strong this year as they seem to prefer silver this year. Despite all of this, we still believe that once gold finds this low a strong up move should get under way that will at least test the August 2020 high of $2,089 and more likely exceed it, targeting $2,200 to $2,400. None of this has curtailed the demand for fine gold coins as a 1787 Brasher Doubloon fetched a record $9.4 million at an auction in January. It seems that these Brasher Doubloons are revered by collectors. There are only 7 known and the one sold in January was noted as the finest. This one was minted in New York.
The Brasher Doubloon 1787
To the upside, nothing has changed. Gold still needs to regain above $1,900 although $1,880 is now a resistance zone, and above that $1,940–$1,960 is needed to convince us we are headed higher. In the interim, the risk remains to the downside as we seek our 31.3-month cycle low.
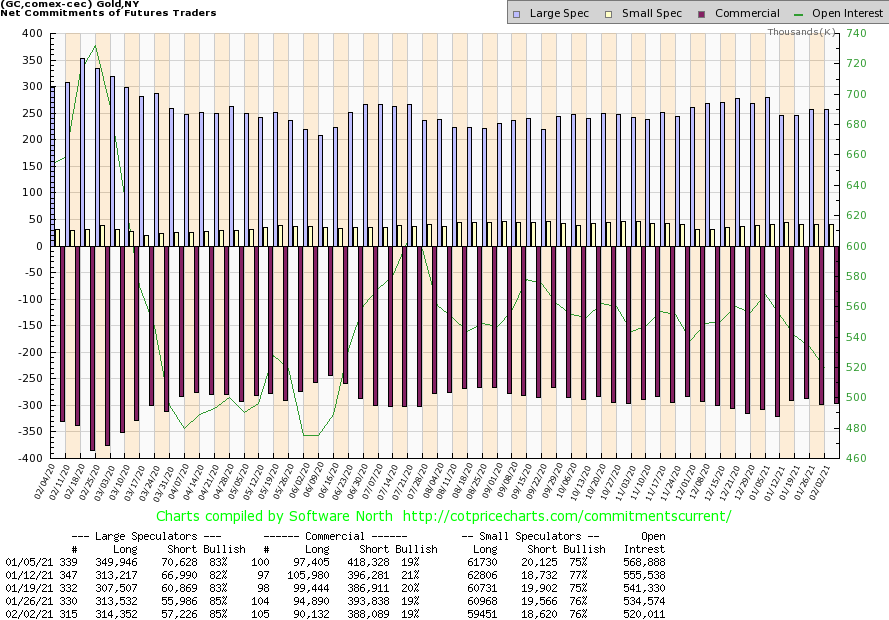
Once again, the commercial COT for gold remained static at 19%. There was, however, a decline of almost 6,000 contracts for short open interest but also a fall of almost 5,000 contracts for long open interest. That suggests both short and long covering. Overall, open interest fell over 14,000 contracts during a week when gold prices fell. This is consistent with a market covering positions rather than taking new positions. The large speculators COT (hedge funds, managed futures, etc.) was steady at 85% but again short open interest was down over 2,000 contracts while long open interest rose almost 1,000 contracts. Overall, the gold COT remains bearish.
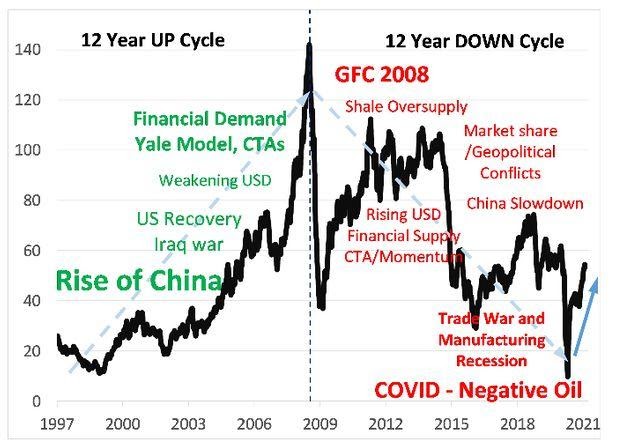
We couldn’t help but notice this article about a new cyclical commodities bull market we saw in MarketWatch (www.marketwatch.com), dated Feb 11, 2021. According to J.P. Morgan analyst Marko Kolanovic, a new commodity Supercycle is underway. This fits with our own thinking and observations and noted on a few occasions in The Technical Scoop over the past several weeks. As we have also noted, oil in particular has led the way but agriculture prices are also rising, primarily due to shortages not because of increased demand. Indeed, this commodity cycle will be primarily because of growing shortages, not because of demand. It is showing up in rising bond yields although inflation has not particularly picked up yet. Kolanovic notes that this is the fifth commodity Supercycle over the past 100 years. The previous one peaked in 2008. The 1970s commodities boom was followed by the 1980s commodity bust. Remember that this is still the early stages of this boom. And it will have an impact on numerous commodity-based stocks, many that trade on the TSX Venture Exchange (CDNX).
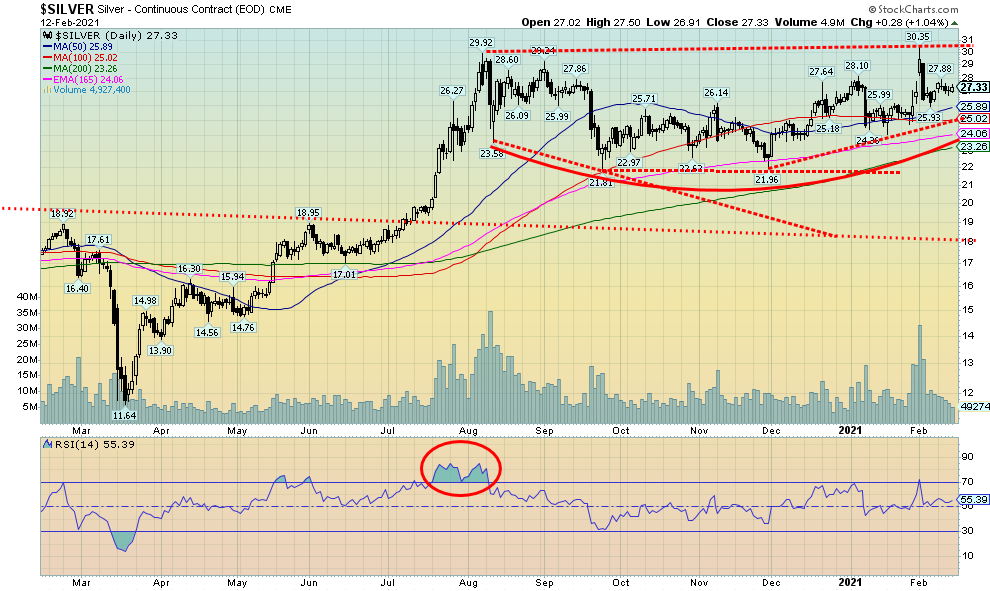
While gold struggles, silver continues to find a bid. Good demand for the poor man’s gold, particularly in Asia, is helping push silver prices higher. Silver gained 1.4% this past week and is up 3.8% so far in 2021. Gold, on the other hand, struggles and is down on the year. That has helped keep a bid for silver stocks, many of which have seen good gains already this year. Premiums on silver coins are 30%+ at SilverGoldBull (www.silvergoldbull.ca) for 1 oz silver maple leafs. Those are what we would call healthy premiums and reflect the demand for silver coins. On the other hand, the gold maple leaf 1 oz attracts a premium of only 7.6% to spot gold. Despite the up week, silver still needs to break out through $28 and especially above $29 to convince us we are going higher and take out that spike high at $30.35. That and it needs to continue to hold above $26. A breakdown under $25 would be negative and could then see silver fall to $23 or lower. The gold/silver ratio is at 66.72, down over 49% from its high. On the week, the ratio was mildly in favour of silver falling 0.6%. Silver has outperformed gold in 2021 and we view that as positive, not just for silver but ultimately for gold as well because silver tends to lead in both bull and bear markets. So, silver leading tells us we are and remain in a bull market. Silver has diverged with gold as silver saw new highs but gold didn’t in that recent spike and silver is well above its November 2020 low of $21.96 while gold hangs just above its November low. Despite our bullish forecast there are doubters out there who see silver (and gold) declining sharply. But our thoughts are they are ahead of themselves for the cycle lows we have previously cited of 7.83 years and 23–25 years for gold due more in 2023–2024. Silver’s 18-year cycle low is next due 2026–2028. But silver has also exhibited both 5–7-year cycles and half 9-year cycles. The 2015 low was most likely a 7-year cycle low dating from 2008 while the March 2020 low was probably a 9-year (range 7–12 years) cycle low. The next 5–7-year cycle low is therefore due 2021–2022. So, in reality we could still be in the process of trying to find that low despite silver’s outperformance of gold.
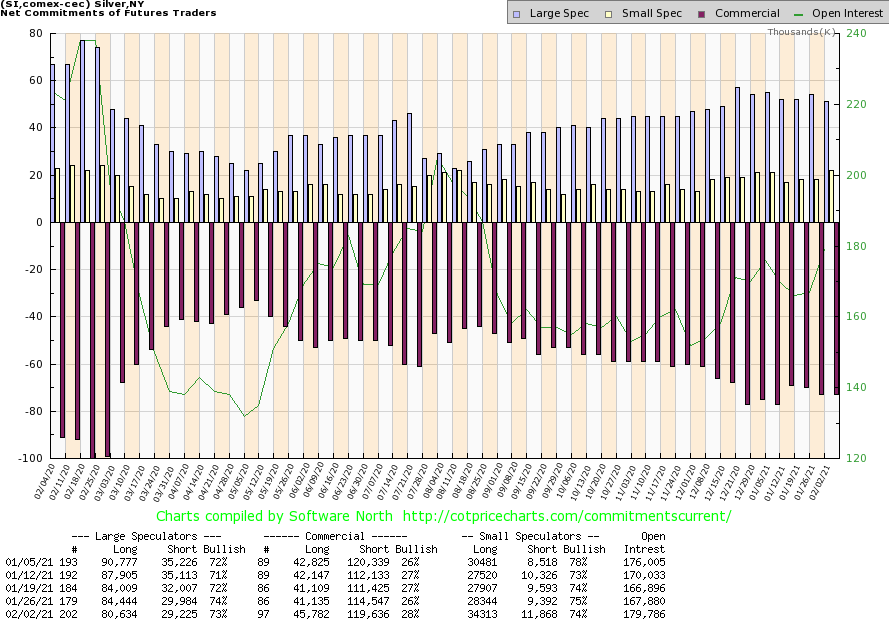
This week’s COT for silver is both good news and bad news. The good news: the commercial COT improved to 28% from 26%. For the bad news, short open interest was up roughly 5,000 contracts but then long open interest was also up over 4,600 contracts. The large speculators COT slipped to 73% from 74%. Total open interest rose some 12,000 contracts on a week that silver was also up. That’s good as well. Overall, we are mixed about this week’s silver COT but are encouraged by the rise in longs.
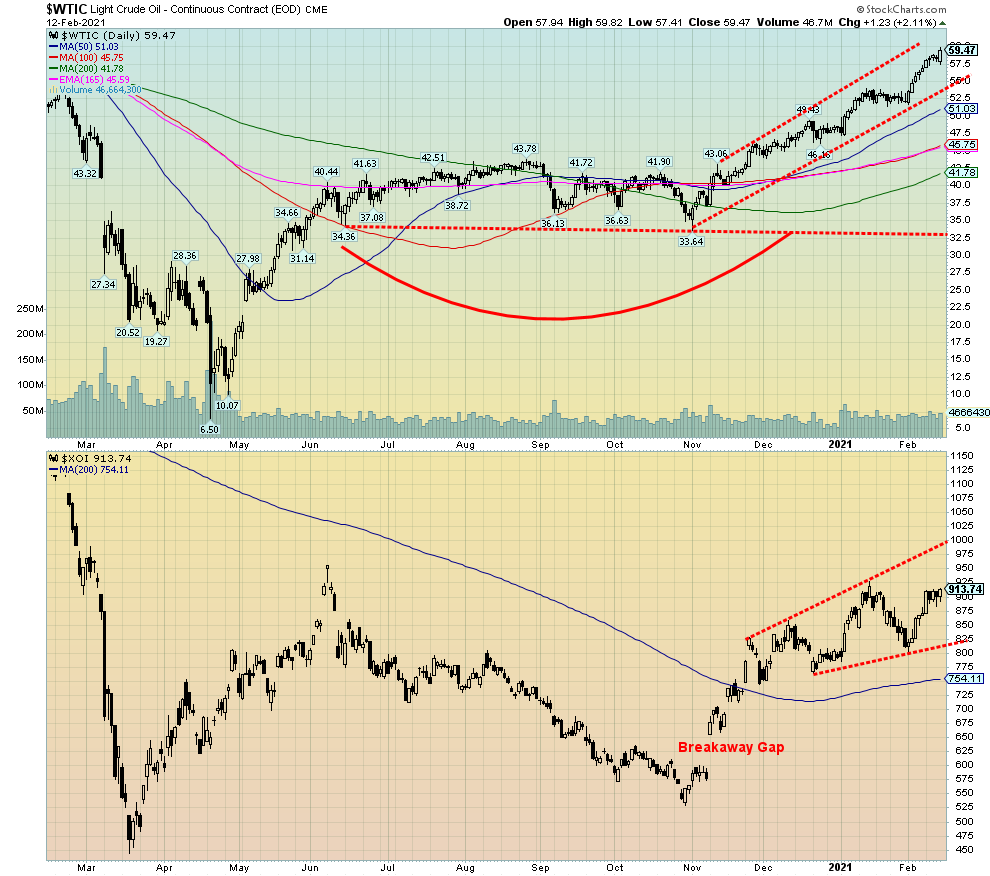
Onward and upward for oil prices, now approaching $60 for WTI oil. It now wouldn’t be surprising to see some profit-taking set in for both oil and the energy stocks. The $60 area should be a resistance zone. But if it can push through $65, then the mid-$70s would be next. WTI oil continues to rise in a good bull channel with no signs of topping action. WTI oil was up 4.6% this past week or around $2.60. Natural gas (NG) was also up gaining 1.8% while the energy stocks jumped with the TSX Energy Index (TEN) up 5.3% and the ARCA Oil & Gas Index (XOI) up 4.9%. The XOI is now up 15.3% on the year with the TEN up 14.8%. The Technical Scoop cited the breakout of the energy sector back in November 2020, targeting WTI oil up past $50 and possibly higher. We are now well into possibly higher.
Initial targets were for $53-$55, but given that has fallen, the next targets are now being approached at $60/$61. A successful puncture through those levels could next target over $70. Some are calling for $100 WTI oil once again but we don’t want to get ahead of ourselves. $100 oil would make the oil sands and shale industry viable again. The U.S. oil industry is predicting a return to growth for the shale industry.
OPEC forecasts have oil demand rising 5.8 million barrels per day (BPD) in 2021. Despite all the good news there remains pressure on the industry as S&P cut Exxon Mobil’s (XOM) credit rating to AA- with a negative outlook. S&P cited heavy debt loads as one of the prime reasons. Exxon is lucky. Many other major oil and gas firms have faced even deeper cuts to their credit and many have gone bankrupt. Marathon Oil (MRO) recently cut its workforce by 5%.
As we cited earlier, there is a commodity Supercycle underway and that has analysts predicting that the next targets for oil would be $65. We are not against that level as there is some congestion in the $60 to $65 zone.
Overall, we don’t see any signs of the oil rally abating, although we are now entering a new resistance zone between $60 to $65. So, as we noted at the outset, some profit-taking might now be in order and an opportunity to sit back and reassess. The XOI could be next targeting the top of that channel up near 1,000.
_
(Featured image by Marga Santoso via Unsplash)
DISCLAIMER: This article was written by a third party contributor and does not reflect the opinion of Born2Invest, its management, staff or its associates. Please review our disclaimer for more information.
This article may include forward-looking statements. These forward-looking statements generally are identified by the words “believe,” “project,” “estimate,” “become,” “plan,” “will,” and similar expressions. These forward-looking statements involve known and unknown risks as well as uncertainties, including those discussed in the following cautionary statements and elsewhere in this article and on this site. Although the Company may believe that its expectations are based on reasonable assumptions, the actual results that the Company may achieve may differ materially from any forward-looking statements, which reflect the opinions of the management of the Company only as of the date hereof. Additionally, please make sure to read these important disclosures.


Advances in Biomarkers and Targeted Therapies Transform Kidney Care in Autoimmune Disease
New biomarkers and targeted therapies are reshaping the management of kidney damage in autoimmune diseases like lupus and vasculitis. Experts...


Bitcoin Rises on Iran Deal as Crypto Markets React to AI and SpaceX News
Bitcoin rose above $65,000, gaining about 5% as a tentative Iran war agreement boosted markets. ETFs still show weekly outflows....

Rising Inflation, Fed Uncertainty, and Market Excess Amid War and SpaceX Mania
Rising inflation, driven by war, debt, and money growth, puts the Fed in a difficult position ahead of its meeting....


SpaceX IPO Sparks Déjà Vu as Market Risks Loom and Gold Bulls Stay Hopeful
The author compares the 2000 AOL Time Warner merger to SpaceX’s planned IPO, warning it may signal a market top....


The TopRanked.io Guide to 2026’s Biggest and Best Affiliate Opportunities
Want to earn affiliate commissions on literal billions of dollars worth of revenue? Then this week, we've got something special...
 |
|
 |  |
 |
|
-

 Crowdfunding1 week ago
Historic KiHa 2101 Railcar Restored in Japan Through Community Effort
-

 Fintech2 weeks ago
Barcelona Strengthens Its Position as a Southern European Fintech Hub
-

 Impact Investing4 days ago
EU Approves €23B Italian Renewable Energy Plan to Boost Climate Goals
-

 Biotech2 weeks ago
Early Use of Tirzepatide Shows Strong Results in Type 2 Diabetes Study