Featured
Dow Jones remains in tight trading range; Gold, silver futher decline
The four-month decline in gold and silver could mean that their prices are nearing their bottom, and the precious metals are ready to rebound.

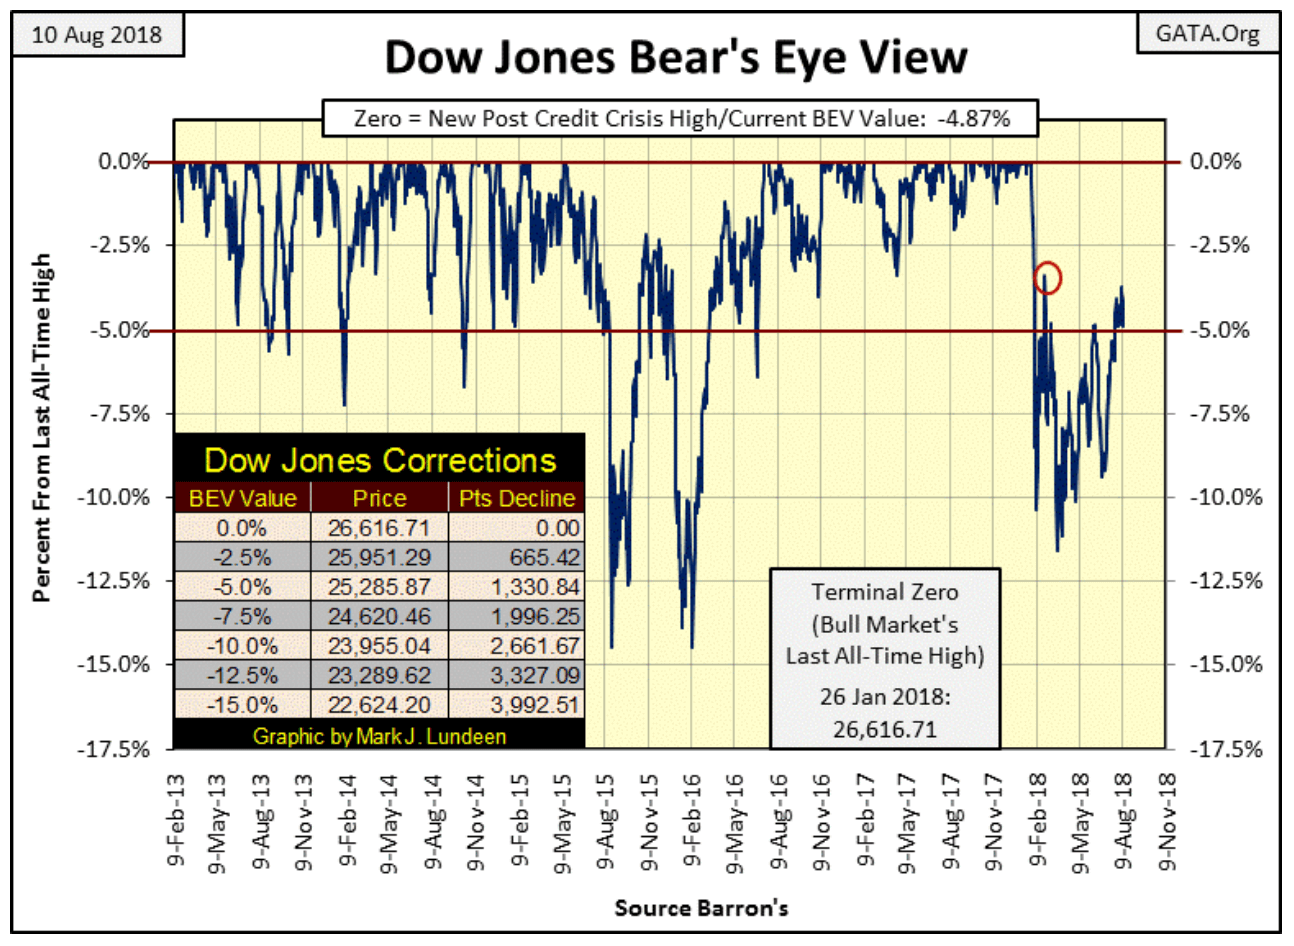
The stock market is in its dog-days of summer; for the past month the Dow Jones didn’t want to go up yet refuses to go down. Since July 16 (20 trading days), the Dow Jones has remained in a tight trading range in the BEV chart below, from -3.71 percent down to -5.91 percent.
Comparing the low volatility of the past 20 trading sessions with the other similar periods in the BEV chart below, it shows the past 20 trading days as something unusual but not really rare. If the past is any guide, and it usually is, when the Dow Jones finally breaks out of its current quiescent state of trading, we should see some excitement. Whether that’s to be a break out above its BEV -2.5 percent line or a decline below its -7.5 percent line is something we’ll just have to wait and see.
I still haven’t given up on the Dow Jones making a new all-time high. But from its close of today that would only be a gain of 4.87 percent in a market that I believe is at risk of declines of greater than 40 percent sometime in the next year. After a nine-year, 21,000-point advance in the Dow Jones, buying shares now in the broad market is buying at the top of the market. In August of 2018, that’s just a fact, and buying at a market top is something I’m not going to recommend my readers do.
© Mark Lundeen
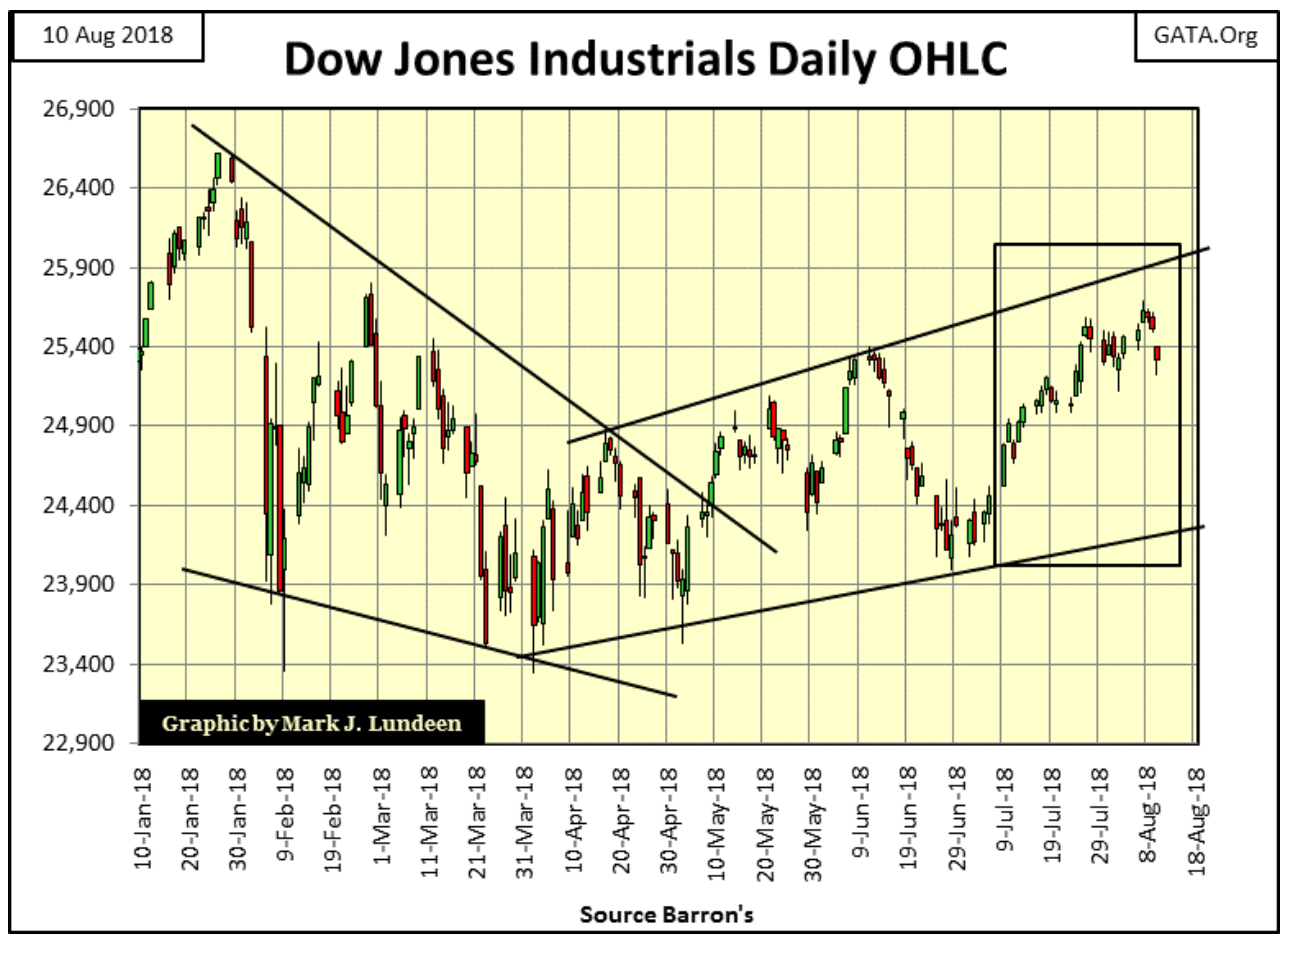
Looking at the daily bars below, the Dow Jones began the week well enough, but after Tuesday began leaking air. What this market needs is an “injection of liquidity” large enough to drive the Dow Jones up above its 25,900 line with authority. But will it get it?
Your guess is as good as mine. What isn’t conjecture is the Dow Jones isn’t going to remain in its current state of suspended animation forever. Somewhere ahead of us is a week or two of big daily moves that is going to put an end to this boring market action and most likely will show us the direction of the next big thing in the market.
© Mark Lundeen
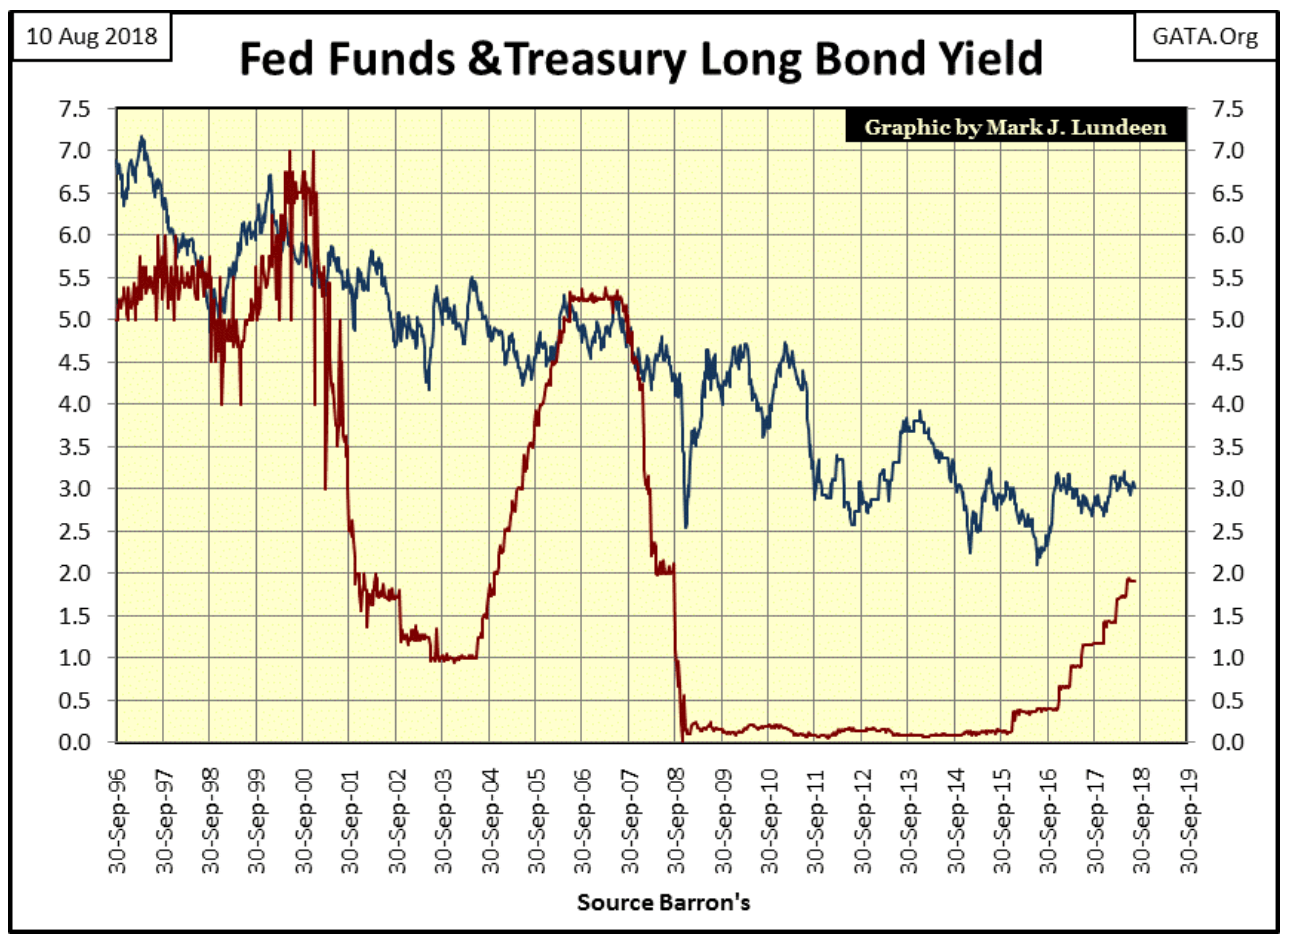
That interest rates and bond yields will be key to what the stock market’s next big move will be remains a logical assumption. In late 1999, seeing the Fed Funds Rate (Red Plot) rise above the long T-bond yield (Blue Plot), and again in 2006 signaled the end of a bull market in stocks. It won’t be any different this time when the FOMC once again inverts their Fed Funds Rate over the long T-bond yield.
© Mark Lundeen
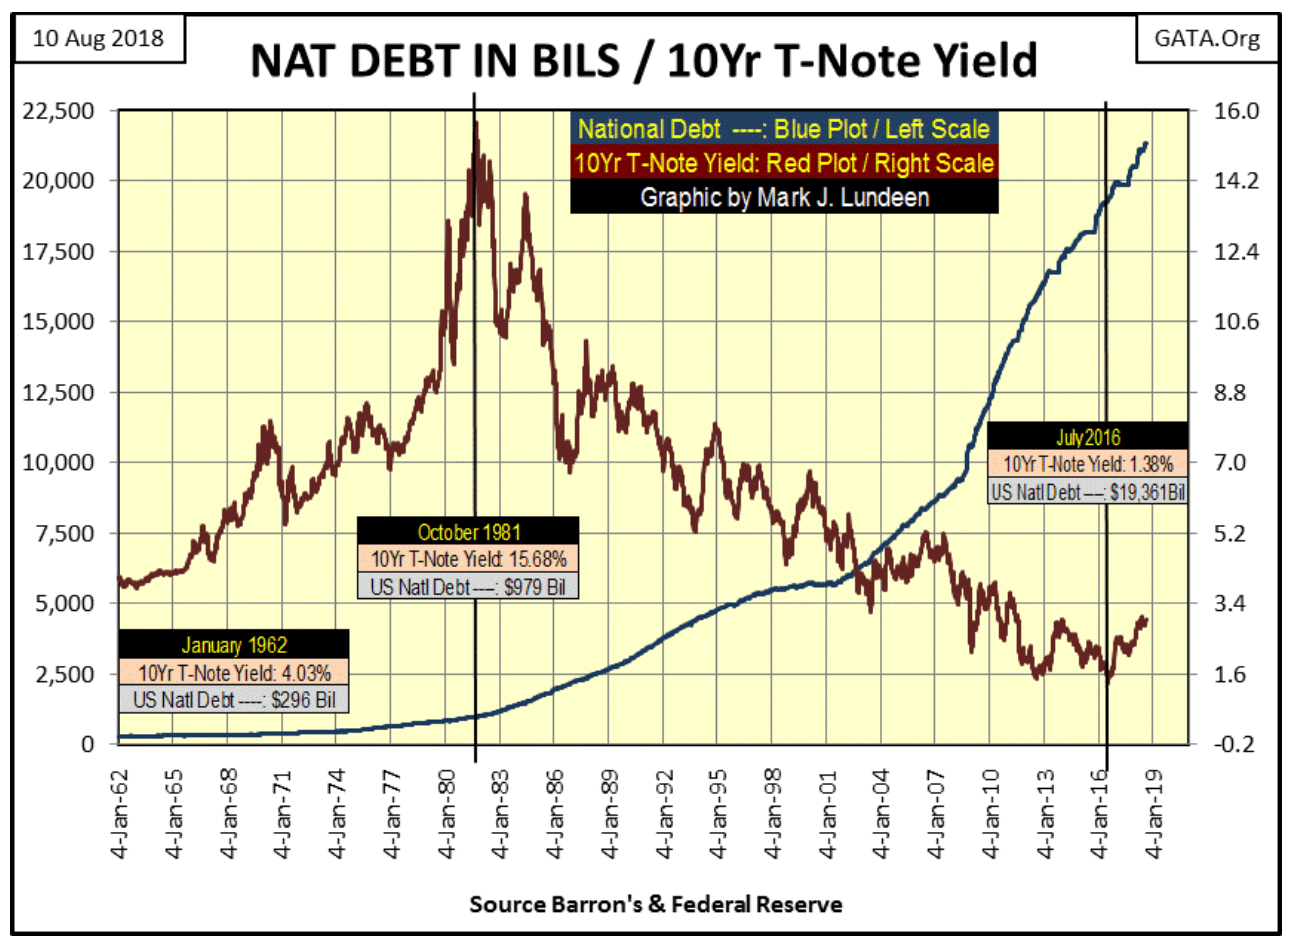
Last week, I wondered how bond yields could be so low in a world groaning with the burdens of debt it now carries. Look at the chart below. Why did T-bond yields peak at over 15 percent in October 1981? Annual double-digit percentage increases in consumer prices were one factor. But seeing the US National Debt increase from an alarming $296 billion in January 1962, to a shocking $1 trillion in October 1981 was a big factor too. Back in 1981, people were wondering how the US Treasury was going to repay all that money.
© Mark Lundeen
Today, who asks such questions? Does anyone wonder how students and consumers are going to pay back the debt they now carry? I don’t, because before the pending bear market concludes, they’re going to default on most, if not all of it. This is what Mr. Bear does when he pays Wall Street a visit; he stress tests everyone’s balance sheet. Inflated market valuations are deflated, not viable assets, such as but not limited to student and consumer debts are ultimately written off.
And if the US Treasury doesn’t default on its many trillions of dollars of obligations to its creditors, the dollar the Treasury’s debt is denominated in will become worthless. One way or another, the global debt markets are going to burn up like a Nebraska prairie fire.
But few people believe that is possible while it’s actually inevitable. In the chart above, look at what happened from October 1981 to July 2016. In these 35 years, the U.S. national debt soared from $1 trillion to $19 trillion as 10-year bond yields dropped from over 15 percent down to 1.38 percent. Exactly how does that work? It’s a “policy” thing most people wouldn’t understand—or so we’re told. But Robert Bleiberg had it exactly right in his editorial of 11 June 1979 below.
“To serve as a central banker, as BARRON’S again reminded its readers early last year when G. William Miller took over at the Fed, one needn’t be a flim-flam man, but it helps.” —Robert M Bleiberg: Barron’s Managing Editor, 11 June 1979
A reader (John S.) sent a link to me on an article by Trader Vic on the Treasury bond market. Trader Vic is a Wall Street legend who co-wrote “Crashmaker, a Federal Affair,” with Alvaro Almeida, a tremendous novel on the Federal Reserve which was actually fun to read. Here’s James Turk’s review.
Anyway, Trader Vic’s knowledge of the market is deep and anything he says I believe, as he has something the mainstream financial media lacks, something called credibility. Here’s the link John S. sent to me.
I’m not going to review the article above. It’s a short read. I’m just going to say you’ll appreciate just how ethically challenged bankers and their regulators have become in their many decade long efforts to keep market valuations inflated, and Mr. Bear far away from Wall Street.
But how long can the banking system continue bamboozling reality? Not forever is my answer. When this scam in the T-bond market concludes bond yields and interest rates are going to soar; and the Dow Jones, gold and silver are going to make history.
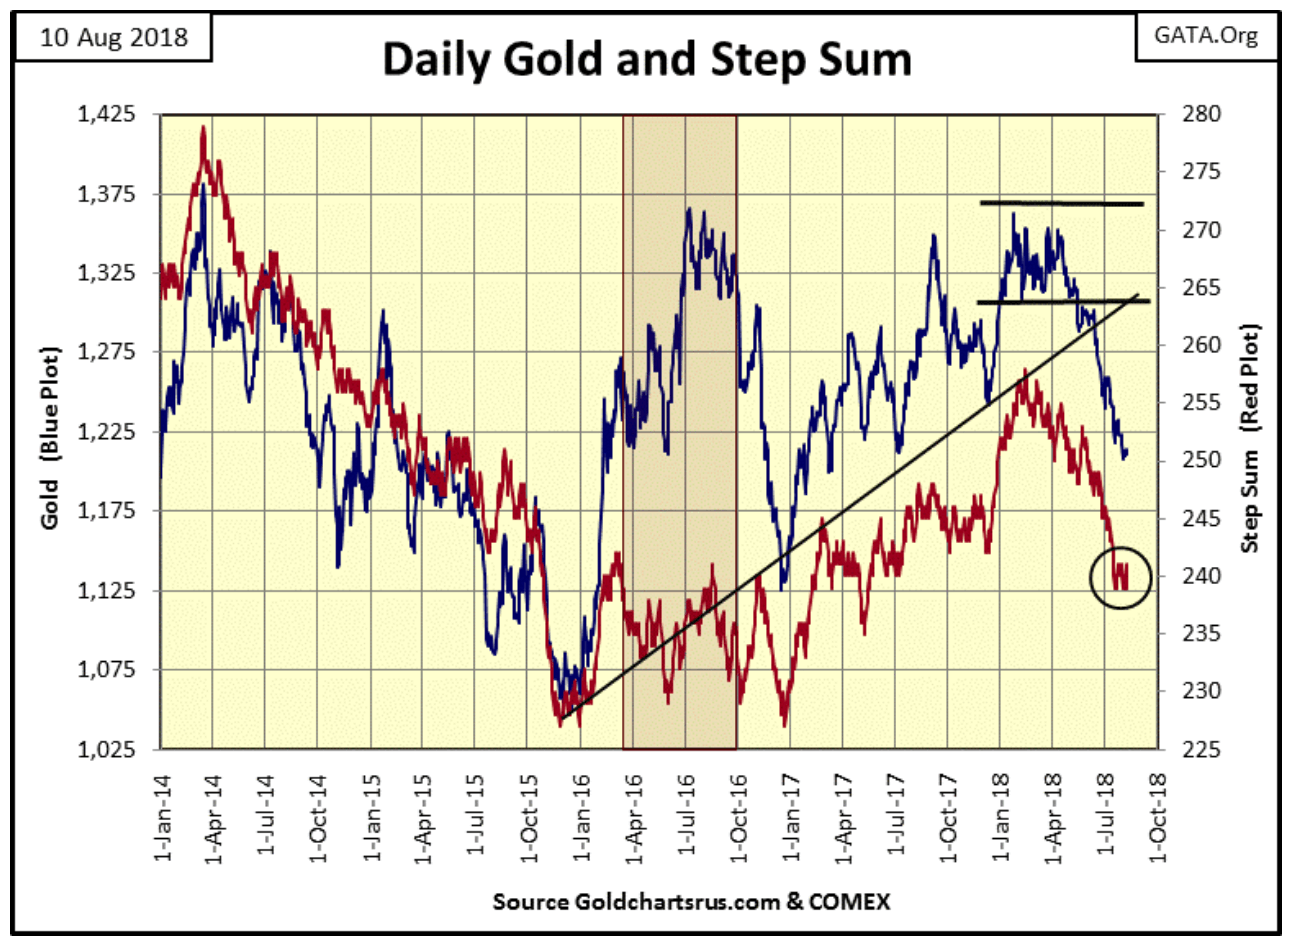
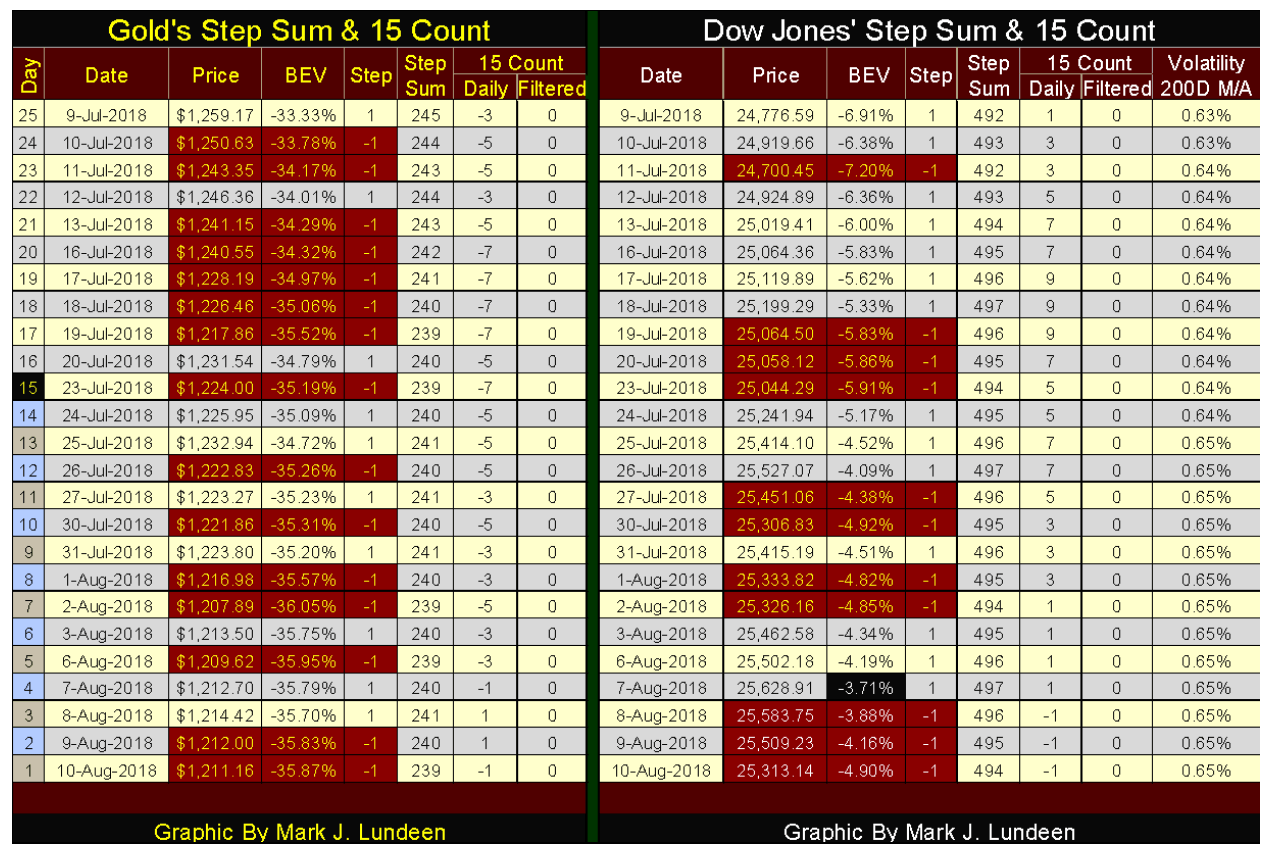
Not much in the way of relief has come gold’s way since early April. But seeing a four-month decline as we see below tells me a reversal is due. I circled gold’s step sum, it hit 239 on July 19, and hasn’t been able to break below it in the past 17 trading sessions. It may mean nothing; then again it may be an indication the current decline in the gold and silver markets is near their bottom, ready to rebound.
© Mark Lundeen
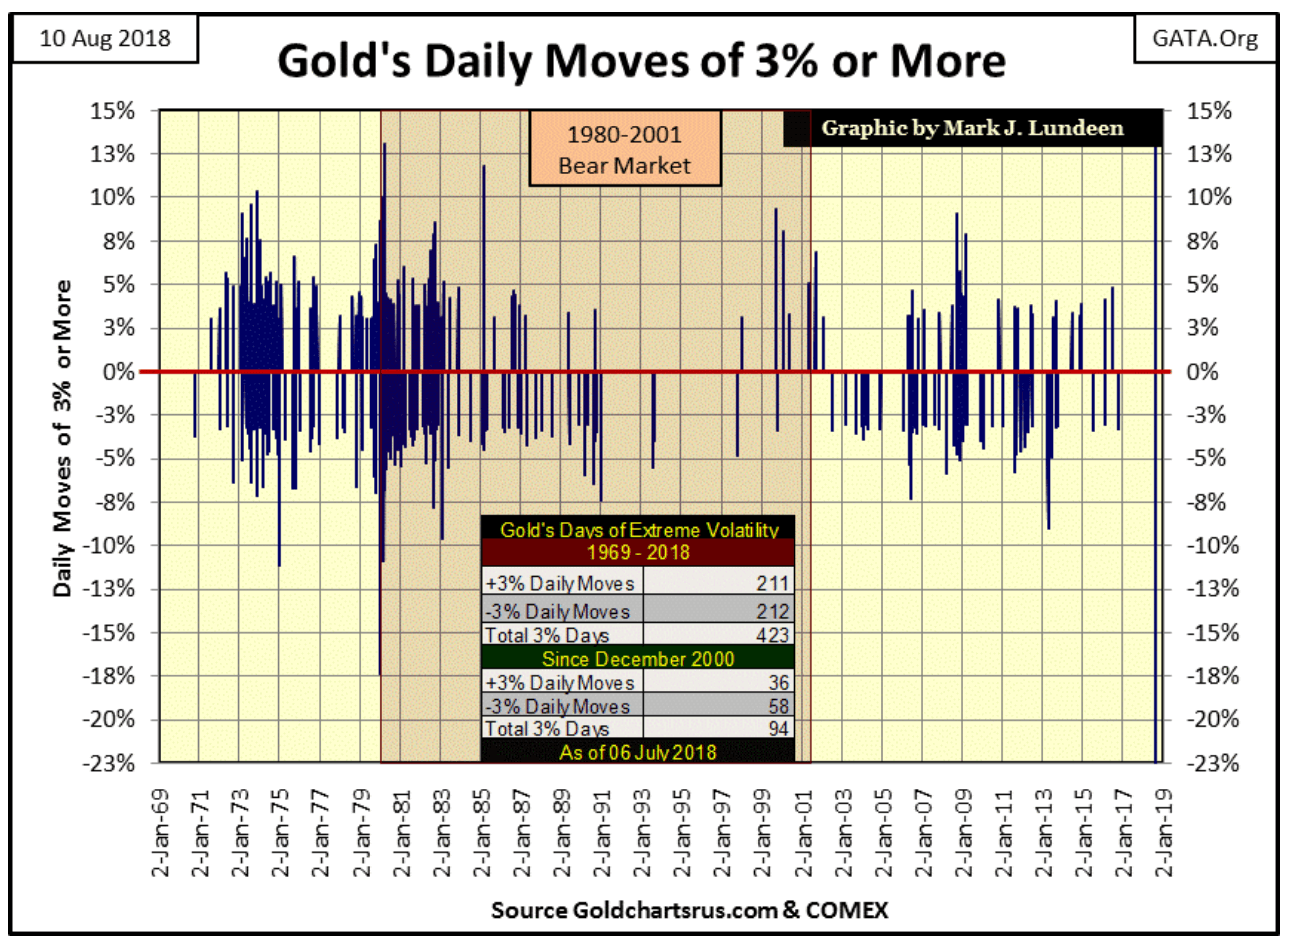
I haven’t covered volatility in the gold and silver markets for quite a while, as there hasn’t been much to write about. Like 2 percent daily moves for the Dow Jones, I look at 3 percent days for gold and 5 percent days for silver. These percentage values are arbitrary, so if someone decided to use different values there is nothing fundamentally wrong doing so, but these work for me.
In August 2018, I find it interesting how gold hasn’t see a day of extreme volatility, a 3 percent day since October 4, 2016 in the chart below. Just eyeballing the chart, this is the longest gap between 3 percent days gold has seen since the 1990s.
© Mark Lundeen
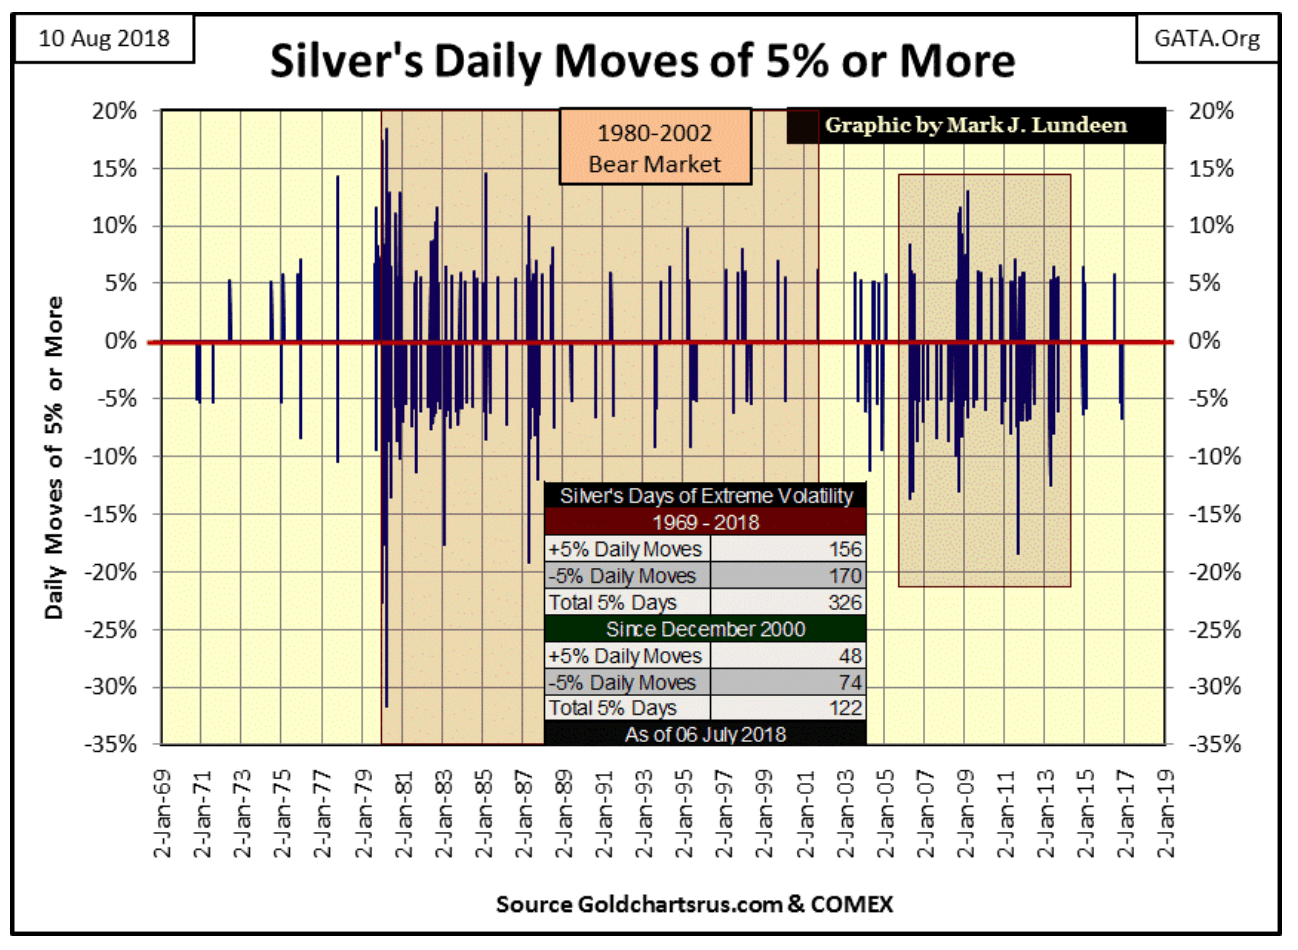
Below, silver’s last day of extreme volatility (5 percent day) was on November 11, 2016. That’s a long time too.
© Mark Lundeen
With the Dow Jones, extreme days are usually associated with market declines, though occasionally they happen in isolation during market advances. It’s different for gold and silver. With the old monetary metals, extreme days of volatility happen when the market is moving with authority to either the up and down side.
That gold and silver haven’t seen a day of extreme volatility for almost two years tells us how boring the market action has been for the metals since 2016. That’s not saying that the decline in gold and silver prices since April haven’t been grating on our nerves. It has been. I’m only pointing out that a >3 percent daily move in gold or a >5 percent daily move in silver are big market events that we haven’t seen for almost two years now.
Note the multitudes of extreme days gold and silver saw during their 2011-2015 market declines, extreme days the gold and silver market has been totally free of since their current declines began in April.
Like anything else in the markets, the current calm in the gold and silver markets isn’t a permanent condition. I’m going to begin watching for 3 percent and 5 percent days in the precious metals. Seeing gold and silver begin forming a new cluster of extreme days (both positive and negative) in their charts above come their next advance would be a very bullish situation.
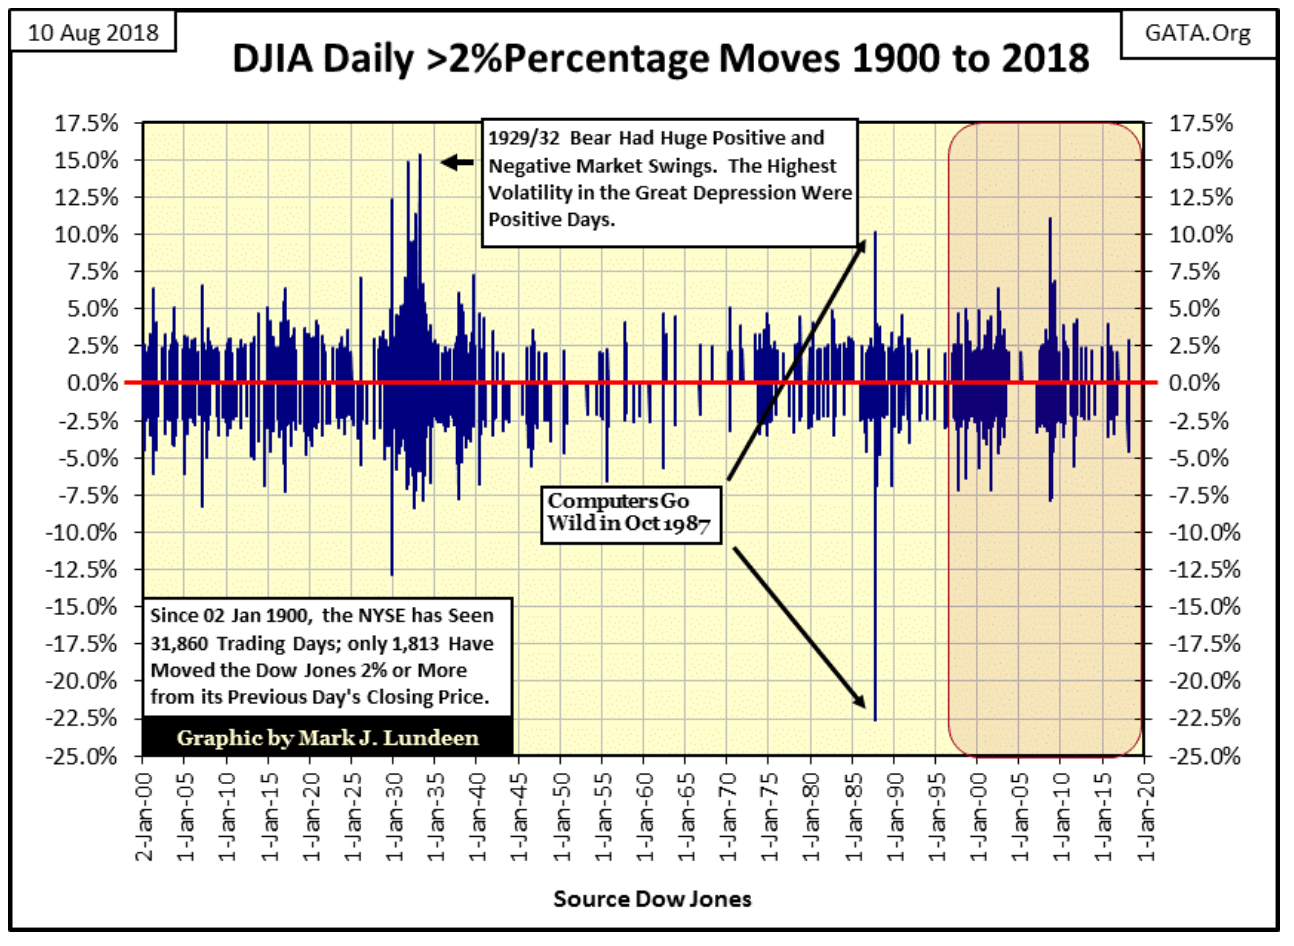
As I mentioned days of extreme volatility for the Dow Jones, I may as well show a chart for the Dow Jones 2 percent days too. The last Dow Jones >2 percent day was on April 6 of this year. That was only four months ago.
© Mark Lundeen
The Dow Jones’ 200 count is plotted below, or the number of (+/-)2 percent days the Dow Jones has seen in a running 200-day sample. This chart shows how toxic extreme volatility is to the stock market. Note how the current Dow Jones top of January 26, (26,616.17) corresponds with a rise in the Dow’s 200 count from zero to seven.
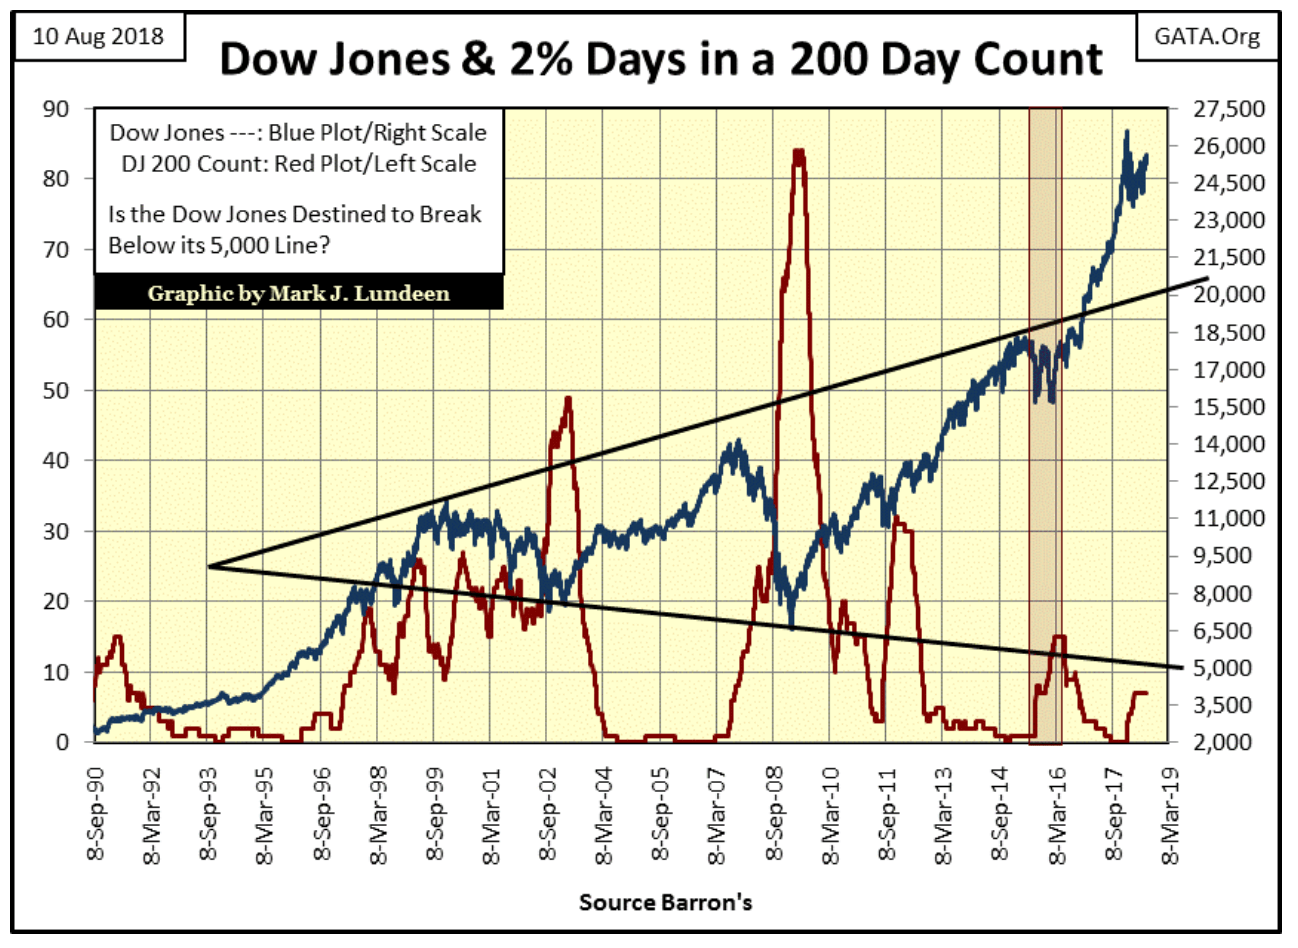
© Mark Lundeen
The first of these seven extreme days occurred on February 2, and the last on April 6. So for the past four months, the market has been free of them. But if you look at the Dow Jones Step Sum Table below, note the Volatility 200 Day M/A column.
© Mark Lundeen
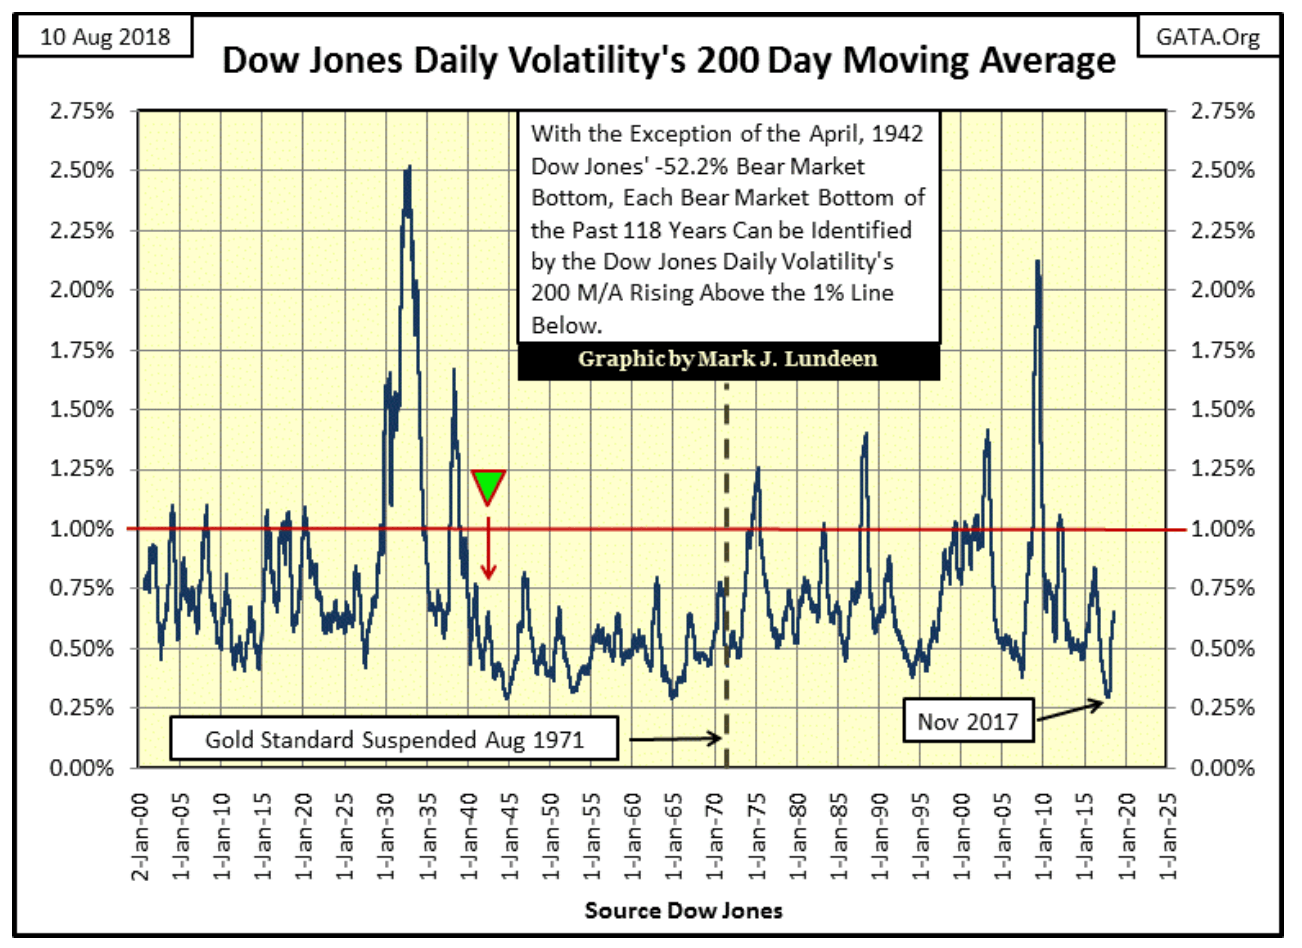
What’s being recorded in that column can be seen in the chart below plotting the daily volatility for the Dow Jones going back to January 1900. Note how volatility bottomed last November, two months before the Dows Jones made its last all-time high in January 2018.
We’ve seen the Dow Jones 200 count increase to only seven since January in the 200 count chart above, but looking at daily volatility for the Dows Jones below, its 200 day M/A bottomed at 0.30 percent last November and closed this week at 0.65 percent. This is a big increase in daily volatility, and soon after it began increasing in November 2017, the Dow Jones peaked two months later in January.
Should this trend in rising daily volatility continue, and push the plot above the 1.00 percent line, 118 years of market history seen below strongly suggests we’ll be in the third bear market since the beginning of the 21st century.
© Mark Lundeen
—
DISCLAIMER: This article expresses my own ideas and opinions. Any information I have shared are from sources that I believe to be reliable and accurate. I did not receive any financial compensation in writing this post. I encourage any reader to do their own diligent research first before making any investment decisions.


Youth Cannabis Use in Colorado Is Falling — But the Full Story Is More Complex
The 2026 Colorado survey shows teen cannabis use fell to 10 percent in 2025, down from 21 percent in 2015....


Morocco’s Growth Holds at 4.6% as Agriculture Offsets Economic Pressures
Morocco’s economy grew 4.6% in Q1 2026, driven by a strong agricultural rebound offsetting declines in industry. Services expanded moderately...


Abivax Shares Surge as New Trial Data Eases Safety Concerns Over Ulcerative Colitis Drug
Abivax shares surged nearly 36% after positive updated trial results for its ulcerative colitis drug obefazimod reassured investors following earlier...


El Dorado Raises $9M to Expand Cross-Border Fintech Platform
El Dorado, a Latin American fintech improving cross-border financial services, raised a $9 million Series A led by Paradigm with...


Bitcoin Stalls Near $60K as Strategy Moves, ETFs Outflow, and EU MiCA Rules Take Effect
Bitcoin hovers near $60,000 with ETF outflows, while Strategy boosts reserves, sells BTC, and raises dividends to reassure investors. Ethereum...
 |
|
 |  |
 |
|
-

 Biotech1 week ago
Galicia Launches €805M Biotechnology Strategy to Drive Innovation and Competitiveness (2026–2030)
-

 Crypto2 weeks ago
Bitcoin and Ethereum Markets Steady as Strategy and Bitmine Expand Holdings Amid World Cup Crypto Activity
-

 Impact Investing5 days ago
ESG Gap Persists as Firms Struggle to Link Sustainability to Financial Value
-

 Crowdfunding2 weeks ago
Temotiva Launches Crowdfunding Campaign to Advance Preventive Mental Health
You must be logged in to post a comment Login