Featured
2020 forecast for the economy and the stock market
There are reasons to be optimistic about 2020 but storm clouds continue to gather and there are serious questions about whether the big bust will finally hit. We’ve been on a bull run for almost 11 years. It is arguably the most heated bull run ever and that alone should almost ensure it will continue. Despite investor enthusiasm cracks are beginning to show and 2020 could be the year of the bear.

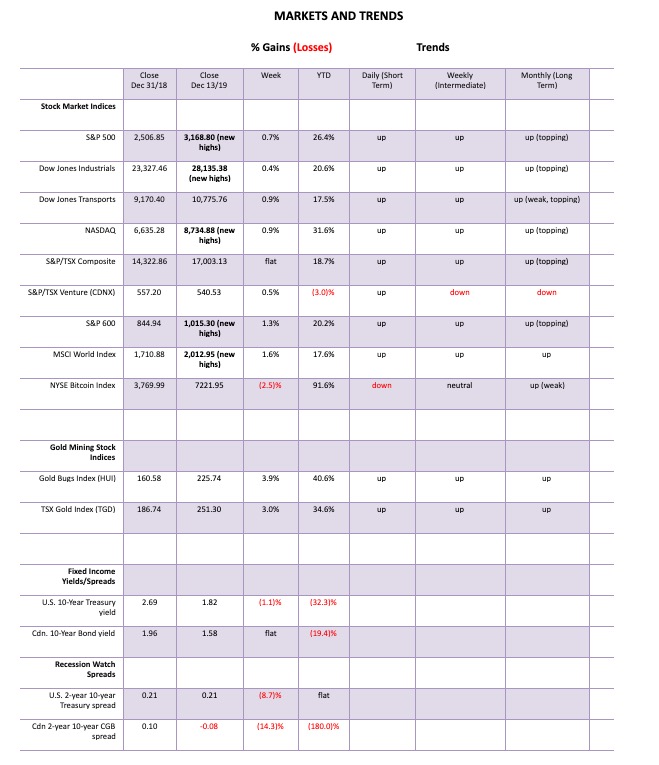
2019 has been a very good year. Following the volatility of 2018, 2019 was, by contrast, a low volatility year with global stock markets generally up on the year. A check of global stock markets showed only three listed in The Economist (Dec. 7–13, 2019) down on the year: Indonesia’s IDX, Malaysia’s KLSE, and Poland’s WIG. The best performing stock market in 2019 is a surprise—Russia. Russia’s RTS Index is up roughly 34% year-to-date. We are ignoring, however, Venezuela’s IBVC Index. It is up a whopping 4,054%. However, once one factors in the collapse of the Venezuelan Bolivar and inflation, the return is actually negative in U.S. dollar terms. The best performing North American index has been the NASDAQ, up roughly 31% on the year. Canada’s TSX Composite has returned a much more modest 19% in 2019.
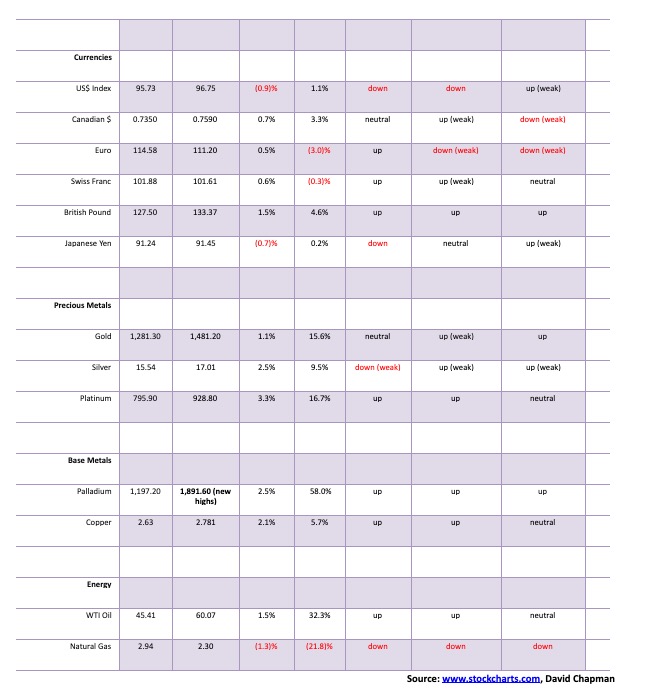
The positive year has spread elsewhere as well. Gold is up 15.6%, while silver is up a more modest 9.5%. WTI oil prices are up over 30%; however, natural gas is down more than 20%. Gold stocks have performed well, with both the Gold Bugs Index (HUI) and the TSX Gold Index (TGD) up well over 30%.
The Fed last hiked the official rate in December 2018 to 2.50%, but concern over slowing global growth and the trade wars sparked them to cut rates in July 2019. Since then, they have carried out two more cuts, and the current rate stands at 1.75%. On the other hand, the Bank of Canada (BofC) has held the bank rate steady at 1.75% throughout 2019. However, bond yields have fallen with the U.S. 10-year Treasury note falling to 1.82% from 2.69% and Canada’s 10-year Government of Canada bond (CGBs) falling to 1.58% from 1.96% in 2019.
The past 10 years have also seen strong returns. The Dow Jones Industrials (DJI) has gained 167% since Dec. 31, 2009, suffering only two down years in the process: 2015 and 2018, losing 2.2% and 5.6% respectively. The TSX Composite has not fared nearly as well, gaining only 45% in the past decade, dragged down by poor performances from Energy, Golds, and Metals & Mining. The TSX suffered losses of roughly 11% in each of the years 2011, 2015, and 2018. Gold, mining, and energy stocks have been poor performers over the decade, all lower today than they were in at the end of 2009. The small-cap TSX Venture Exchange (CDNX) is down 64% from where it was a decade ago. In between, however, gold, mining, and the CDNX had huge runs that topped in 2011. Only gold has managed a positive return over the past 10 years, up 36%.
December 2018 was the worst December since 1931 during the Great Depression. Stock markets were down 20%, by definition the start of a bear market. The “R” word was on everyone’s lips; there was fear of the Fed hiking interest rates more, triggering a recession. There were worries about the trade war between the U.S. and China. Consumer confidence was sagging. On Dec. 19, 2018, the Fed hiked the funds rate to 2.5% but hinted it could be finished. The Fed and Trump started talking positively about interest rates and there was some easing of trade tensions with China. That was the spark and the market started rising on Dec. 26, 2018. It never looked back.
By May, the stock market had recovered the late 2018 highs. Yes, it paused at that time, suggesting that the rebound was merely a corrective up move to the October/December 2018 collapse. But after five months of back and forth action with slight new highs, the market burst out once again to new all-time highs in October 2019. The question is, will the market continue its winning ways into 2020, or will it falter, given it has once again reached the top of a well-defined channel?
There are reasons to be optimistic about 2020, and then again there are reasons for pessimism. Storm clouds are gathering as they have been it seems for years. The bull market has now been going for nearly 11 years. They say it is the most hated bull market ever. That alone should almost ensure it will continue. But will it?
What they seem to be ignoring, or at least trying to push aside, are systemic risks that are not going away. We list them in no particular order as: 1. World trade, 2. Climate crisis, 3. Debt, 4. Global protests, 5. Rise of populist governments.
The slowdown in global trade could soon become worse. Since January 2018, the U.S. and China have been in a tug-of-war over trade with tit-for-tat tariffs, even as they try to put together a new trade deal. The good news is that both are motivated to succeed. But none of this has stopped a general decline in global trade.
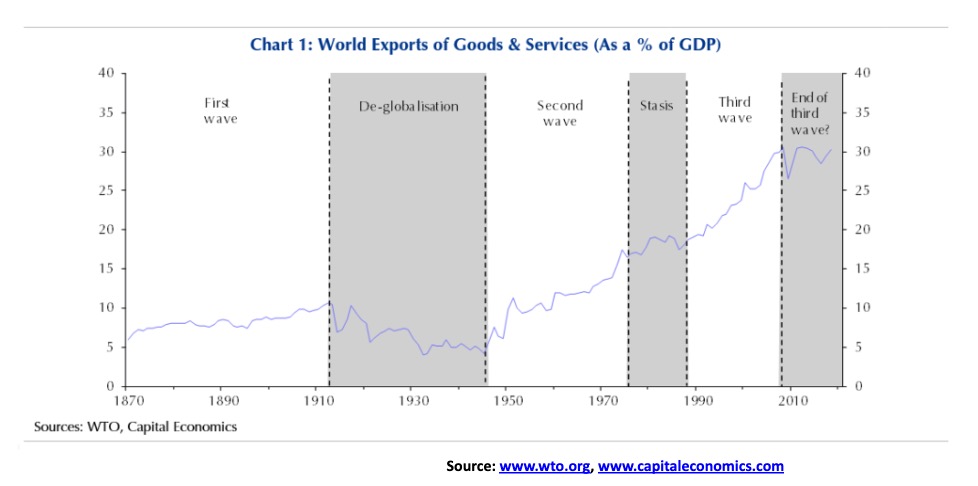
This is an interesting chart that shows the first wave of globalization ran into a period of de-globalization, culminating in the Great Depression. The second wave of globalization ended in a long period of stasis where it just paused through the 1970s and 1980s. The third wave of globalization also now appears to have peaked. Each wave of globalization was driven by technology and productivity. But the ability now to just shift plants all over the world, chasing cheap labor costs, is declining. The technology could change that and make it increasingly unnecessary.
The biggest threat to global trade is coming from the U.S. Given the U.S.’s general control of world bodies such as the World Trade Organization (WTO), it is no surprise that under Trump the WTO has been constantly weakened. Now the WTO’s appellate body—effectively the world’s highest appeal court when it comes to trade—has become defunct, thanks to the U.S. This could become particularly dangerous as, with no referee, world trade could degenerate further into warring camps and tariffs. A return to the trade wars of the 1930s? That, in turn, could have a negative impact on global stock markets.
The Baltic Dry Index, a measurement of dry bulk shipping stocks around the world have fallen almost 30% since peaking in August 2019. It is down 88% from its all-time high seen back in 2008 before the financial crisis hit. In North America, the Cass Freight Index, a measurement of freight volumes and expenditures in North America, is running below levels seen in 2018 and has been in decline since May. We have often noted that the Dow Jones Transportation Index (DJT) is not only well below its all-time highs but it is trading below highs seen earlier in 2019. This is a significant divergence with the DJI. All of this is a sign of declining world trade and a negative sign for stock markets.
The U.S. and China reached an agreement on phase one of their trade deal on Friday. This averted an escalation of the trade war and the potential for additional tariffs. Stock markets rejoiced, but closed the day well off their highs. Buy the rumor, sell the news? What has been agreed is less than the sum of its parts and actually accomplishes little. Except stave off additional tariffs at this time.
The climate crisis, whether one wishes to accept it or not, is moving more to the forefront. Banks, insurance companies, corporations, and governments are increasingly having to take it more seriously because of the visible destruction it is causing. High-profile people such as former Bank of Canada and Bank of England governor Mark Carney has been appointed UN special envoy on climate action and climate finance. Wildfires, heatwaves, floods, destructive hurricanes, and more are becoming frequent and more intense. Cities are sinking—Venice, Jakarta, and others. India has experienced killer heat waves, destructive flooding, and severe drought all in the same year. The 100-year floods are becoming a yearly occurrence and destructive wildfires, because of persistent drought conditions, have become the norm. We could go on.
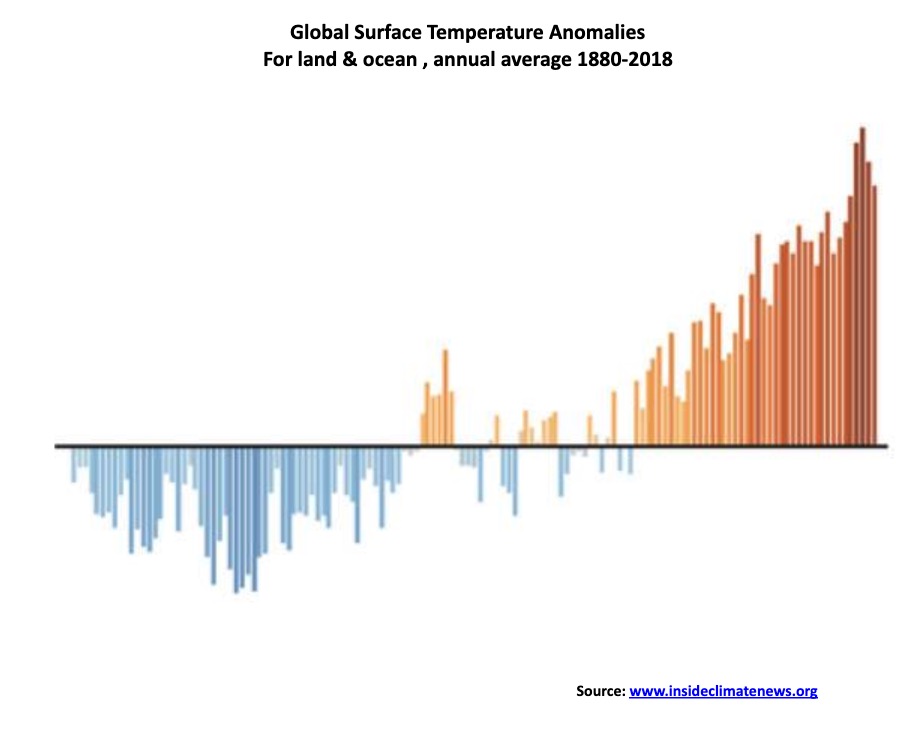
There is a severe risk that the world fails to prevent a further rise in global temperatures. This past week’s U.N. climate summit in Madrid was very fractious ending with no deal. The past decade is the hottest on recorded record even as historically there have been periods of warming and cooling. Twenty of the warmest years on record were recorded in the past 22 years. The negative economic effects of global warming are already being felt in numerous countries and its impact could fall most negatively on developing economies. Tens of thousands have already been displaced because of the destructiveness of flooding, wildfires, hurricanes, and more. Those that can afford to rebuild are. But the vast majority who cannot afford to rebuild has become effectively homeless or are forced to move. Insurance rates in danger zones subject to repeated flooding, hurricanes, and wildfires are becoming prohibitive—assuming one can even get insurance. It is the second half of this century that could see the worst effects. A fight for dwindling resources, particularly in developing countries such as Africa, raises the specter of more war and terrorism. Oh yes, and Greta Thunberg was just named Time magazine’s Person of the Year.
In terms of cost for the climate crisis, the worst is yet to come and estimated to be in the trillions. According to one study, it is estimated that the cost of fighting climate change could cost upwards of $12 trillion by 2100 with action. If no action is taken, one could double that figure. It is no surprise to read that cities here in Canada alone are wrestling with the costs of major upgrades to infrastructure to accommodate severe flooding that has taken place yearly over the past number of years. The current infrastructure is inadequate and antiquated. The costs related to insurance and rebuilding increasingly fall on homeowners. All of this could have a negative economic impact going forward. Add to that growing protests because of inaction or inadequate action. These protests could eventually become more violent as efforts are made to suppress them and that in turn would have a negative economic impact.
Then there is the debt: $250 trillion and counting.
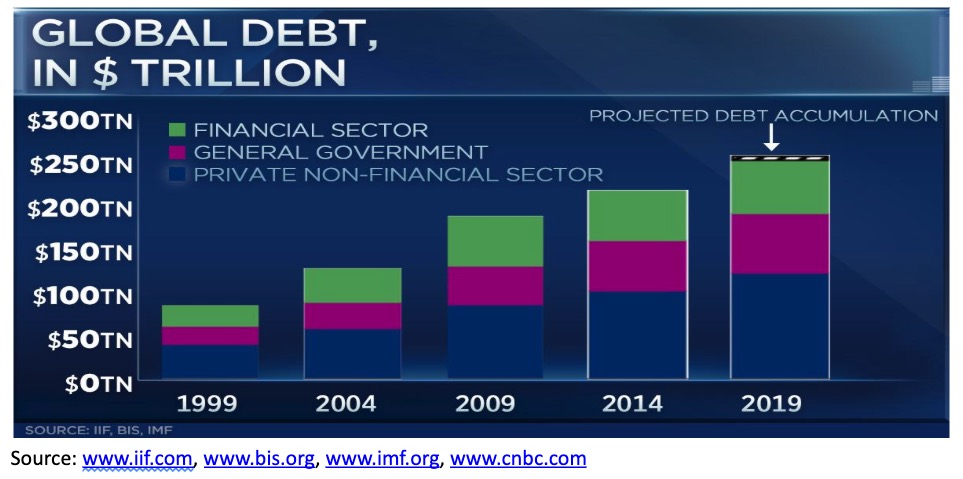
There is a serious problem if the only way forward and the way to add to GDP growth is to incur more debt. Global GDP was estimated at $84.8 trillion in 2018 and is projected to grow to $88.1 trillion in 2019, a rise of about $4 trillion or 3.9%. Global growth is projected to fall to 2.9%–3.0% in 2020. Debt, on the other hand has grown $7.5 trillion alone in the first six months of 2019, according to the International Institute of Finance (IIF) and is projected to hit $255 trillion by year-end. Overall debt is projected to grow $11.6 trillion in 2019, implying that it has taken $3.50 of new debt to purchase $1 of GDP.
With rising debt and interest rates already at record lows, plus upwards of $17 trillion of negative-yielding debt primarily in the E.U. and Japan, there is little room for governments or corporations for that matter to add more to this or to do more to offset the massive accumulation of debt. But add more they might. There are growing financial problems everywhere. There is the potential for a major sovereign default. Countries overburdened with debt include Argentina, Brazil, South Africa, Italy, Lebanon, Greece, and, yes, even the U.S., the world’s most indebted country now adding to their debt at over $1 trillion/annually.
There has been rising debt in emerging markets of not only government debt but corporate debt, much of it in U.S. dollars. The cost to service this debt is rising because of a persistently high U.S. dollar. Given their earnings are in their home country but the debt is in U.S. dollars means they could be paying back far more than they originally borrowed. The risk of defaults rises. Emerging market corporate debt is estimated at over $30 trillion. Corporate debt is also becoming a major problem in major economies as well. The IMF estimates that 40% of corporate debt totalling at least $19 trillion in major economies such as the U.S., China, Japan, Germany, U.K., France, Italy, and Spain is at risk of default if a global economic downturn happens.
There are growing banking problems in the E.U., China, India, and, to some extent, in the U.S. too. High household debt could become a problem in Canada and the U.S. in the event of a downturn. There are rising delinquencies in auto and student loans in the U.S. Delinquency rates for student loans are currently over 10% and 4% for auto loans. While these numbers appear small in the bigger scheme of things, the risk is how defaults can snowball (contagion). This is regardless of whether it is sovereign, corporate, or household debt. We saw how it spread during the 1998 Russian/LTCM crisis and even more so during the 2008 financial crisis. Given current debt levels, the next financial crisis could be even worse.
The potential for a global debt blow-up brings us back to what is going on in the repo market. There are rumors that the Fed is preparing for a $500 billion injection at year-end. Year-end does bring a flurry of window-dressing from banks, hedge funds, and corporations. This results in an increased demand for funds, funds that are usually readily available in the repo market. Any huge injections are designed to prevent interest rates from rising, according to economist Martin Armstrong of Armstrong Economics. It is not for QE, as many have stated. QE purchased long-dated bonds, whereas the repo market is primarily overnight. Nonetheless, comments that this is nothing more than QE4 on steroids will no doubt persist. Admittedly it does have all the earmarks of QE.
There is a liquidity crisis somewhere; otherwise, banks would be providing the repo funds, but they are not. So why are banks not willing to lend? The only answer, according to Martin Armstrong, is banks are not trusting banks because there is a major problem somewhere, and they can’t put a finger on where it is. With the potential for a blow-up, in particular in the E.U. and the U.K. once Brexit is fully implemented at the end of January, our suspicion is the problem is in the EU banking system, possibly led by Deutsche Bank. But, as we noted, there are also growing banking problems in China and India as well, with the problems in the Chinese shadow banking system particularly perilous.
Global protests are growing. A small sample of protests includes Chile, Bolivia, Colombia, Venezuela, Argentina, Brazil, and Ecuador in Latin America. Mexico could also become a problem. In Asia and the Middle East, there have been deadly clashes in Iran, Iraq, Lebanon, India, and, of course, Hong Kong. Indonesia has also been gripped by protests. France is gripped with protests that are paralyzing the country and have cost the economy an estimated $6.5 billion. And, after the Conservative victory in the U.K., making Brexit almost a certainty by Jan. 31, 2020, there is the potential for an escalation in protests; as well, nationalist movements in Scotland and Northern Ireland could lead to the break-up of the U.K.
The protests are having an economic impact. Hong Kong has fallen into a recession. Mexico is sliding into a recession and recessionary conditions are prevalent in the other Latin American countries. Venezuela and Argentina are at risk of sovereign debt default. Growth has been at best tepid in the eurozone with Italy, Germany, France, and the U.K. at risk of sliding into a recession. In Asia, China’s growth has slid under 6% and India’s has fallen under 5%. On the surface that doesn’t sound bad, but in comparison with previous years, the slide is almost the same as falling into a recession. Japan’s economy remains moribund with tepid growth at best. Much of Africa is problematic and South Africa, the largest economy, has debt problems and is another country at risk of debt default. South Africa is falling into a recession.
The election of populist governments in a number of countries has almost universally led to a decline in democracy with attacks on institutions and rights. That ultimately has a negative impact on economic growth as well. Four of the world’s most populous democracies are currently ruled by populists. They include Narendra Modi in India, Donald Trump in the U.S., Joko Widodo in Indonesia, and Jair Bolsonaro in Brazil. It is not surprising that all four are either gripped by protests, controversy, and in the case of the U.S., the impeachment of Donald Trump. In the past, the election of populist governments usually led to a decline in democracy and attacks on rights. Nowhere was that more noticeable than in Venezuela. In many cases there was also economic decline. Besides the four noted above, populist governments are currently in power in Poland, Hungary, Greece, Israel, Italy, Philippines, Russia, Serbia, Sri Lanka, Turkey, Czech Republic, and Bulgaria. These are just the ones we’ve been able to identify. Arguably, because of Brexit, the U.K. could be added to the list. Many of them are facing economic problems sometimes (often?) brought on by the populists in power.
So, what will 2020 bring? The direction—given the state of world trade, the climate crisis, the massive debt problem, growing global protests, and the rise of populist governments—is not positive. Will the world fall into a recession in 2020? That is difficult to say, but again with a number of countries near or already in a recession the risk is high that it could spread (contagion). With the risk of recession in so many countries, it sparks further currency wars, something that has been going on now for several years. Competitive devaluations. All of this reminds us of the 1930s, and we know where that led. Finally, the bigger risk is for a debt default that sparks contagion as we saw in 1998 and 2008.
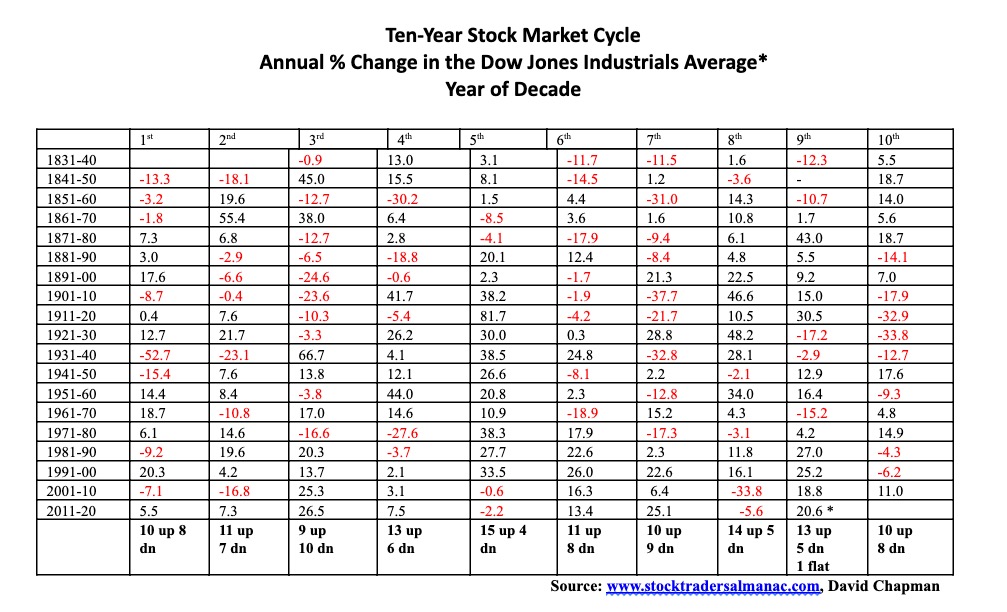
But none of this is to say it will happen in 2020. Our chart of the 10-year stock market cycle says that years ending in zero have been mixed. Since 1840 there have been 10 up years and eight down years. The year 2020 is also a presidential election year. There have been nine presidential election years ending in zero since 1840. Of the nine, five were up and four were down. The last one was the election of George W. Bush in 2000. The year 2000 saw the stock market lose 6.2%. We have stated that President Trump wants to see that the stock market is going up into the 2020 election to improve his election chances. But will it work given the negative issues lurking in the background? Overall, in election years, 31 were up and only 15 were down. Election years have resulted in the second-best returns during the four-year presidential election/stock market cycle. That is a better overall record than it is for years ending zero.
The longest-term cycles that analyst Ray Merriman of MMA Cycles has uncovered is one of 75 years. He has also noted its half-cycle (37.5 years) and the half-cycle of the 37.5 years (18.75 years). While understanding that a long term or even shorter-term cycle may come into play, its ranges often make it hard to pinpoint until in retrospect. The last 75-year cycle has been determined to be the Great Recession low of Mar. 9, 2009. That came roughly 77 years after the Great Depression low of July 1932. It was also 35 years after the 1970s recession low of December 1974 and came 21 years and five months after the 1987 stock market crash low. All fit within Merriman’s cycle ranges. Historically, the 75-years low had observed significant lows in 1932 (77 years), 1857 (75 years), 1783 (74 years), 1696 (87 years—that was a bit too long), 1618 (78 years), and 1555 (63 years—somewhat short).
Merriman writes that there has been an observed secondary bottom to the 75-year cycle that occurs six to 22 years afterwards. In this case, Merriman is referring to the 50% decline seen in 1938 following the 1932 low and/or the 40% decline into the 1942 low. Similarly, in going back to the other lows noted above, there were similar types of sharp corrections noted. However, we have wondered whether there is a 90-year cycle of stock market collapses and recessions or depressions. The 90 years from 1932 takes us to 2022. Going back from 1932, there were observable major lows and depressions in 1843 (89 years), 1761 (82 years), 1672 (89 years), and 1597 (75 years).
Merriman has placed the potential for a secondary collapse to happen anywhere from 2015 to 2031 but more likely between 2019 and 2024. Merriman notes that the 18.75-year cycle low could occur anywhere between 2024–2030, although he believes that overriding this could be the larger cycle and a significant low may come sooner rather than later. The 18.75-year cycle could also contract to 13 years, something that has happened before. We are now entering the 11th year of the current cycle, and we have no problem arguing that the up cycle could continue into 2020. But, given all the negative events occurring in the background, the odds are leaning towards something happening in 2020 that could be unexpected.
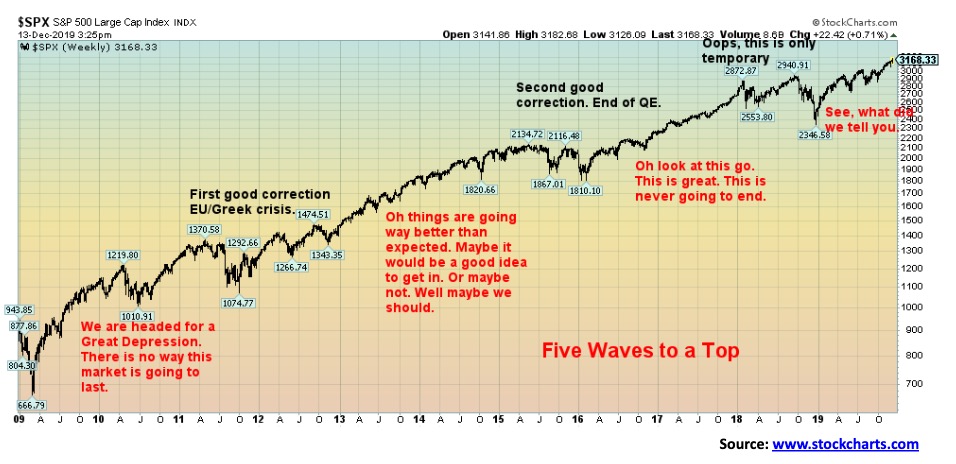
Our chart of the S&P 500 from the major 2009 low is shown along with the psychology of the market. The first wave out usually has a lot of doubt and few believe it. The first major correction that occurred in 2011 as a result of the EU/Greek debt crisis happened three years after the Lehman Brothers collapse in September/October 2008. That falls within the range of a fairly normal four-year cycle (range 36–56 months). The second wave brought many in, even though doubt lingered whether this was real or not. That led eventually to the next correction in 2015/2016 that came roughly five years after the 2011 low, again within the range of the four-year cycle. The final phase up was the Trump tax-cut rally and this is one that everybody jumps in on and figures it isn’t going to end. The trade war correction got underway in January 2018 and bottomed in December 2018. That was roughly three afters the 2015/2016 low. Again, within range of the four-year cycle. That places the next four-year cycle low to occur sometime between 2021 and 2023. The peak of the cycle could be occurring now or sometime in 2020.
The year 2020 could see a continuance of the bull market, but as well something might occur that triggers the final top sooner rather than later. The low does not necessarily occur in the same year as the top. The 1929 top didn’t bottom until 1932 and the 1973 top saw its low in 1974. The March 2009 low had its top in October 2007 and the October 2002 low had its top in January/March 2000. Our best assessment of a probable top is that it should occur within the first six months of 2020. The final low would not occur until 2022 at the earliest or as late as 2024. It seems 2020 promises to be an interesting year with the impeachment of a president and an election in the background. Add in the major issues and the year could become quite interesting.
—
(Featured image by Austin Distel via Unsplash)
DISCLAIMER: This article was written by a third party contributor and does not reflect the opinion of Born2Invest, its management, staff or its associates. Please review our disclaimer for more information.
This article may include forward-looking statements. These forward-looking statements generally are identified by the words “believe,” “project,” “estimate,” “become,” “plan,” “will,” and similar expressions. These forward-looking statements involve known and unknown risks as well as uncertainties, including those discussed in the following cautionary statements and elsewhere in this article and on this site. Although the Company may believe that its expectations are based on reasonable assumptions, the actual results that the Company may achieve may differ materially from any forward-looking statements, which reflect the opinions of the management of the Company only as of the date hereof. Additionally, please make sure to read these important disclosures.


The TopRanked.io Weekly Affiliate Marketing Digest [The Top VPN Affiliate Programs Roundup]
Want to be let in on a little secret about two massive affiliate opportunities you can take advantage of today?...


Sustainable Finance Faces Hurdles as Green Asset Ratio Reforms Fall Short of Full Transparency
The Green Asset Ratio (GAR) measures banks' alignment with the EU Taxonomy but remains low due to methodological flaws and...


XRP Hits New All-Time High Amid U.S. Crypto Policy Shift and Ripple’s Expansion
XRP surged past its 2018 all-time high, reaching $3.65 amid renewed political support for crypto in the U.S. under Trump....


Germany Moves to Curb Medical Cannabis Abuse, Sparking Access Concerns
Medical cannabis imports in Germany have surged, but health insurance-covered prescriptions remain low. Easy online access raises concerns about abuse...


JPMorgan’s Data Fees Shake Fintech: PayPal Takes a Hit
JPMorgan Chase will charge fintechs for customer data, threatening business models reliant on free access. PayPal’s stock plunged 5.7% after...
 |
|
 |  |
 |
|
-

 Impact Investing1 week ago
Vernazza Autogru Secures €5M Green Loan to Drive Sustainable Innovation in Heavy Transport
-

 Markets4 days ago
Rice Market Slips Amid USDA Revisions and Quality Concerns
-

 Business2 weeks ago
Legal Process for Dividing Real Estate Inheritance
-
 Fintech13 hours ago
JPMorgan’s Data Fees Shake Fintech: PayPal Takes a Hit