Featured
Fed Funds rate hikes; Bitcoin struggles and trades low
For the seventh time around, Fed Funds rate surged by another quarter point to 2 percent. Bitcoin is seeing resistance as trading continues volatility.

“A special place in hell” so said Peter Navarro, the U.S. senior trade advisor directed at Canada’s Prime Minister Justin Trudeau. His statement was directed at Trudeau for engaging in bad-faith diplomacy with U.S. President Donald Trump. He later apologized, but the damage was done.
Trudeau was also accused of “betrayal” and that the U.S. was “stabbed in the back” according to the U.S.’s chief economic advisor Larry Kudlow. President Donald Trump later followed all of that he’d punish “the people of Canada” because of PM’s Justin Trudeau’s news conference.
We can only hope that Mr. Trump’s punishment does not include invasion reducing us to ruble like Iraq and Libya and others. There was absolutely nothing friendly about the unprecedented attacks on Canada, the people of Canada and our Prime Minister from the President and his minions. They are also impossible to ignore and go beyond the tit-for-tat trade tariffs that now appear to be taking hold. We want to talk about economics but become embroiled in politics. The two are often intertwined as much as many would love to separate the two.
Nonetheless, it makes former President Richard Nixon calling former PM Pierre Elliott Trudeau an asshole seem rather quaint. Former President Lyndon Johnson was also alleged to have grabbed former PM Lester Pearson by the lapels and told him “don’t piss on my parade”.
It was a result of Canada’s decision to stay out of the Vietnam War and not join the U.S. Former President George W. Bush canceled a scheduled trip to Ottawa because of former PM Jean Chretien’s decision to not join the U.S. in their invasion of Iraq in 2003. Yes, we were with the U.S. during two world wars but a reminder that Canada was there first and the U.S. only joined later when their interests were threatened.
The trouble with the U.S.-Canada relation is economically, Canada is a mouse to the U.S.’s elephant. Still, Canada is no slouch and while Canada has a population that is just over 10% of the U.S., Canada’s GDP is only about 7.5% of the GDP of the U.S. Our government debt to GDP ratio is, however, lower than the U.S. with the U.S. having one of the highest government debt to GDP of any of the major industrialized countries surpassed only by Japan.
Because of the sheer size difference between the two countries the health of Canada’s economy is somewhat reliant on the U.S. U.S. relations with Canada can have a potentially large impact, but Canadian actions have little impact on the U.S. And that often raises tensions between the two countries. U.S. capital is important to Canada and that has resulted in high corporate ownership of important sectors of the Canadian economy by U.S. corporations. This has resulted, at times, with the U.S. trying to impose its laws on U.S. subsidiaries and by extension on Canada itself.
Canada/U.S. trade is estimated at over $600 billion. Canada’s exports to the U.S. represent 75% of all of Canada’s exports. About 49% of Ontario’s GDP is dependent upon exports to the U.S. U.S. exports to Canada while large are small in relation to their overall exports representing about 16%. Canada is, however, the number one destination for exports from at least 35 states.
Overall, Canada and the U.S. share a $1.5 trillion bilateral trade and investment relationship. Canada is the largest foreign supplier of oil and natural gas exports to the U.S. and represents nearly 40% of all U.S. foreign imports of oil. Canadians travel to the U.S. estimated at over 25 million trips and spending $28 billion.
On the other hand, Canada receives roughly 12 million Americans and they spend only about $8 billion. Canada enjoys a $17.5 billion trade surplus in goods with the U.S. in 2017, but combined with services, Canada has an $8.4 billion deficit. According to the U.S. Department of Commerce, exports of goods and services to Canada supports some 1.6 million jobs.
The Canada/U.S. relation goes beyond just exports and imports. We also have huge shared infrastructure in the St. Lawrence Seaway, ports in the Great Lakes, and, the Columbia River Treaty whereby we jointly built dams to supply electricity and allow flood control. We jointly have hookups in pipelines, highways, railways, electricity grids, and telecommunications networks. We are jointly in NATO, and NORAD covers North America.
Our interrelationship goes back pre-Confederation. Indeed, the U.S. tearing up was known as the 1854 Elgin-Marcy Treaty along with subsequent actions helped lead to Confederation in 1867. The treaty was in relation to free trade in agricultural products and natural resources particularly timber. Britain’s support for the Confederate States helped lead to the abrogation of the treaty.
The result of all triggered a steep recession in Canada. Following Confederation, the government of Prime Minister Alexander Mackenzie drafted a reciprocity treaty that was somewhat similar to the 1854 treaty, only it covered a lot more goods. Failure to implement the treaty led Canada to put high tariff walls to help encourage growth in Canada and east-west nation building.
That actually led to more direct investment in Canada from the U.S. and the start of the U.S. branch plant economy. Nonetheless, high tariffs dominated in both countries. This eventually led to the reciprocity treaty that got underway in 1893 and led eventually to a nasty election in 1911. And with considerable opposition to the reciprocity treaty by the Conservatives, the Liberals under Wilfred Laurier were defeated.
This was despite the fact that the U.S. had approved the treaty. Despite various efforts going forward, things got even worse and by the 1930s the U.S. was passing Smoot-Hawley that took tariffs to very high levels and was a major contributor to the Great Depression.
Following the election of Franklin Roosevelt, things did start to improve as there was a dawning that high tariffs were not working. By 1965, things had shifted to such an extent that the Auto-Pact was signed helping establish a single continental market for the industry.
With the election of the Brian Mulroney Conservatives in 1984, things shifted even further and these led to the Free Trade Agreement in 1988 and eventually NAFTA in 1994. Since then, there have been disputes, most notably the Softwood lumber agreement, but for the most part until now, free trade brought considerable benefits. Naturally, there were winners and losers and the losers eventually formed a considerable bloc that led to the election of Donald Trump and today’s disputes.
The biggest risk going forward is if the U.S. slaps tariffs on Canadian-made vehicles and auto parts. First, it would blow apart the tightly integrated North American business model built by the auto companies. Second, it would be a devastating blow to potentially thousands of jobs here in Canada, particularly Ontario. An auto tariff of 25% would just about blow-up the entire Canadian auto industry. It could cause auto prices to soar; 130,000 jobs directly employed in auto-assembly could be at risk; hundreds of dealerships could also be at risk. Two-way trade in autos is estimated at over $140 billion.
But from Trump’s viewpoint, it makes sense as auto production could shift back to the U.S. thus giving rise to thousands of new jobs in auto assembly plus ancillary services. It is probably no surprise that currently given Canada’s considerably smaller market that 85% of current vehicles made in Canada are destined for the U.S. It is estimated that tariffs on the auto industry could hike the price of a car by at least $6,200. Both Canadian and U.S. consumers would be hit with the bill, especially if Canada is forced to retaliate by placing a tariff on U.S. imports of autos primarily trucks.
Plants that could be impacted are situated in Alliston, Oshawa, Oakville, Woodstock, and, Cambridge. All, of course, are in Ontario. While the Canadian-based auto companies would be negatively impacted, it would also negatively impact parts manufacturers like Linamar (LNR-TSX) and Magna (MG-TSX).
As we have said before, in trade wars nobody wins. And in this case, especially if the auto industry were hit, Canada would be a major loser. We can only guess that is what he means when he says he will “punish the people of Canada”. But it goes beyond Canada. As a story in the NY Times postulates, ‘‘Just the Fear of Trade War is Straining the Global Economy”.
Given that Trump has decided to extend tariffs against China, the world has to be prepared for a major trade war. A reminder once again that the last time the world engaged in major trade wars, it helped plunge the world into an economic depression and ended in a war that killed 60 million people. One can only hope that history is not about to repeat.
Finally, there was another historic summit this past week. Unlike the unleashing of trade wars, this one allegedly was to bring peace to the Korean peninsula 65 years after hostilities ended in a cease-fire. This one was between a supposed brutal dictator and a supposed wannabe dictator. They spent their few days together gushing about each other except in the end their statement said very little.
Many believed that the supposed brutal dictator won the first round, although it is all hard to say. Nonetheless, the Kim Jong Un/Donald Trump summit was historic even if it accomplished very little and may in the end amount to nothing, unlike the trade wars that appear to soon be headed for even more clashes.
Yet another interest rate hike
As was widely expected the Fed Funds rate was hiked on June 13 by another quarter point to 2% with a range from 1.75%-2.00%. It is the seventh-rate hike since December 2015 and the second under current Fed Chair Jerome Powell. Seven times isn’t too many so far. From 2004 to 2006, the Fed hiked the Fed Funds rate 17 times before they finally had to lower it in September 2007. The recession lasted effectively from 2007 to 2009. The Fed is expected to hike the key Fed Funds rate two more times in 2018, bringing it to 2.25%-2.50% by year-end.
The current rate hike is against the backdrop of a 3.8% (U3) unemployment rate, GDP growth rate of 2.8% (latest Q1) and an inflation rate of 2.8% (core inflation rate – 2.2%). The Fed describes the current U.S. economy as being “not too hot, not too cold”. In other words, the “Goldilocks” economy. They expect GDP growth to continue between 2% and 3%, inflation to remain benign and unemployment to stay low. But are things really what they seem?
If one follows respected economist John Williams of Shadow Stats, he says the real situation is much worse. The unemployment rate is 21.4%, the inflation rate is 10.59% and the GDP growth is negative 1.34%. Of these statistics, the Fed or rather the Bureau of Labour Statistics (BLS) does release what is known as U6 unemployment a number that that is the U3 unemployment plus marginally attached workers, short-term discouraged workers, and those forced to work part-time because they cannot find full-time employment. The U6 unemployment rate is currently 7.6%.
The Shadow Stats unemployment takes the BLS’s U6 and adds in long-term displaced workers for more than one year and who were defined out of existence in 1994. Those workers show up in what is known as “Not in Labour Force”. That category holds 95,947,585 people. Not all are retirees (52,259,534), full-time students not working, people on long-term disability, and stay-at-home homemakers.
The same is done with inflation. The number Williams shows is calculated the way inflation was in 1990. Effectively, the methods used to calculate inflation reflect more what is needed to maintain a constant standard of living rather than actually measuring the cost of living. If prices go up, then a substitute is provided at a lower price. Housing prices are an excellent example of prices rising faster than the stated rate of inflation.
The Fed also uses the core inflation rate that does not contain food and energy as if people don’t eat or need energy to fuel their cars and their homes. The core inflation rate tends to be lower than the reported CPI. If the computing power of computers goes up, that is the same as a price cut. We could go on but that is basically the picture. The same was done with GDP that helps reflect a better GDP. For the inflation numbers reporting inflation substantially lower allows the government to keep a lid on pension payments indexed to inflation as an example.
As to the GDP numbers, well according to John Williams, the U.S. has been in a constant recession since 2000 except for three quarters in 2004. It is noteworthy that during this period that inequality grew as roughly 20% of the population did well while the remaining 80% saw their wages stagnate. Some of these factors played a role in the election of Donald Trump in 2016.
© David Chapman
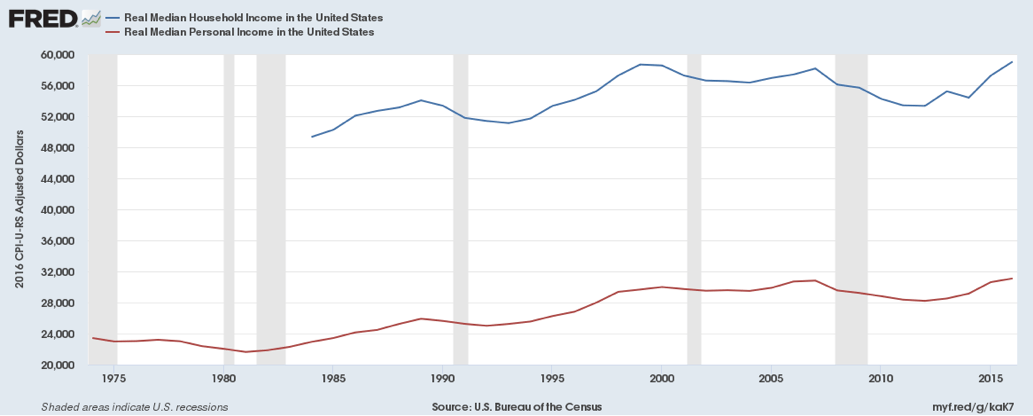
Above is a chart of real median household income and real median personal income. Real median household income peaked at $58,665 back in 1999. It only recently surpassed that level. The same with real median personal income that peaked in 2007 at $30,821. But that, in turn, was much above 2000 level of $29,998. Today, it is also just above the previous peak level. All of it reflects two decades of stagnating wages adjusted for inflation. And that is using the official inflation numbers, not the higher inflation levels reflected by Shadow Stats. If that was used, the median income would be even lower.
After keeping the official Fed Funds rate suppressed at or near zero for a period of seven years from December 2008 to December 2015, the Fed has now been hiking rates in an attempt to normalize interest rates. A quarter-point hike in interest rates adds about $500 million to the annual interest bill for the Federal government.
Nonetheless, the current rate is still below even the official rate of inflation and well below the inflation rate reported by Shadow Stats. That means despite the recent rise in interest rates savers still do not make a return after inflation and wages, for the most part, is not keeping up or barely keeping up with the rate of inflation. And if one used the Shadow Stats rate of inflation both are way behind.
No wonder growth, according to Shadow Stats, remains negative, and for many, it feels like a permanent recession. It is not “feels”—it is. And we haven’t even hit the point of a turn down in the economy that inevitably will happen given we are now nine years from the end of the last official recession.
Bitcoin watch!
Bitcoin finally cracked $6,800 and trade as low as $6,133 before stabilizing and bouncing back. The $6,800 price should now act as resistance. Below is support at $6,000 and support from the February 2018 low, but a firm break under that level could take Bitcoin to the next good area of support near $5,000. The bulls, however, will want to view $6,000 as a key support zone to launch the next up move.
The decline is having an immediate effect. Last week there were 22 cryptos with a market cap over $1 billion. This week there only 18. Four fell off. The market cap of all cryptos listed at Coin Market Cap has fallen to $280.5 billion from $321 billion the previous week. A $40 billion drop is serious money even if some of its only paper money. Five cryptos have also disappeared as there are now 1,629 listed at Coin Market Cap vs. 1,634 the previous week.
The drop for Bitcoin has taken many indicators into oversold territory on the daily charts. The weekly charts do, however, have room to move lower. Monthly charts are now mostly neutral and have considerable room to move lower.
Oversold conditions such as an RSI under 30 can remain with us for some time. We have seen RSIs go under 30 then go even lower under 20. So, it shouldn’t be taken as a sign that a low is in. But it might be a sign that market could consolidate to work off some of the oversold conditions. Only a move back above $6,800 might indicate a low is in. A move over $7,200 would be a confirmation that a low is in.
We have been consistent in our bearishness toward cryptos. There are too many of them, there is still a lack of clear regulation, regulators continue to circle, there have been far too many scams and outright frauds and there have been exchanges that have failed. Our suspicion is that prices won’t stabilize until there is some order to the market and regulations in place to protect the consumer just as there are regulatory bodies for investment dealers, mutual fund dealers and more. Cryptos are still only used by a small segment of society and uses for cryptos remain few.
Our near-term expectations are that Bitcoin will consolidate between $6,200 and $6,800 before moving lower once again. Potential longer-term targets remain down to $3,700 to $4,000.
Markets and trends
|
|
% Gains (Losses) Trends
|
|||||||
| Close
Dec 31/17 |
Close
Jun 15/18 |
Week | YTD | Daily (Short Term) | Weekly (Intermediate) | Monthly (Long Term) | ||
| Stock Market Indices | ||||||||
| S&P 500 | 2,673.63 | 2,779.42 | 0.1% | 4.0% | up | up | up (topping) | |
| Dow Jones Industrials | 24,719.22 | 25,090.48 | (0.9)% | 1.5%
|
up | up | up (topping) | |
| Dow Jones Transports | 10,612.29 | 11,073.99 | 1.2% | 4.4% | up | up | up (topping) | |
| NASDAQ | 6,903.39 | 7,746.38 (new highs) | 1.3% | 12.2% | up | up | up (topping) | |
| S&P/TSX Composite | 16,209.13 | 16,314.42 | 0.7% | 0.7% | up | up | up | |
| S&P/TSX Venture (CDNX) | 850.72 | 754.40 | (2.7)% | (11.3)% | down | down | up (weak) | |
| Russell 2000 | 1,535.51 | 1,683.91 (new highs) | 0.7% | 9.7% | up | up | up (topping) | |
| MSCI World Index | 2,046.47 | 1,992.68 | (0.6)% | (2.6)% | down | down (weak) | up | |
| NYSE Bitcoin Index | 14,492.18 | 6,545.40 | (13.9)% | (54.8)% | down | down | neutral | |
| Gold Mining Stock Indices | ||||||||
| Gold Bugs Index (HUI) | 192.31 | 177.88 | (0.5)% | (7.5)% | down | down | neutral | |
| TSX Gold Index (TGD) | 195.71 | 191.62 | 1.4% | (2.1)% | up | neutral | neutral | |
| Fixed Income Yields/Spreads | ||||||||
| U.S. 10-Year Treasury yield | 2.40 | 2.93
|
flat | 22.1% | ||||
| Cdn. 10-Year Bond yield | 2.04 | 2.22 | (4.3)% | 8.8% | ||||
| Recession Watch Spreads | ||||||||
| U.S. 2-year 10-year Treasury spread | 0.51 | 0.38 | (11.6)% | (25.5)% | ||||
| Cdn 2-year 10-year CGB spread | 0.36 | 0.29 | (29.3)% | (19.4)% | ||||
| Currencies | ||||||||
| US$ Index | 91.99 | 94.79 | 1.3% | 3.0% | up | up | down | |
| Canadian $ | 0.7990 | 0.7600 | (1.7)% | (4.9)% | down | down | neutral | |
| Euro | 120.03 | 116.10 | (1.3)% | (3.3)% | down | down | up | |
| British Pound | 135.04 | 132.81 | (0.9)% | (1.7)% | down | down | down (weak) | |
| Japanese Yen | 88.76 | 90.40 | (1.0)% | 1.9% | down | neutral | up (weak) | |
| Precious Metals | ||||||||
| Gold | 1,309.30 | 1,278.50 | (1.9)% | (2.4)% | down | down | up | |
| Silver | 17.15 | 16.48 | (1.6)% | (3.9)% | up | neutral | neutral | |
| Platinum | 938.30 | 887.80 | (2.0)% | (5.4)%
|
down | down | down | |
| Base Metals | ||||||||
| Palladium | 1,061.00 | 981.80 | (2.4) | (7.5)% | up (weak) | neutral | up | |
| Copper | 3.30 | 3.14 | (4.9)% | (4.9)% | up | up | up | |
| Energy | ||||||||
| WTI Oil | 60.42 | 65.06 | (1.0)% | 7.7% | down | up | up | |
| Natural Gas | 2.95 | 3.02 | 4.5% | 2.4% | up | up | up | |
New highs/lows refer to new 52-week highs/lows. © David Chapman
© David Chapman
With all the excitement during the week centered on Trump’s behavior at the G7, the Kim-Trump summit and the Fed rate hike the stock markets were not garnering a lot of attention. The S&P 500 ended the week effectively unchanged. The Dow Jones Industrials (DJI) did not fare well at all, falling 0.9%. But the Dow Jones Transportations (DJT) was up 1.2% and the NASDAQ jumped 1.3%. Small-cap indices represented by the Russell 2000 also saw gains up 0.7%.
It was an odd week. Markets are diverging. The NASDAQ made new all-time highs. So, did the Russell 2000, the S&P 600. Small cap stock indices making new all-time highs, large-cap stock indices such as the S&P 500 and the DJI not making new all-time highs. Others did not either, including the S&P 100 (OEX), the NYSE Composite and surprisingly the Wilshire 5000, the broadest index possible. Overseas, the MSCI World Index was down 0.6%, the Chinese Shanghai Index (SSEC) fell 1.5%, the Paris CAC 40 was up 1.0%, the German DAX also gained 1.9% and the Tokyo Nikkei Dow (TKN) gained 0.7%. The London FTSE 100 dropped 0.8%. None are anywhere near all-time highs.
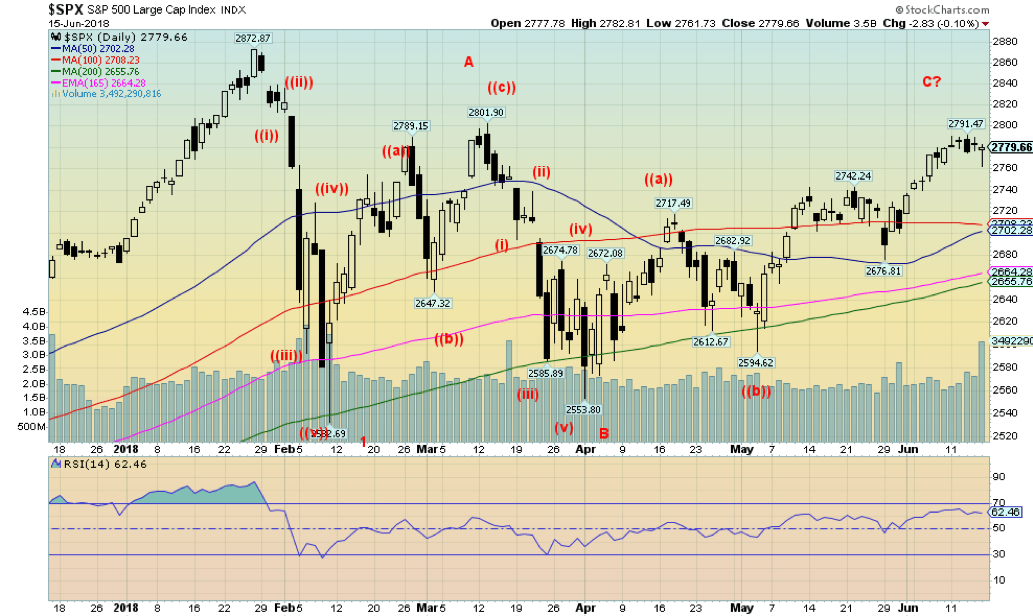
It is still difficult to say what type of pattern is forming here. We continue to think we’ll see an ABCDE type pattern. So far, we can see an ABC pattern as we appear to be working on the C wave. That is presuming that wave 1 was the decline following the January high. That wave bottomed in February. One reason we believe we will see an ABCDE type pattern is that the B wave appears to have fallen in five waves. Usually, it is the C wave that rises (or falls) in five waves, not the middle wave. So that still puts our final potentially out until later this summer or even into the fall. Nonetheless, the rally since February still appears as a bear market rally following that first break.
The S&P 500 appears to be rolling over and could fall swiftly back to 2,700. Only new highs above 2,791 and especially above 2,802 the March 2018 high could change this scenario. Above 2,802, new highs above the January high of 2,872 is possible. Friday’s low was at 2,761 so another break of that level should send the index lower.
© David Chapman
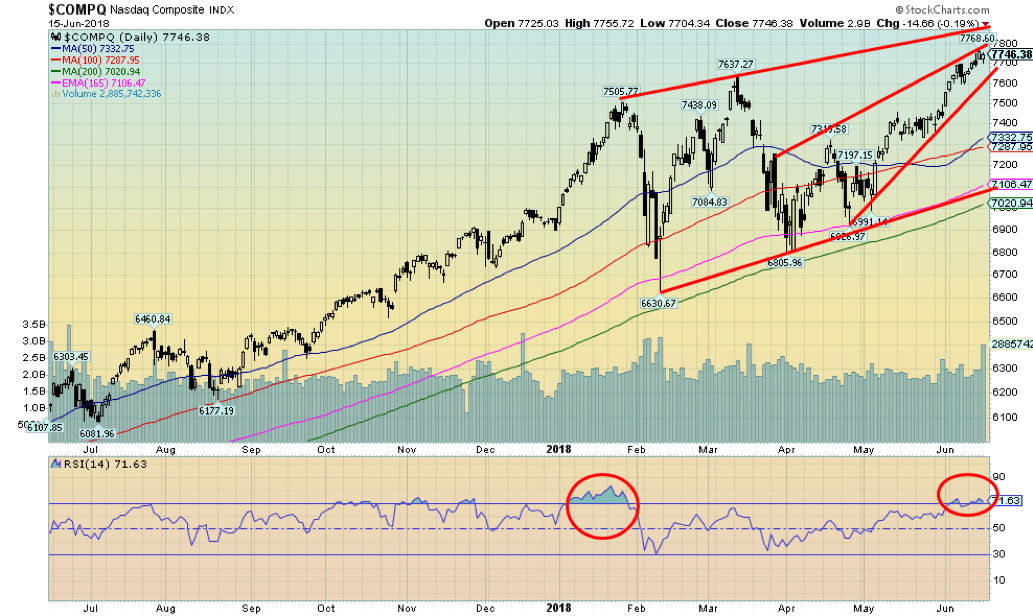
Thanks to the FAANGs (Facebook, Apple, Amazon, Netflix, Google), the NASDAQ is making new all-time highs. The other indices as we note below are not and that is a significant divergence. It is lonely at the top and the rise to new highs is narrow given the dependence on just five stocks when there are dozens, hundreds to choose from. This is not a healthy market in our opinion. The RSI on the dailies is now over 70 an area that often sees tops. A breakdown under 7,700 could suggest that a top is in. As well, we appear to be forming a bearish ascending wedge triangle. A breakdown could take the NASDAQ back to the 200-day MA near 7,000.
© David Chapman
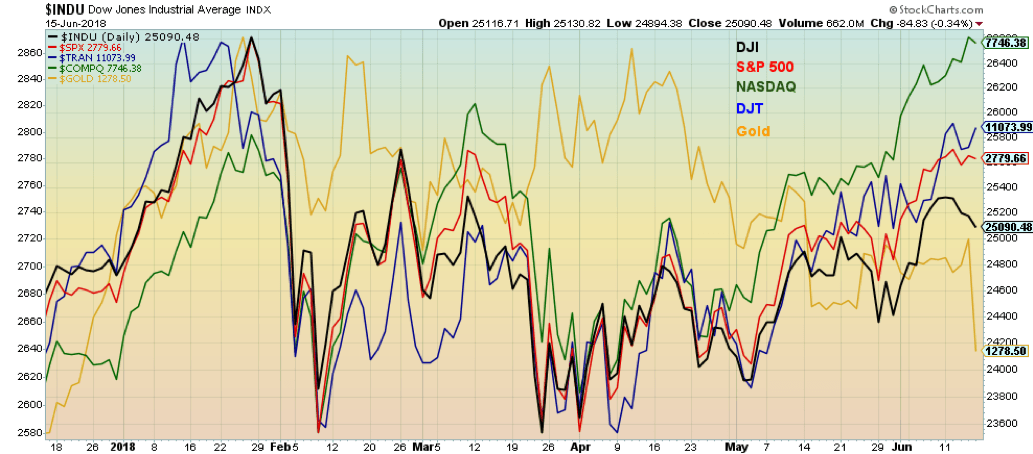
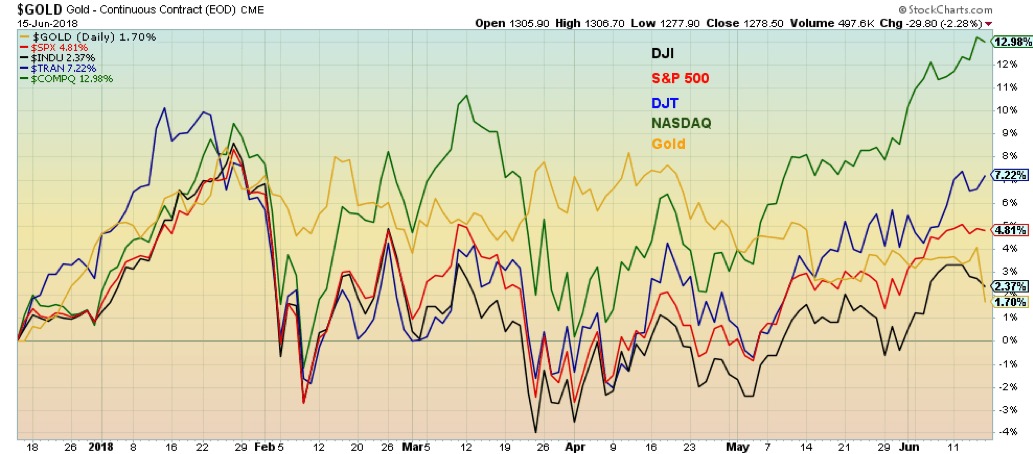
This is how the indices (and gold) look over the past six months. Note how the NASDAQ has made new all-time highs but the other major indices including the DJI, the DJT and the S&P 500 remain short of their all-time highs set back in January. The weakest performer has been the DJI and even the DJT is starting to diverge with the DJI. At significant tops and bottoms, we often see major divergences between the indices. As Dow Theory states the indices must confirm each other. They are not. That could change going forward but time is running out.
© David Chapman
Here are the same indices (and gold) only by performance over the past six months. Leading the way is the NASDAQ up 13%. Next up is the DJT up 7.2%, the S&P 500 has gained 4.8% while the DJI lags up only 2.4%. Gold, especially after this week trails the pack up 1.7%.
© David Chapman
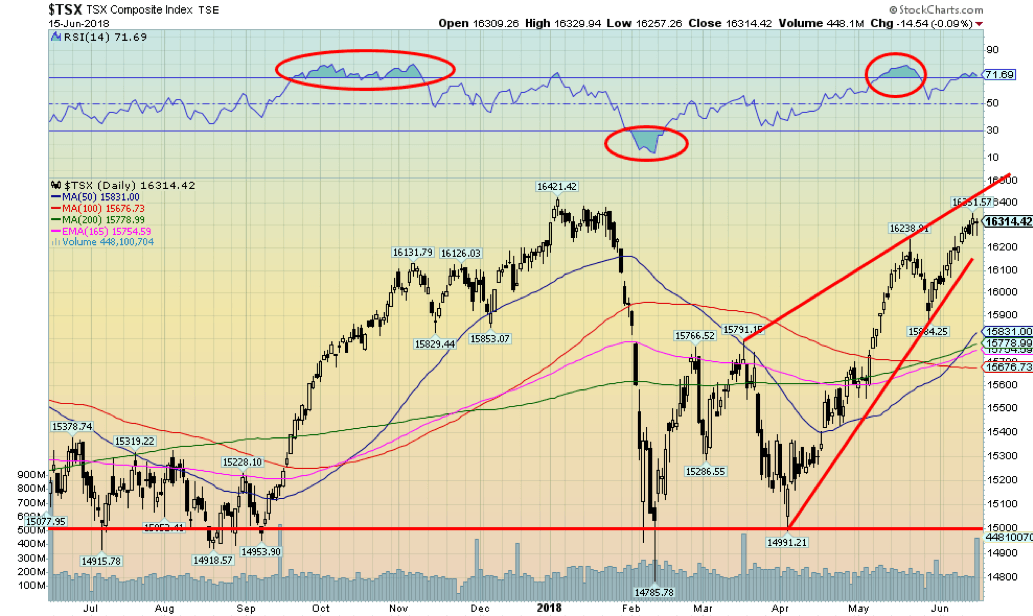
The TSX Composite continues its upward march hitting a new high at 16,351 but still short of the all-time high at 16,421 set in January. We could make the argument that the TSX is forming an ascending wedge triangle. Ascending wedges are bearish. The breakdown is around 16,200 and the wedge triangle suggests a return to the bottom near 15,000. The TSX floundered this week with the TSX Energy Index down on the week thanks to a sharp drop in WTI oil prices. The top of the wedge appears to be up around 16,400 so it is possible that the TSX does eke out a new all-time high.
© David Chapman
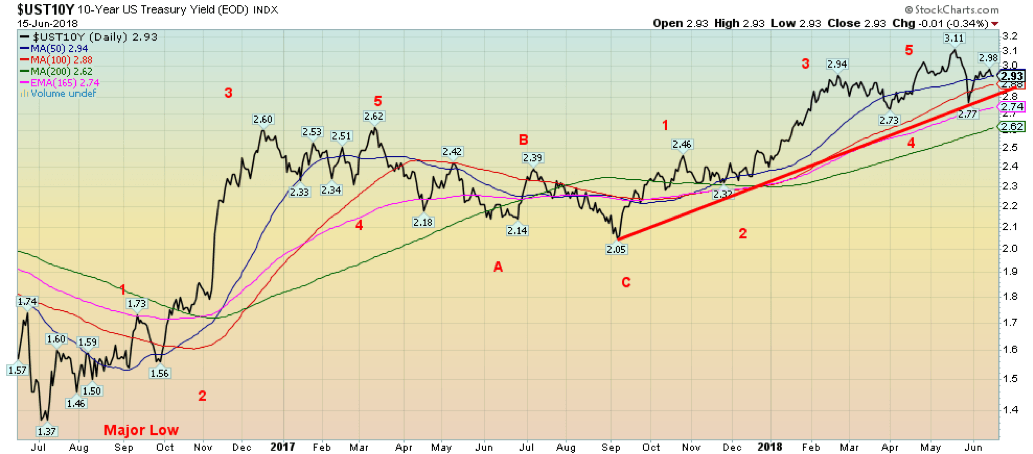
Despite the Fed hiking the Fed rate this past week, the impact on the 10-year U.S. Treasury note was negligible. The 10-year was unchanged on the week at 2.93%. Once again it is possible that the 10-year has topped (yield – prices bottom as prices move inversely to yields). Our target had long been about 3.20% The high so far is 3.11%. A strong US$ has helped keep a lid on the 10-year of late. There is considerable support below down to 2.88% and then down to 2.60%. Only below 2.60% could rates fall faster. A move back above 3% might suggest that an attempt will be made on the high at 3.11%.
Recession watch spread
© David Chapman
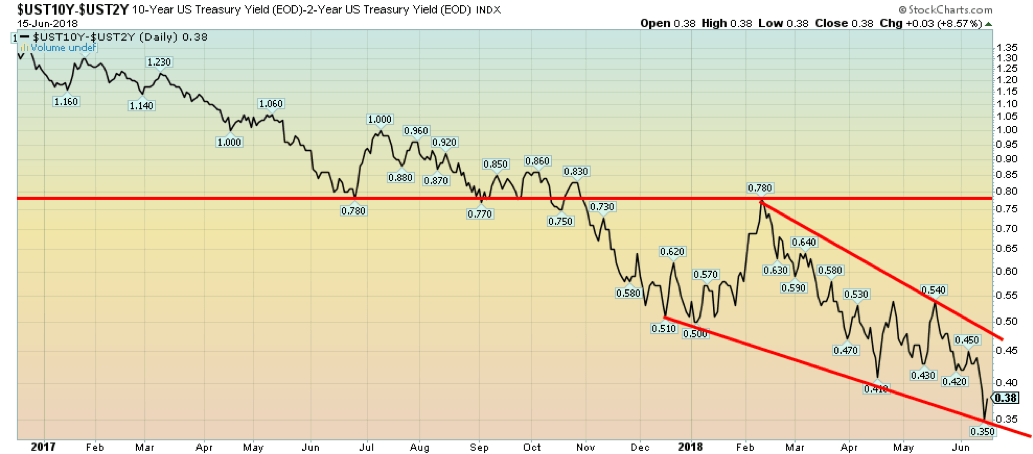
Given the Fed rate hike this past week it is no surprise that the 2-10 spread narrowed this past week from 0.43% to 0.38%. At one point the spread fell to 0.35%. The downward direction is firmly in place. If past history is any guide the rate could be negative in about eight months. We emphasize, however, that reaching negative spreads is not a given. The time to get there could longer or shorter than eight months. However, negative interest rate spreads are a characteristic that has been seen time and time again prior to recessions. The average time for negative spreads is about six months. By those calculations, a recession could be hitting sometime in the latter part of 2019. It is no surprise that once a downward spiral gets underway with the spread that it falls quite rapidly.
© David Chapman
With the Fed rate hike this past week the US$ soared leaping 180 points on Thursday from the low to the high. It was not just the Fed rate hike that helped the US$. It was dovish statements out of the ECB as Mario Draghi pledged to keep rates unchanged through to the summer of 2019 and not start bond phase-outs until year end. It was diverging central banks that helped the US$ soar and the Euro plummet.
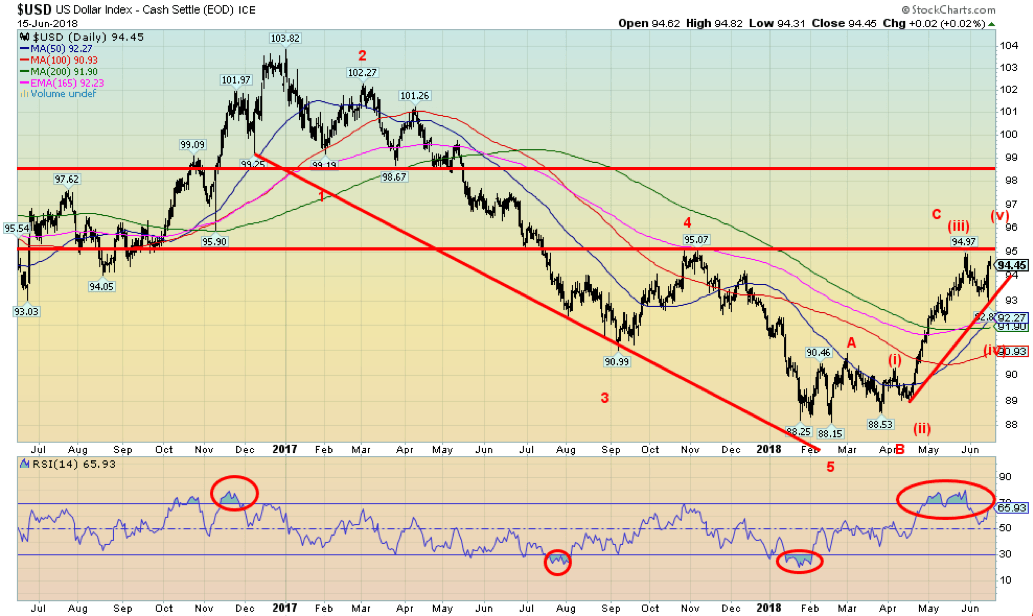
It doesn’t help that the Euro makes up 57.6% of the US$ Index. The Euro is now plunging towards 115 and many think it could fall to 110. Other currencies were hit as well as the British Pound fell 0.9%, the Japanese Yen was off just over 1% and the Cdn$ was down 1.7%. The Euro fell 1.3%. The US$ Index is now challenging the earlier high seen at 94.97. We had long thought a run to 95 was possible and the US$ Index could rise to 95.50. A firm move through 95 could even suggest a run towards 98 but we doubt it. The trade wars might play a role in taking the US$ down but right now the focus is on the diverging central banks. One a hawk and the other a dove.
© David Chapman
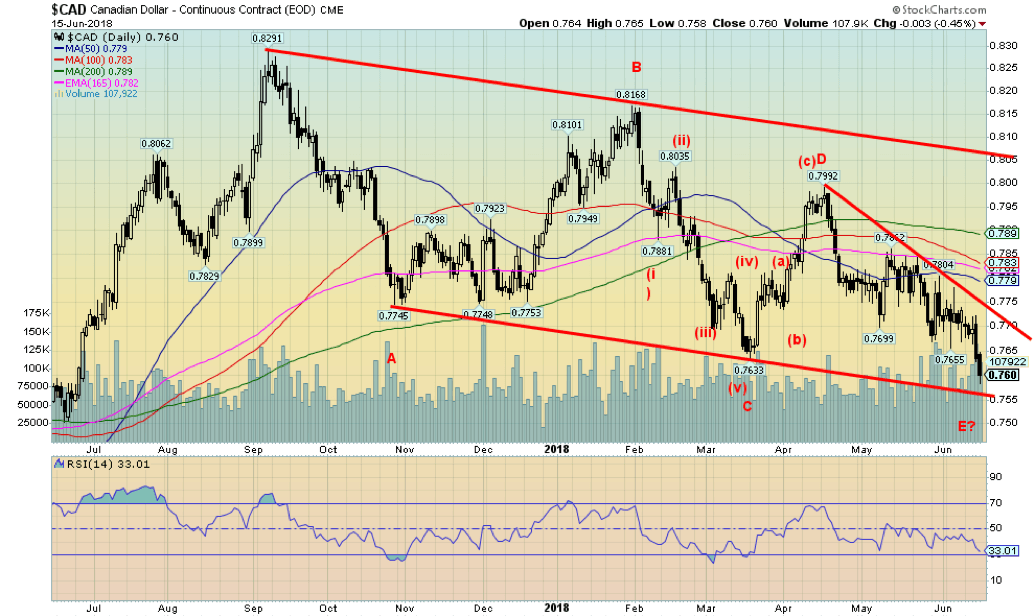
Trade wars are not friendly to Canada. The Cdn$ plunged this week against the US$ fall to a new low at 76. The 52-week low is currently at 75.04 so it won’t take much more of a decline to set new 52-week lows. The only hope is that there appears to be trendline support nearby at 75.50. So, it is possible that will hold. But a break of 75.50 should set the course for new lows. Still since peaking at 82.91 way back September 2017 the Cdn$ has been in a decline and could be tracing out an ABCDE type corrective decline. By our count, this is the E wave. Arguably we could say that potential targets are down to 72.75. But oddly the minimum target is 75.50.
© David Chapman
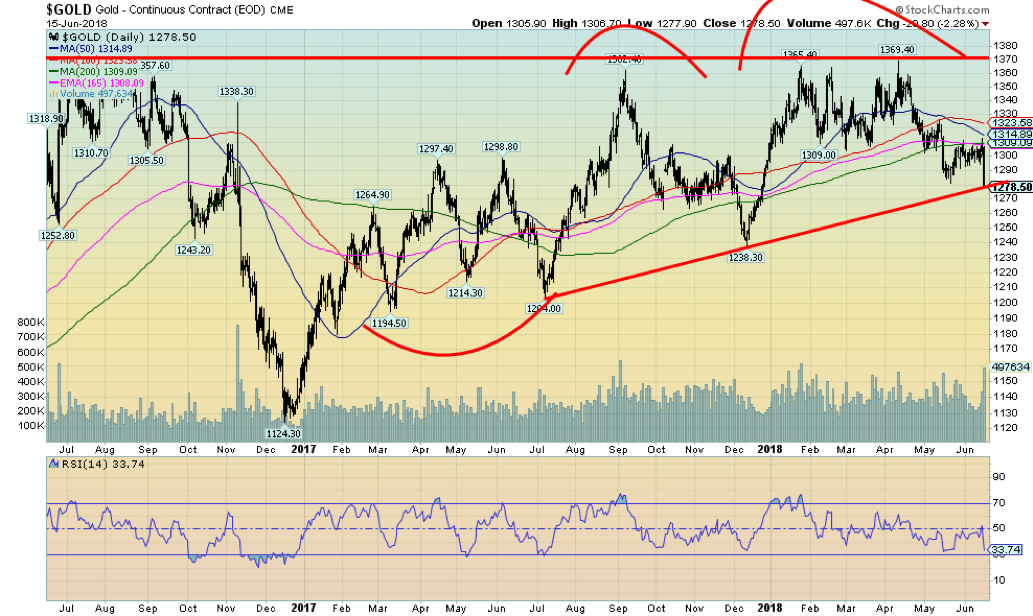
Gold prices were “whacked” on Friday falling a sharp $30 or 2.3%. Overall the week was better as gold was off 1.9%. Gold once again hit into a level of resistance up to $1,310 before turning tail sharply on Friday. The previous day now feels like a set-up as gold rallied despite a sharp 100 bp jump in the US$ Index. Often as well following a Fed rate hike gold had rallied. We saw that in December 2017 following the rate hike and gold also followed a rise upward following the March rate hike before topping in April.
Gold broke its previous low of $1,281 but we are reminded that silver has not broken its previous low of $16.07. So far this is a divergence that shouldn’t be ignored. The two often diverge at major tops and bottoms. Gold sentiment remains low and we note the daily RSI is now in the low 30’s. A move below 30 would signal oversold conditions, which can, of course, remain in place for some time. Gold is holding its uptrend from July 2017 but now barely. Further declines this coming week puts December 2017 low and the July 2017 low in jeopardy. Gold has some support at $1,270 but below that next good support is at $1,240.
A decline that far cannot be ruled out. While seasonals are poised to turn positive the good seasonals really don’t kick in until July. In the interim, there is nothing here to suggest that we first couldn’t go lower. Bigger picture the patterns remain positive and a solid breakout over $1,370 and especially over $1,400 could spark a rally to $1,500 and higher. Right now, it doesn’t look so good.
© David Chapman
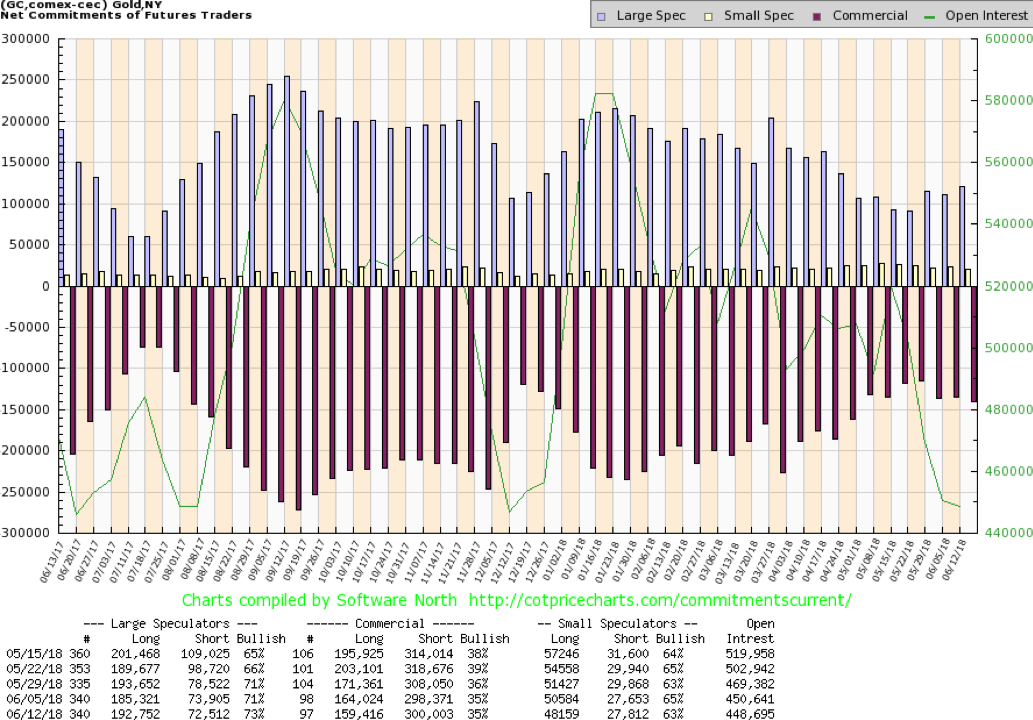
The gold commercial COT was unchanged this past week at 35%. This was in sharp contrast to the silver commercial COT that fell sharply this past week. There was little change in the makeup as long open interest did fall just under 5,000 contracts while short open interest rose just under 2,000 contracts. Naturally, following Friday’s debacle, we are now curious to see next week’s COT. This one cuts off on Tuesday. The large speculators’ COT (hedge funds, managed futures etc.) rose marginally to 73% from 71%. The result there is little clue here as to what the next move should be. The COT is not overly bearish nor is it overly bullish making Friday’s collapse a head-scratcher.
© David Chapman
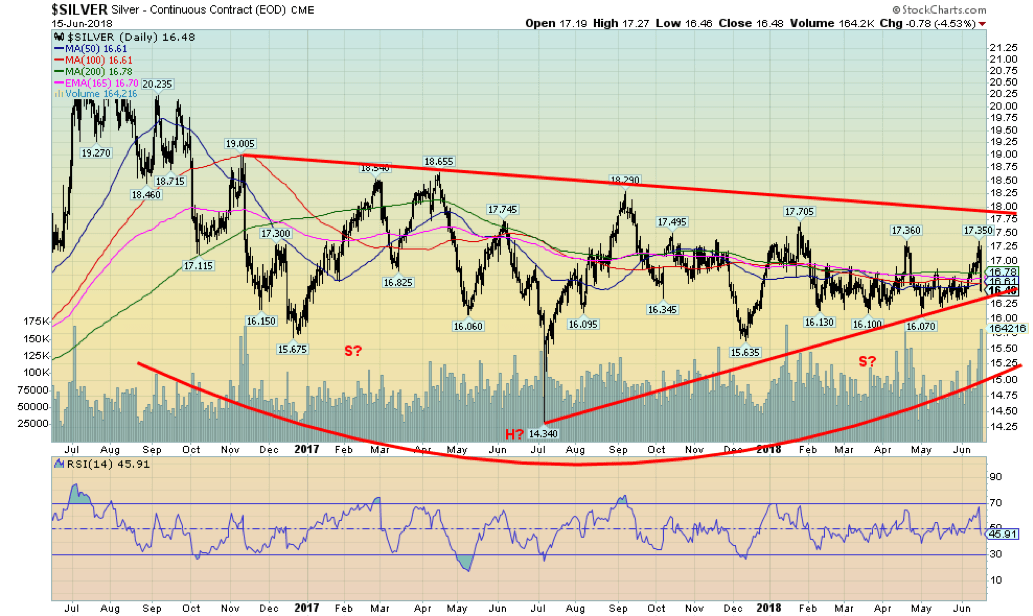
Silver was dumped on Friday taking a nasty hit of 4.5% falling some 78 points. The week wasn’t as bad as silver only lost 1.6%. Silver did trade up into a potential resistance zone between $17.25 and $17.50 but Friday’s hit was a nasty surprise as there was little to suggest that this was about to befall silver prices. Silver is now looking the previous two times it spiked since the begging of the year. The first was in January/February 2018 when silver fell swiftly from $17.70 to $16.13.
The second spike came in April when silver jumped to $17.36 then swiftly fell to $16.07 by the end of the month. Now this one. Given perceived silver shortages the drop-in price makes little sense raising the attacks suggesting price manipulation. Still, as technical analysts, we focus on support/resistance, price momentum, and trend. Support at $17 cracked and support is now just below at $16.30.
A break of that level could lead to new lows below $16. It remains noteworthy that silver prices have not taken out their earlier lows but gold did—a divergence. If this relationship holds then this current drop could be temporary. Silver needs to regain back above $17 to suggest higher prices. Sentiment remains low but low sentiment can remain in place for some time just as overbought and oversold conditions can prevail as well. Odds are that we could well see lower prices and a break of $16.30. Failure to break $16.30 would be positive.
© David Chapman
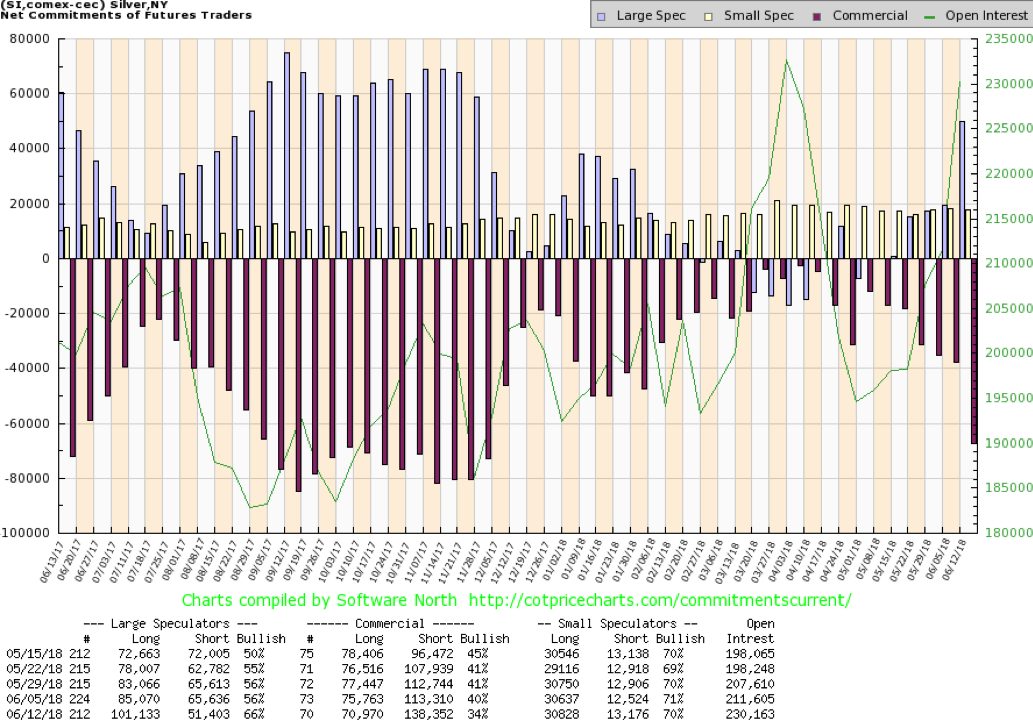
Is the silver rally over? The commercial COT this past week surprised to the downside when it was reported it fell to 34% from 40%. Long open interest fell about 5,000 contracts but short open interest soared by roughly 25,000 contracts. The commercial COT is now practically down at levels seen from September to December 2017 a period when silver prices were falling from over $18 to under $16. Friday’s fall was a nasty 78 points or 4.5% leaving silver down 1.6% on the week following an earlier rally.
Naturally, the large speculators’ COT jumped from 56% to 66% as they loaded up increasing their long open position by roughly 16,000 contracts while shedding roughly 14,000 contracts from short open interest. Maybe all this signaling is that the large speculators loaded up too fast and the commercials spotted it and unloaded on them.
© David Chapman
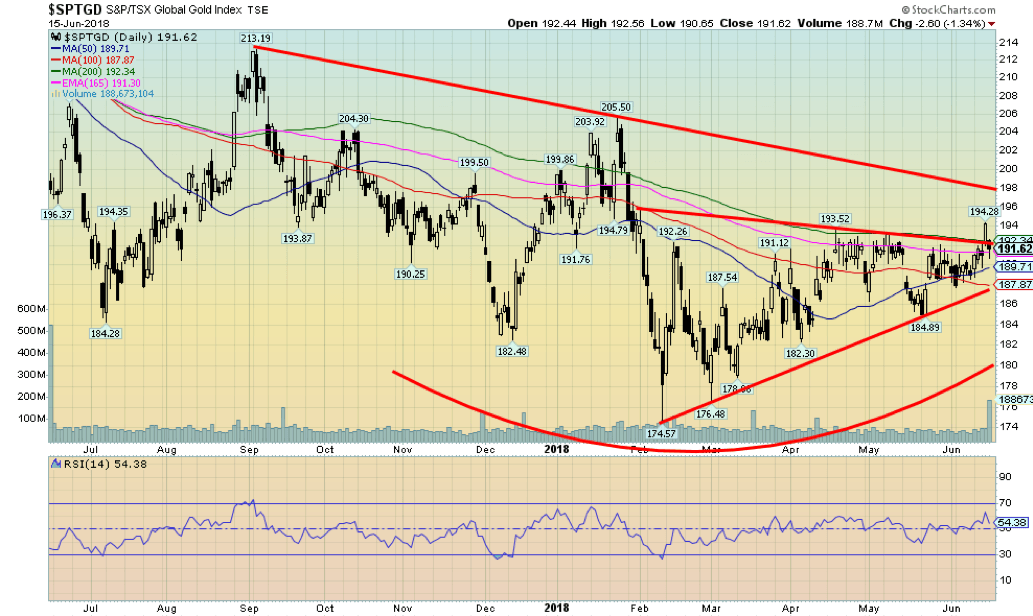
Just as the TSX Gold Index (TGD) appeared to be finally breaking out over 193 Friday’s debacle came along whacked the gold index right back down again below 193. So, is the breakout legitimate? It is difficult to say now because of the failure to follow through and hold above that level. There is good support down to 188 but a break under that level could send the TGD down to test 185 and lower. The TGD at least gained on the week bucking the trend from Friday’s debacle in the precious metals.
The TGD was up 1.4% on the week. Far better than its U.S. cousin the Gold Bugs Index (HUI) that fell 0.5%. Still, the gold stocks fared better than the metals so we view that has continued the positive divergence we are seeing between the gold stocks and the metals themselves. We continue to believe that this will eventually lead to a strong rally for the precious metals and the gold stocks as represented by the TGD and the HUI. The huge triangle pattern forming still suggests a potential breakout above 198 that could lead to targets up to 230 and possibly up to 265.
© David Chapman
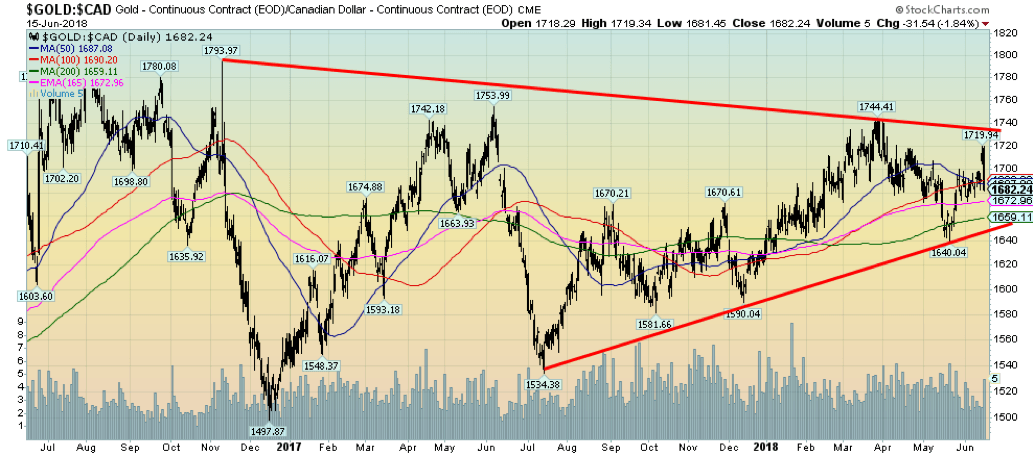
While gold prices have fallen to new lows for the current move down this past week, gold in Cdn$ has not. Gold in Cdn$ was down under 0.2% this past week ending what had been a four-week rebound. Even at that gold in Cdn$, currently at $1,682 is only down 12.4% from its 2011 top vs. gold in US$ is down 33%. The Cdn$ has fallen 28% against the US$ since topping in 2011. It demonstrates the power of gold to protect against currency collapse.
Gold in Cdn$ appears to have good support down to $1,660. A solid uptrend appears to be in place but acknowledged that a breakdown under $1,650 could jeopardize that rally. Gold in Cdn$ breaks out around $1,740 and from there could project up to over $2,000. Below $1,650 gold has further support down to $1,580/$1,600.
© David Chapman
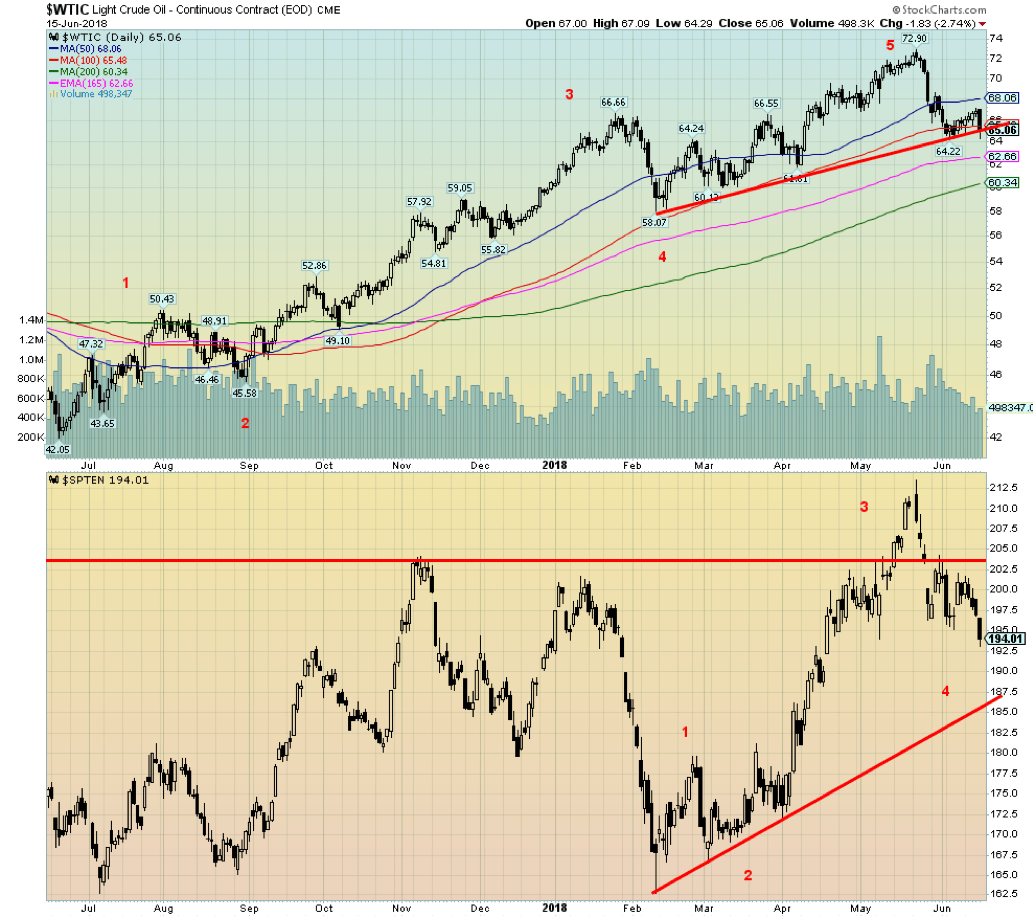
Can Trump tweeting about oil take down oil prices? It is possible as the correlation is too much to ignore. In the early part of the week President Trump in between his “trash talking” at the G7 and his “effusive praise” for North Korean dictator Kim Jong Un at their historical summit he tweeted that “oil prices are too high. OPEC is at it again. Not good!”
Oil prices have jumped roughly 40% in the past year leaping recently over $70. But since then they are down 10% including a 2.7% drop on Friday. Gasoline prices in the U.S. had soared to $2.90/gallon (roughly $5.22/gallon here in Toronto) and complaints were rising. While drivers may be welcoming the recent drop it may be short-lived.
Why? A number of factors. OPEC led by Saudi Arabia and along with Russia had been capping production in order to try and get prices higher. The two are highly dependent on high oil prices to fuel their economy. They have discussed ending it. Second sanctions against Venezuela are biting and Venezuela’s oil production has been sliced from 2.2 million BPD to 1.6 million BPD.
Third sanctions against Iran could slice oil production even further. The last time the U.S. applied sanctions against Iran, Iranian oil production fell 1.2 million BPD. Finally, oil producers have shown little desire to pump up oil production because of higher prices. A fall in prices might discourage them further.
Interestingly Trump had tweeted about high oil prices before earlier in the year and WTI oil fell from almost $67 to $58 before rising again. Trump also tweeted in April and it set oil back from almost $67 to under $62. Trump also believes that prices could be forced down to $25 if the U.S. were allowed to drill more especially in environmentally sensitive areas.
Finally, Trump also said that the U.S. should seize Iraqi oil ignoring of course that the U.S. has been there since 2003 and the country is still not stable. No word on how many troops it would take to occupy the country. Trump’s tweets also helped push down the TSX Energy Index (TEN). It fell 2.7% this past week and it is putting the recent rally in doubt. The TEN is down 9.1% from its recent top.
Nonetheless, Trump tweeting about oil appears now to be a signal to sell oil. Market manipulation?
Chart of the week
© David Chapman
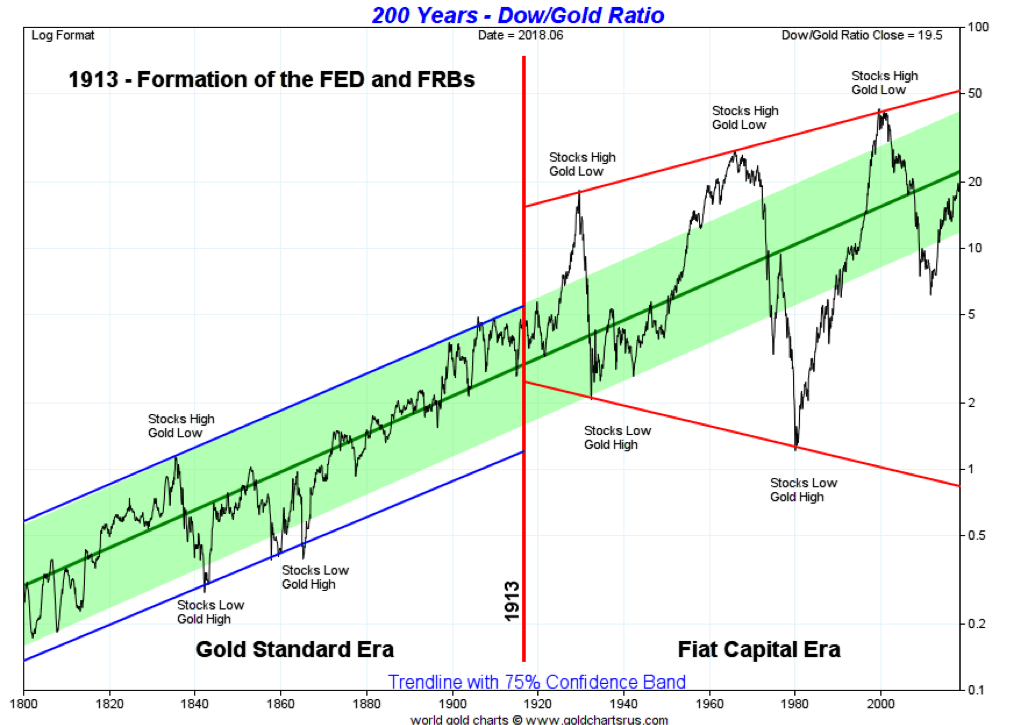
Here is a historical long-term view of the Dow/Gold ratio dating all the way back to 1800. When the chart is rising the DJI is outperforming gold and when the chart is falling gold is outperforming the DJI. Given gold’s historical fixed price throughout the 19th century and in the 20th century up until 1970, it is probably not surprising that the DJI (or its proxy) was rising for most of the 19th century. Two periods standout in those years. The first was the depression of 1840’s (1837-1844) stemming from what was known as the Panic of 1837. The second one came through the U.S. civil war and the early part of the period known as the “Long Depression”. The depression started in 1873 and lasted into the 1890’s with a huge railway boom in between.
The next period of a low Dow/Gold ratio came in the period of the “Great Depression” of the 1930’s. Note that following the formation of the Federal Reserve the ratio became far more volatile with considerable swings between the DJI and gold. The 1950’s and 1960’s were a boom for the DJI but that ended with the stock market top of 1966 and the end of the gold standard and the end of Bretton Woods in August 1970. The 1970’s could be termed the “Long Recession” as the DJI stagnated and gold soared from $35 to $878 in January 1980.
What followed was another long period of the DJI favored over gold from the early 1980’s to the peak in 2000. Many have compared the current rally for the Dow/Gold ratio to the rally of the ratio from 1974-1976 when stocks rebounded out of the 1973-1974 recession and gold fell from almost $200 to $100.
The current rebound got under with gold’s top over $1,900 in 2011 and is now in its seventh year. Gold bugs continue to hope that the next move will be in favor of gold. Our next chart of the Dow/Gold ratio indicates that it just might be possible. If the ratio follows the broadening pattern, the next move could take the Dow/Gold ratio under 1:1.
© David Chapman
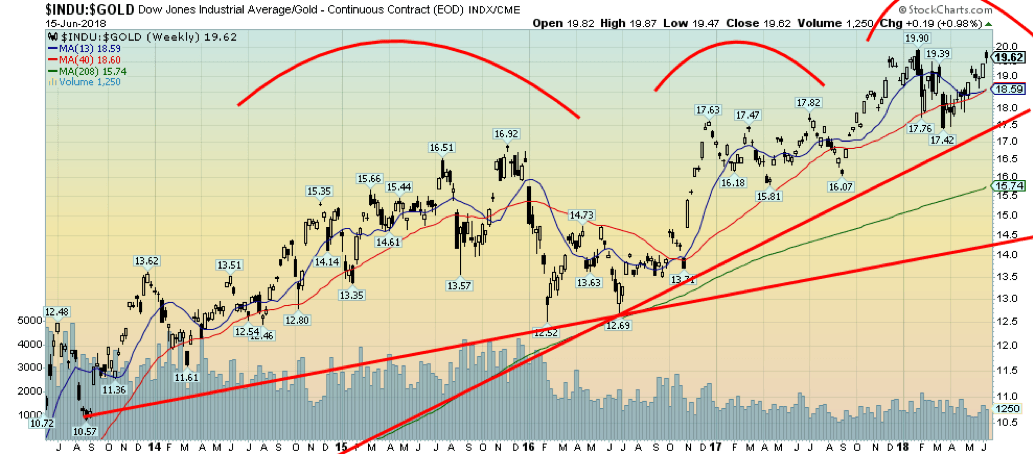
In looking at charts over the years we have often noted an overlooked pattern that we have seen on numerous occasions. We call it three thrusts to a top. Here is a closer look at the Dow/Gold ratio over the past five years. The gentler trend line is one that appears to be forming over the past five years. The steeper trend line is the one coming up from the 2008 bottom for the Dow/Gold ratio.
What we appear to be noting is that we may now be completing three thrusts to a top. Naturally, it is not as yet confirmed and we freely admit we could go higher. The trendline is currently at 17.5 so a breakdown under that level could send the Dow/Gold ratio down to the gentle trendline near 14.5. That would also break the 4-year MA and potentially signal a new era for gold to outperform the DJI.
A couple of other things we note. The corrective period from roughly October 2015 to October 2016 resulted in a double bottom at 12.52 and 12.69. The subsequent top made what appeared to be a triple top but as is the case with most triple tops it failed and in October 2017 the Dow/Gold ratio burst through to new highs. We could also be making a double top with the high in January at 19.90 and the current high 19.87. That, of course, remains to be seen.
—
DISCLAIMER: David Chapman is not a registered advisory service and is not an exempt market dealer (EMD). We do not and cannot give individualized market advice. The information in this article is intended only for informational and educational purposes. It should not be considered a solicitation of an offer or sale of any security. The reader assumes all risk when trading in securities and David Chapman advises consulting a licensed professional financial advisor before proceeding with any trade or idea presented in this article. We share our ideas and opinions for informational and educational purposes only and expect the reader to perform due diligence before considering a position in any security. That includes consulting with your own licensed professional financial advisor.


Temotiva Launches Crowdfunding Campaign to Advance Preventive Mental Health
Temotiva Innovación Lab has launched a crowdfunding campaign through Santander X Explorer, marking a new phase for the University of...


Fed Policy Shift Raises Concerns Over Debt and Inflation Risks
The Federal Reserve is criticized for resuming balance sheet expansion through Treasury purchases despite expectations of tighter policy under new...


AI Adoption in Italian Retail Stalls Despite Strong Experimentation
A survey on AI in Italian large-scale retail trade shows companies are increasingly adopting artificial intelligence, but only 1.4% have...


Crypto Market Stays Stable as Bitcoin and Ethereum See Mild Declines
The crypto market remained stable despite slight declines in major coins like Bitcoin and Ethereum. Bitcoin held near $64,362, while...


WNBA Removes Cannabis From Banned Substances List in New CBA
WNBA removed cannabis from its banned substances list in a new CBA running 2026–2032, aligning with NBA policy and allowing...
 |
|
 |  |
 |
|
-

 Africa2 weeks ago
Côte d’Ivoire Cocoa Price Crisis: Record Decision Turns into Market Breakdown
-

 Business1 week ago
The TopRanked.io Guide to 2026’s Biggest and Best Affiliate Opportunities
-

 Fintech5 days ago
Fintech and AI: Adoption Grows, but Profits Favor Agile Innovators
-

 Cannabis2 weeks ago
Argentina Legalizes Cannabis Seed Sales Under New Regulatory Framework
You must be logged in to post a comment Login