Markets
Why the Fed Left Rates Unchanged
The Fed left rates unchanged. The Bank of Japan (BOJ) hiked. The Swiss National Bank (SNB) cut. The latter was a surprise. The Fed hinted at 3 cuts later this year. But good economic numbers into Friday set the market back thinking higher rates for longer. The good numbers helped the US$ but sank stocks and gold. The Magnificent Seven are faltering but stock markets managed another round of all-time highs.

This was the week, once again, of the Fed. As was widely expected, the FOMC left rates unchanged at 5%–5.5% at the March 19–20 meeting. And, maybe not surprisingly, they announced the potential for three rate cuts in 2024. They also noted there could be fewer rate cuts in 2025 and their inflation forecasts are for a continuance of higher inflation. But they also felt growth would continue. The magic formula? A Fed-engineered soft landing? But inflation could remain high?
Maybe, maybe not. The Fed remains data driven so, as usual, one has to await the data. The data shows that inflation remains high, there is too much debt, and delinquencies and bankruptcies are growing for households, small business, and corporations. While there have been some casualties, none are big enough to take down the economy and spark a financial crisis. And while there are sovereigns also teetering on the edge, again none are big enough to spark a wider global collapse. Besides, the IMF along with the central banks of the major countries stand ready to support the system.
The economy remains robust. The Fed even hiked its GDP outlook for 2024 to 2.1% from 1.4%. Employment remains good, even as we note full-time jobs are teetering and part-time jobs are growing. There are affordability issues, particularly for households. Manufacturing has softened, but housing starts and new and existing home sales remain somewhat robust.
As economist David Rosenberg of Rosenberg Research points out, there have been ongoing downward revisions of economic numbers that came in previous months. In an article in Globe Investor “Why I’m sticking with my call on a U.S. recession”in The Globe and Mail, Report on Business (March 21, 2024), Rosenberg notes that downward revisions have been seen in payrolls, production, retail sales, and industrial production. However, all in all, it’s a goldilocks economy, so far.
And need we mention that the stock market remains robust, as both the S&P 500 and the Dow Jones Industrials (DJI) leaped to new all-time highs, with the DJI up a fat 400 points after the Fed announcement. The US$ Index fell and gold rose also to a new all-time high. Bitcoin also jumped but remains shy of its recently set all-time high.
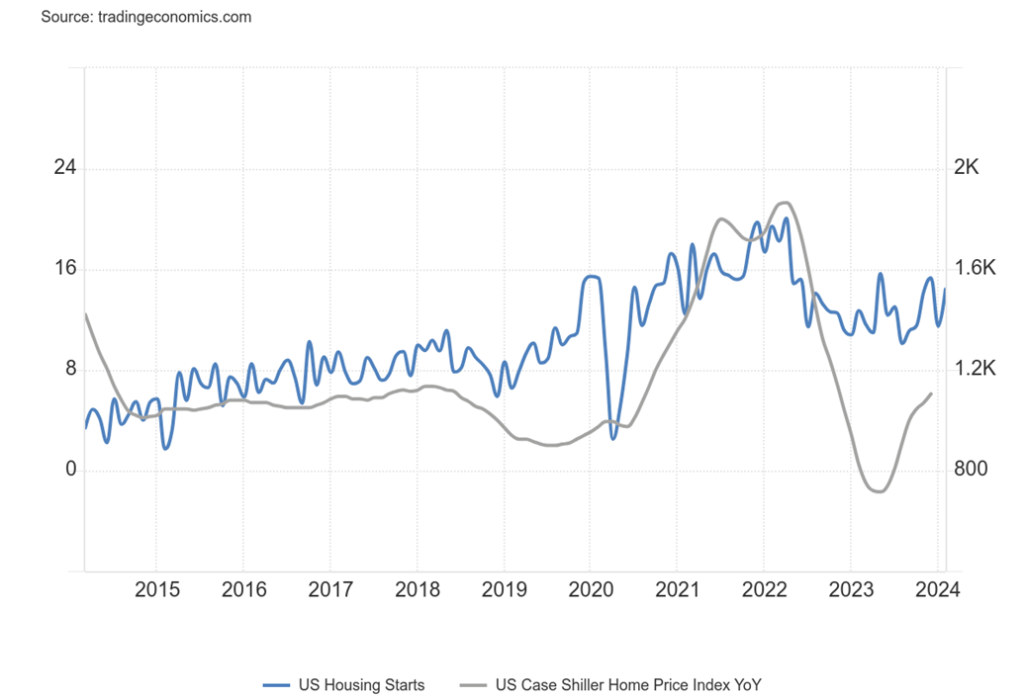
The chart below shows that housing starts remain robust and even house prices have perked up again after falling for a number of months. We are noting the same phenomenon in Canada. Can it continue?
Housing Starts, Case Shiller Housing Price Index
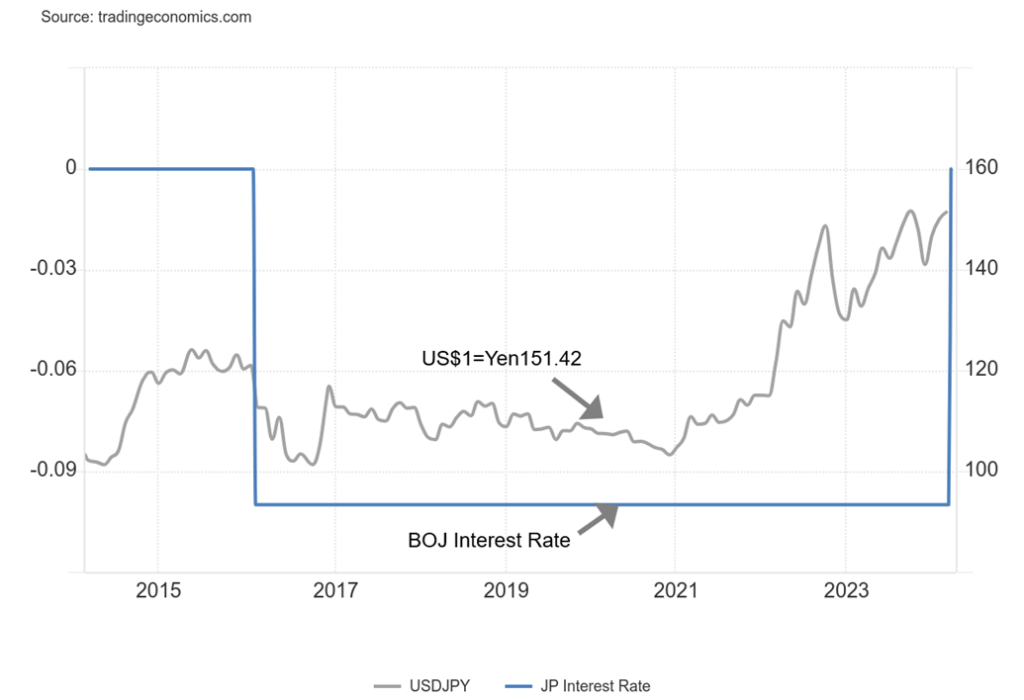
While the Fed was holding the fort on interest rates, the Bank of Japan (BOJ) did what many thought was the unthinkable: they hiked interest rates above zero for the first time since early 2016 and hiked the rate for the first time since 2007. The BOJ also dropped interest rate control for the 10-year JGB and ended purchases of ETFs and J-REITs. They are also slowing the purchase of bonds with the goal of ending it within a year. Inflation had jumped to 2% and a large 5.28% pay increase was in store for the largest companies.
Initially, the effect was that the Japanese yen fell (U.S. dollar rose against the yen). However, after the Fed held steady the yen bounced back. As well, the Tokyo Nikkei Dow (TKN) stock market jumped once again to new all-time highs. Noted that it only recently set the high, beating the high that had been in place since late 1989/early 1990.
Bank of Japan (BOJ) Interest Rate, US$ JP¥ 2014–2024
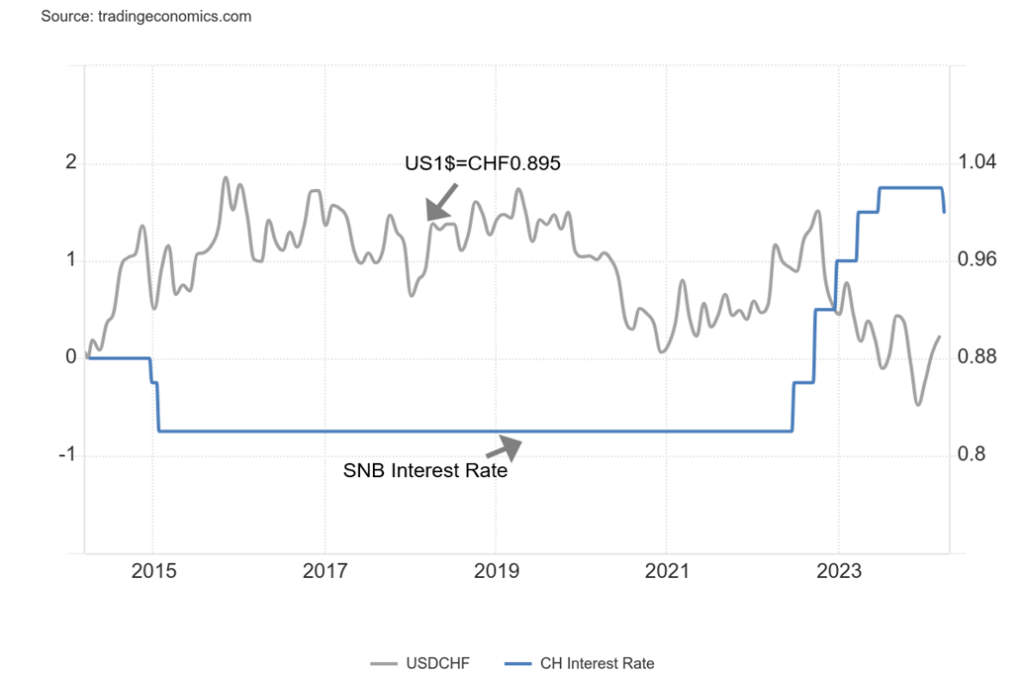
But we were not done yet. In a surprise move, the Swiss National Bank (SNB) cut its bank rate to 1.5% from 1.75%. They became the first major central bank to slash rates. Why? Well, their inflation was last down to 1.2%. As well, GDP growth in 2023 was an anaemic 0.7%, down from 2.7% in 2022. Is the action of the SNB a sign of things to come? Following the rate cut by the SNB, it was suggested that the BOE might follow. The U.K. economy has fallen into recession, albeit a very mild one so far.
Swiss National Bank Interest Rate, US$=CHF 2014–2024
With the BOJ hiking and the SNB cutting, it leaves the Fed caught once again between a rock and hard place. The U.S. economy continues to show some strength. The latest came when the Philly Fed (manufacturing in the Philadelphia area) was 3.2 vs. the expected -4.0. The S&P Global Composite PMI was 52.2 vs. an expected 51.5, while existing home sales surprised to the upside at 4.38 million, well above the expected 3.89 million.
Home sales rose in February by 9.5% when they were actually expecting a contraction of down 2.5%. As we know, the CPI for February came in up 3.2% when January’s rate was up 3.1% and forecasts were for 3.1%. As a result, all this keeps the pressure on that the Fed might not cut rates or, if they do, it will happen much later in the year.
Stock markets remain quite elevated. While the Magnificent Seven are faltering, with Apple and Tesla down on the year, the markets overall remain elevated. The Magnificent Seven have dominated the S&P 500 and NASDAQ, making a good 30% of the index. Contrast this with the TSX Information Technology Index (TKK) that is only about 9% of the TSX, dominated as it is by financials, energy, and resource stocks. Many of us believe that the stock market, led by the Magnificent Seven, has been in a bubble—and we’ve never seen a bubble that hasn’t eventually burst. Harken back to the late 1990s–early 2000s when the dot.com/high-tech bubble was in full force.
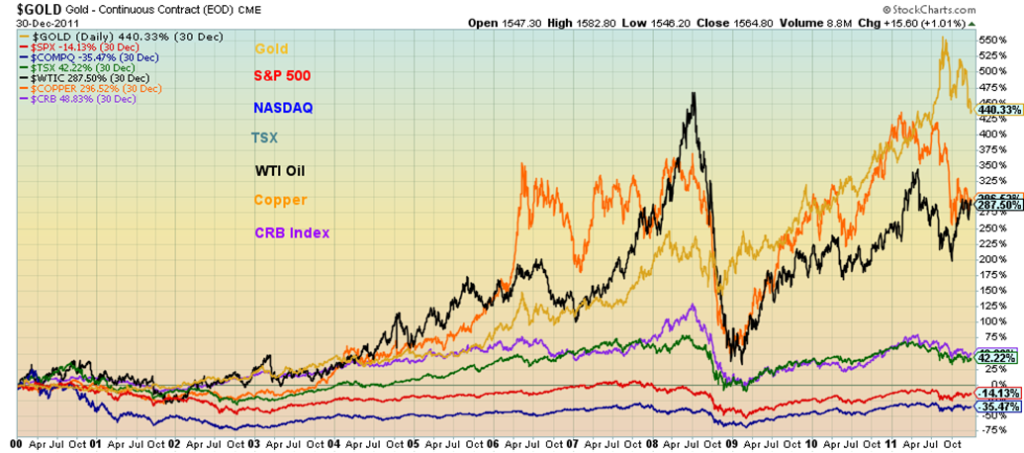
Many of the companies didn’t have any profit and limited revenue, yet valuations were put on them that were unrealistic. What followed was a lost decade as stock markets generally fell while commodities soared. Many such as gold, oil, and copper made all-time highs during the same period. Gold was the leader, up 440% from 2000 to 2011. At the same time, the S&P 500 fell 14% while the NASDAQ dropped 35%.
The TSX, thanks to its materials and energy sectors, rose 42%. Oil was up 287%, while copper gained 296%. With some of the same conditions, particularly a bubble in technology stocks plus signs that the resource sectors are waking up, another decade of a shift could be upon us once again. It’s worth noting that for the past decade stocks have outperformed the resource sector by a good margin.
Performance 2000–2011 Selected
Performance 2010–Present Selected
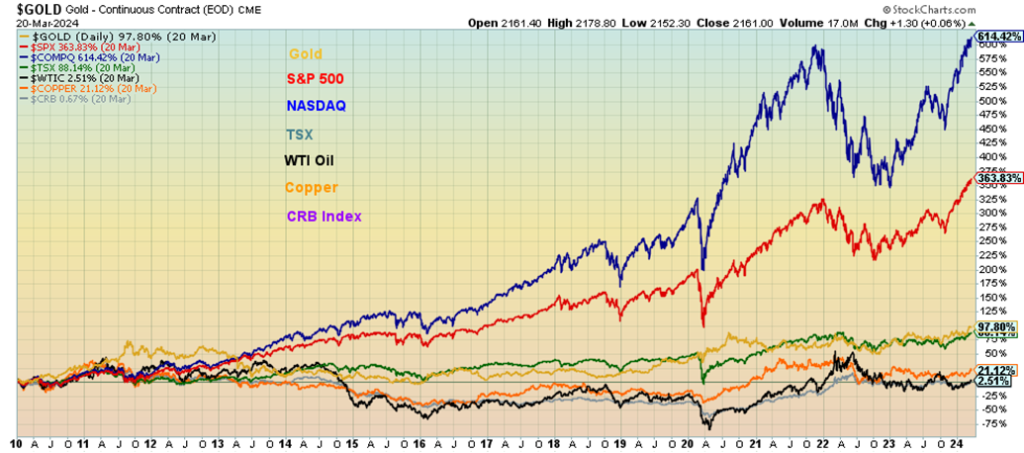
Contrast this with the period 2010 to the present and we see that the NASDAQ leads, up 614%, the S&P 500 gained 364%, while the TSX, dragged down now by the resource sector, gained only 86%. Gold is up 98%, oil up 2.5%, copper up 21%, while the CRB Index hasn’t even gained 1%.
We can also note that the periods following the Great Depression and war saw a similar shift. In 1949–1966 the stock market outperformed, in 1967–1982 resources, especially gold and oil, outperformed, and the period from 1982 to 2000 saw the stock markets, led by the dot.com/high-tech bubble, outperform. These pretty much follow the Kondratiev wave where stocks and resources alternate over periods that can last for 10–15 years, sometimes longer. We believe another shift is underway where we’ll see resource stocks rise over the broader stock market just as they did during 2000–2011.
We are in a rather seismic period. There are economic problems as globalization falters and high inflation persists, we have geopolitical problems centred on the Russia/Ukraine/NATO war and the Israel/Hamas war, we have social upheaval with Western nations deeply polarized to varying degrees over a number of issues, climate change is causing havoc highlighted by heat waves, droughts, floods, and more, and the world is up to its eyeballs in debt. On the positive side, technological advancements continue to be made (i.e. AI) and advances continue to made in medicine. The world has been through these upheavals in the past.
Chart of the Week
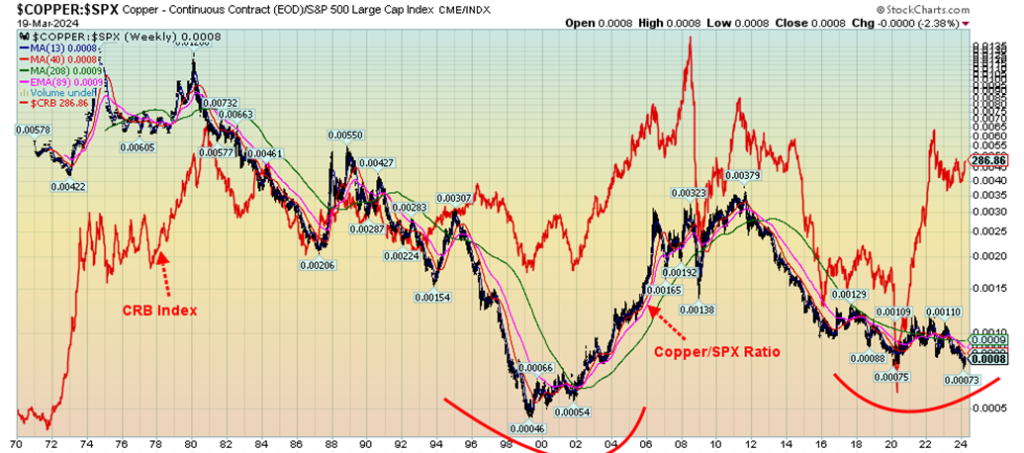
Ratio charts are quite useful in that they allow one to compare two assets, or two indices or, in the above case, a commodity with an index, or as we note next a commodity with another commodity. It also allows us to note trends and the dynamics of the market. Our chart above compares a commodity (copper) with an index (the S&P 500). Copper is a leading commodity used in a wide range of things because of its conductivity capabilities and its use an electrical conductor. Gold is also an electric conductor but copper is far more plentiful and therefore cheaper, which is why industry uses copper.
We noted last week that copper appears to have woken up from a long slumber. So we thought we’d have a look at copper, relative to the S&P 500 (SPX). One thing that was not surprising was that the copper/SPX ratio was rising at the same time that the CRB Index was rising.
That suggests that copper was a leading indicator of the so-called commodity super cycle. As a result, the copper/SPX ratio rose in favour of copper from 1999 to 2011 just as the CRB Index did and, coincidently, as did gold. That was also the case during the 1970s when stocks suffered, but commodities, led by copper and gold and one could say also oil, rose sharply, peaking around 1980.
Could the copper/SPX ratio now be making a potential multi-year double bottom? While the collapse into 1999 went lower, we note that the ratio also made a low in 2020 and then was equaled more recently. Copper demand is rising as a result of needs for the green revolution and for electrification. As well, it has been noted that infrastructure needs, particularly in the U.S., have been neglected, providing another potential source for copper demand.
Forecasts show copper moving into demand deposit as a result of these rising needs. Couple all of that with a stock market that may be in a topping phase and there is the potential for not just a sharp rise in the price of copper but all commodities in another commodity super cycle.
The first phase of that cycle emerged from the 2020 pandemic low. Following a period of consolidation, the next up phase may soon be underway. A move by the copper/SPX ratio over 0.001 might be the first good sign.
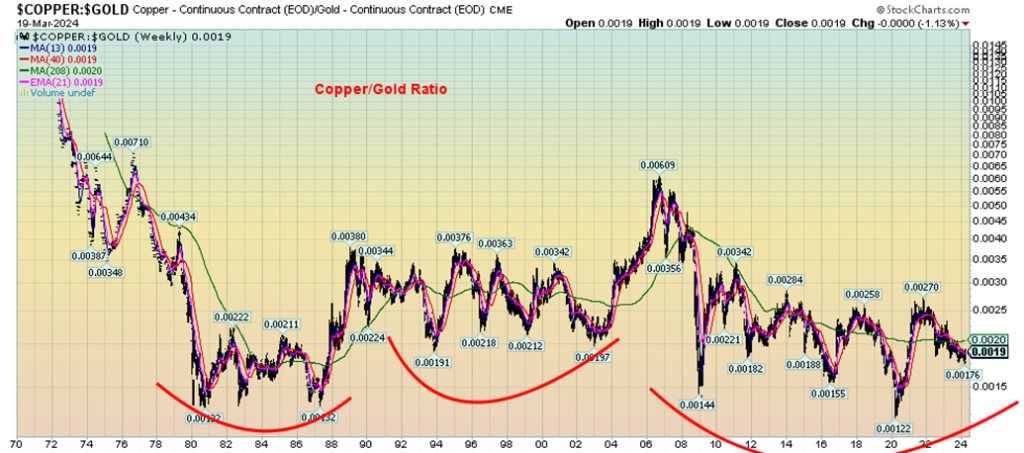
Our second chart shows the copper/gold ratio. It is no surprise that the chart shows a more stable relationship between the two. Both are electrical conductors, but gold is also a currency while copper had been a near currency with its use in coins and the old copper penny. Copper and gold fluctuate but there are periods where copper outshines, as was seen 2002 to 2006. We have noted that copper tends to be the leading indicator, so then maybe it was no surprise copper led into 2008 but after that gold led.
Gold also led into the pandemic low in 2020. Of late, gold has led again, pushing the ratio down to a low of 0.00176 in late 2023. Any move now for the ratio back over 0.0020 would suggest that copper is leading once again. But, as the chart shows, the two bounce around with periods of one leading. That’s quite unlike the copper/SPX ratio where it is clear when one is leading. Copper, we believe, is poised to lead once again.
Markets & Trends
| % Gains (Losses) Trends | ||||||||
| Close Dec 31/23 | Close Mar 22, 2024 | Week | YTD | Daily (Short Term) | Weekly (Intermediate) | Monthly (Long Term) | ||
| Stock Market Indices | ||||||||
| S&P 500 | 4,769.83 | 5,234.18 (new highs)* | 2.3% | 9.7% | up | up | up | |
| Dow Jones Industrials | 37,689.54 | 39,475.90 (new highs)* | 2.0% | 4.7% | up | up | up | |
| Dow Jones Transport | 15,898.85 | 16,010.98 | 3.3% | 0.7% | up | up | up | |
| NASDAQ | 15,011.35 | 16,428.82 (new highs)* | 2.9% | 9.4% | up | up | up | |
| S&P/TSX Composite | 20,958.54 | 21,984.08 (new highs)* | 0.6% | 4.9% | up | up | up | |
| S&P/TSX Venture (CDNX) | 552.90 | 552.31 | 0.3% | (0.1)% | down (weak) | down (weak) | down | |
| S&P 600 (small) | 1,318.26 | 1,311.59 | 1.9% | (0.5)% | up | up | up | |
| MSCI World | 2,260.96 | 2,372.60 | 0.9% | 4.9% | up | up | up | |
| Bitcoin | 41,987.29 | 63,601.08 | (6.8)% | 51.4% | up | up | up | |
| Gold Mining Stock Indices | ||||||||
| Gold Bugs Index (HUI) | 243.31 | 230.54 | (0.9)% | (5.3)% | up | up (weak) | down | |
| TSX Gold Index (TGD) | 284.56 | 274.59 | (0.2)% | (3.5)% | up | neutral | down | |
| % | ||||||||
| U.S. 10-Year Treasury Bond yield | 3.87% | 4.20% | (2.6)% | 8.5% | ||||
| Cdn. 10-Year Bond CGB yield | 3.11% | 3.47% | (3.1)% | 11.6% | ||||
| Recession Watch Spreads | ||||||||
| U.S. 2-year 10-year Treasury spread | (0.38)% | (0.43)% | (2.4)% | (13.2)% | ||||
| Cdn 2-year 10-year CGB spread | (0.78)% | (0.67)% | 5.6% | 14.1% | ||||
| Currencies | ||||||||
| US$ Index | 101.03 | 104.42 | 1.0% | 3.4% | up | neutral | neutral | |
| Canadian $ | 75.60 | 74.00 | flat | (2.1)% | down | down (weak) | down | |
| Euro | 110.36 | 108.08 | (0.7)% | (2.1)% | down (weak) | neutral | neutral | |
| Swiss Franc | 118.84 | 111.50 | (1.5)% | (6.2)% | down | down | up | |
| British Pound | 127.31 | 125.95 | (1.1)% | (1.1)% | down | neutral | neutral | |
| Japanese Yen | 70.91 | 66.06 | (1.5)% | (6.8)% | down | down | down | |
| Precious Metals | ||||||||
| Gold | 2,071.80 | 2,160.00 (new highs)* | (0.1)% | 4.3% | up | up | up | |
| Silver | 24.09 | 24.84 | (2.1)% | 3.1% | up | up | up (weak) | |
| Platinum | 1,023.20 | 898.40 | (4.8)% | (12.2)% | down (weak) | down (weak) | down | |
| Base Metals | ||||||||
| Palladium | 1,140.20 | 998.30 | (8.4)% | (12.5)% | up (weak) | down (weak) | down | |
| Copper | 3.89 | 4.01 | (2.8)% | 3.1% | up | up | neutral | |
| Energy | ||||||||
| WTI Oil | 71.70 | 80.63 | 0.1% | 12.3% | up | neutral | neutral | |
| Nat Gas | 2.56 | 1.81 | 9.7% | (29.3)% | neutral | down | down | |
New highs/lows refer to new 52-week highs/lows and, in some cases, all-time highs
It was another week of all-time highs, led by the S&P 500 (SPX) and the Dow Jones Industrials (DJI). Everybody, it seems, was making new all-time highs this past week. Others included the NASDAQ, the NYSE, the AMEX, the Dow Jones Composite (DJC), the S&P 100 (OEX), the NASDAQ 100 (NDX), the S&P 400 (Mid), the Russell 1000 and 3000, the Wilshire 5000, and the NY FANG Index.
On the week, the SPX was up 2.3%, the DJI up 2.0%, and the Dow Jones Transportations (DJT) was up 3.3% but is nowhere near its all-time high thus continuing the non-confirmation divergence with the DJI, the S&P 400 (Mid) gained 2.3% while the S&P 600 (Small) was up 1.9%. In Canada, the TSX Composite made new all-time highs (barely), up 0.6%, while the TSX Venture Exchange (CDNX) was up 0.3%. The S&P 500 Equal Weight Index also made new all-time highs, up 1.8% on the week. Bitcoin appears to be faltering, losing 6.8% down to $63,600. Many are now expecting Bitcoin to fall back under $60,000.
In the EU, the London FTSE gained 2.6% on rumours of the BOE cutting rates, the EuroNext was up 1.5% to new all-time highs, while both the Paris CAC 40 and the German DAX also made new all-time highs; however, the CAC closed down almost 0.2% while the DAX held its gains, up 1.5%. In Asia, China’s Shanghai Index (SSEC) was down 0.2%, the Tokyo Nikkei Dow (TKN) made new all-time highs again, gaining almost 5.0%, while Hong Kong’s Hang Seng (HSI) was down 1.3%. The MSCI World Index was up 0.9%.
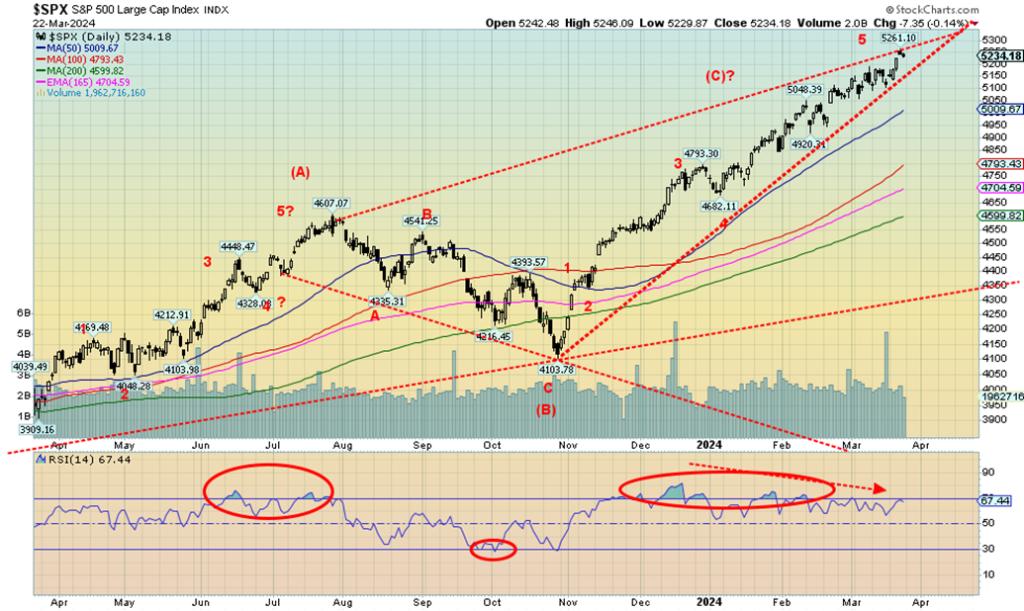
The SPX continues to make for us what appears as a huge ascending wedge triangle. This is bearish. The breakdown point comes in now at 5,100, but confirmation doesn’t really come until we are under 5,000 and preferably under 4,900. Other key breakdown points are seen under 4,700. We could go higher in the wedge, but the triangle is narrowing and the odds say it should break. A failed break would be for the SPX to just waffle through the end point without breaking down. Friday’s fall came as a result of hints that the Fed might not be in a big hurry to cut rates, despite indicating after the FOMC announcement on March 20 that three rate cuts were possible in 2024.
We are in a period where we need to see some signs we are topping. Recall that in March 2000 we put in the final top of what was to become the dot.com/high-tech bear market of 2000–2002. Our expectations have been for a top this month. However, we do need to see confirmation and that won’t come for us until we are under 4,900. That rise since the October 2023 low has been almost continuous. We’ve seen that before with rises in 2002–2007, 2011–2015, and especially out of the March 2020 pandemic low where the market went up almost without interruption into January 2022. Because of the length of those rallies, we can’t rule out further new highs yet.
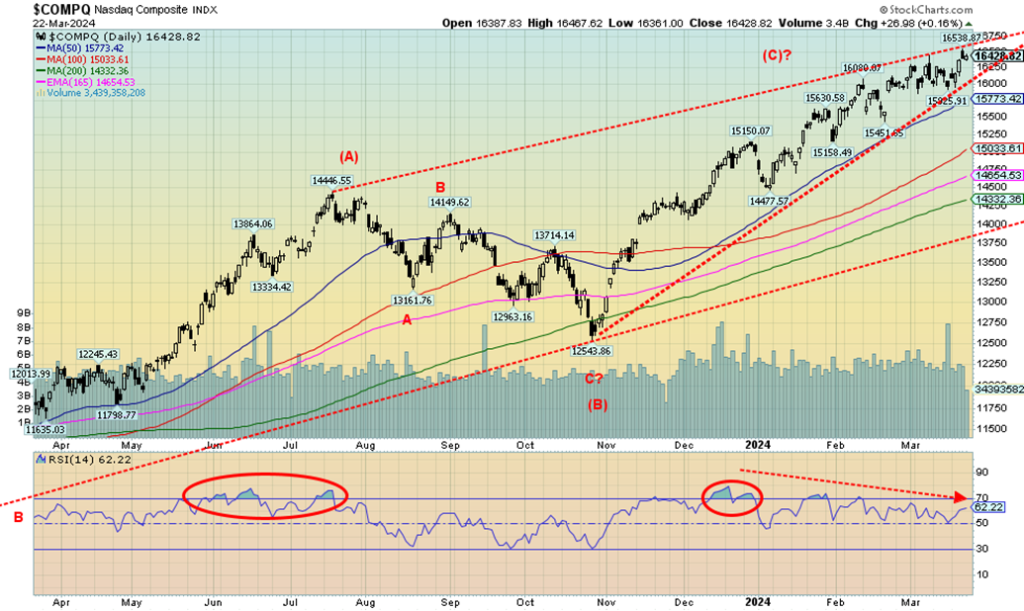
The NASDAQ hit new all-time highs this past week as the FAANGs continued to lend support. The NY FANG Index also hit new highs, up 4.4%. The NASDAQ gained 2.9%. Leading the charge for the FAANGs was Nvidia, up 7.4%, and Google, up 6.8%. Tesla recovered, gaining 4.4%, while Meta was up 5.3%. Netflix was the only one to hit new all-time highs, up 3.7%.
The big loser was AMD, down 6.0%. The NASDAQ continues to rise in what appears to us as huge wedge ascending triangle. The breakdown point is under 16,000. Under 15,775 and especially under 15,500 the top would be confirmed and a deeper correction could get underway. There remains the possibility of further new highs. We’ve had a number of false signals that we might have topped. But the wedge is getting steeper and we see this index as running out of room to get much higher.
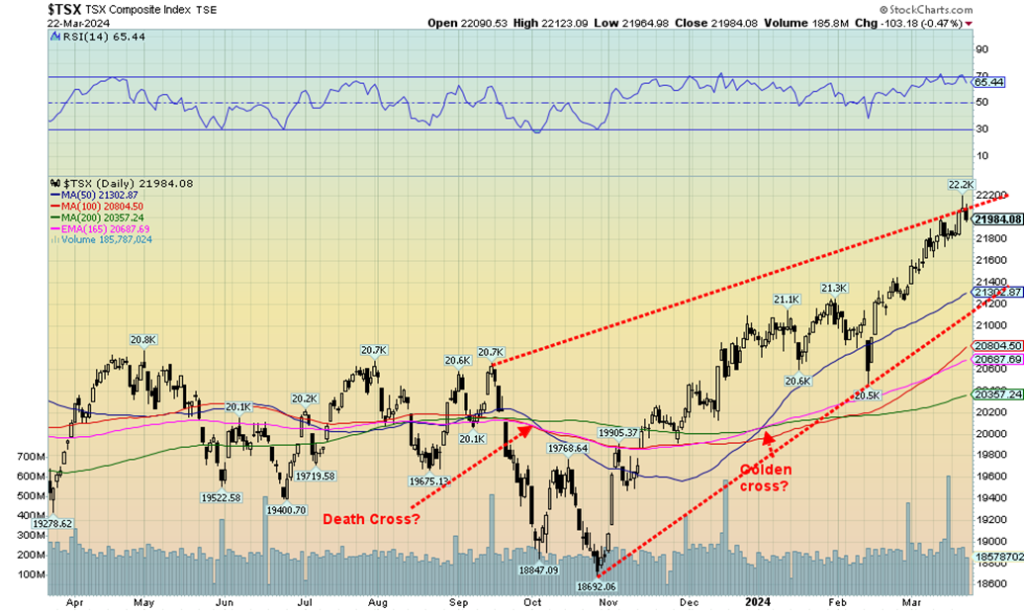
Pop the champagne. The TSX Composite made new all-time highs this past week (barely beating the old mark by only a few points). The TSX 60 did the same thing. Then hints that the Fed might keep rates higher for longer pushed the TSX down on Friday, ending the week up 0.6%. The small cap TSX Venture Exchange (CDNX) gained 0.3%. The sub-indices saw four fall, while the other 10 rose. Leading the downward march was Telecommunications (TTS), off 2.6%. Consumer Staples (TCS) fell 1.2%.
The winner was Health Care (THC), up a solid 10.6%. New all-time highs were seen for Consumer Discretionary (TCD), Industrials (TIN), and Energy (TEN,) while Financials (TFS) and Health Care (THC) made fresh 52-week highs. Given the steep rise since the October low (TSX was up almost 19%), a corrective period might be appropriate.
A drop under 21,800 and especially under 21,600 might see the TSX fall to 21,300. What we don’t know is whether this a final top, as we noted with the S&P 500, etc. A drop under 20,500 would confirm for us that we may have made a final top. New highs above 22,300 would suggest that the rally continues.
U.S. 10-year Treasury Note
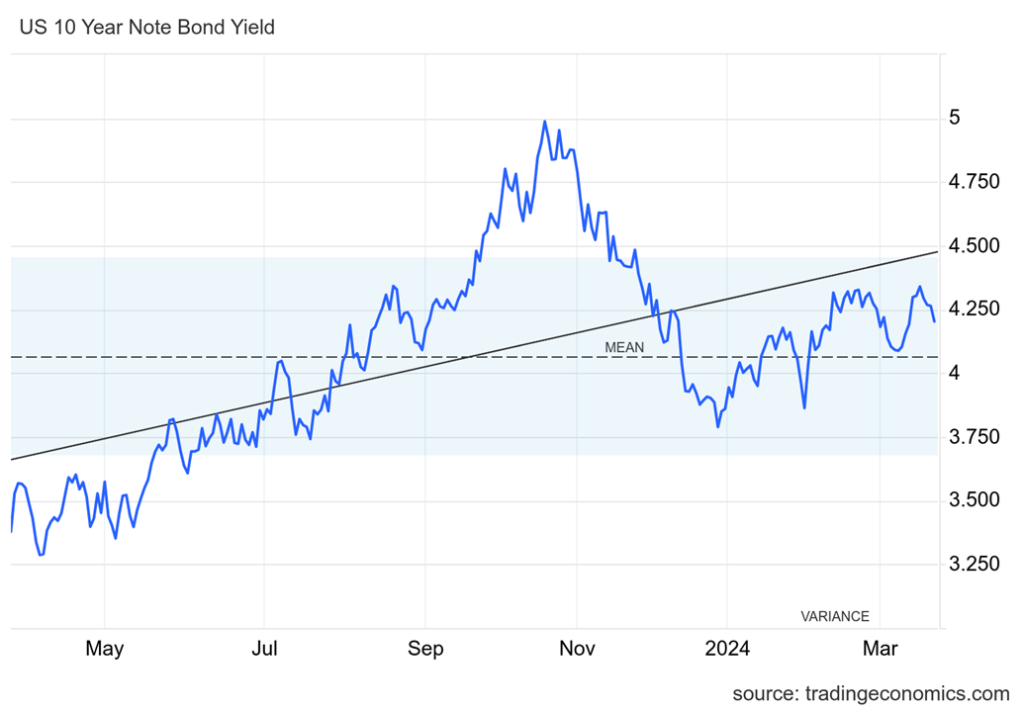
The U.S. 10-year treasury note fell this past week to 4.20% from 4.31%. The catalyst, of course, was the Fed leaving rates unchanged at the FOMC March 20 meeting with expectations of three rate cuts in 2024. We’ve reviewed most of the numbers out this past week that could influence interest rates. The 10-year held steady on Friday, even as the stock markets and gold waffled and the US$ Index strengthened. A move under 4% would suggest that we could head lower toward 3.75%.
However, we’ll have to start seeing a further slowing of the economy, something we are not seeing yet. One of the biggest indicators is employment. This week the weekly claims came in at 210,000, below the expected 216,000 and last week’s 212,000. Employment is still showing strength. This coming week the big numbers out are GDP Q4 final, which is expected to be 3.2% below the previous 4.9%. We also get house price indices, durable goods, and the Conference Board’s consumer confidence.
Canadian Government 10-year Bond CGB
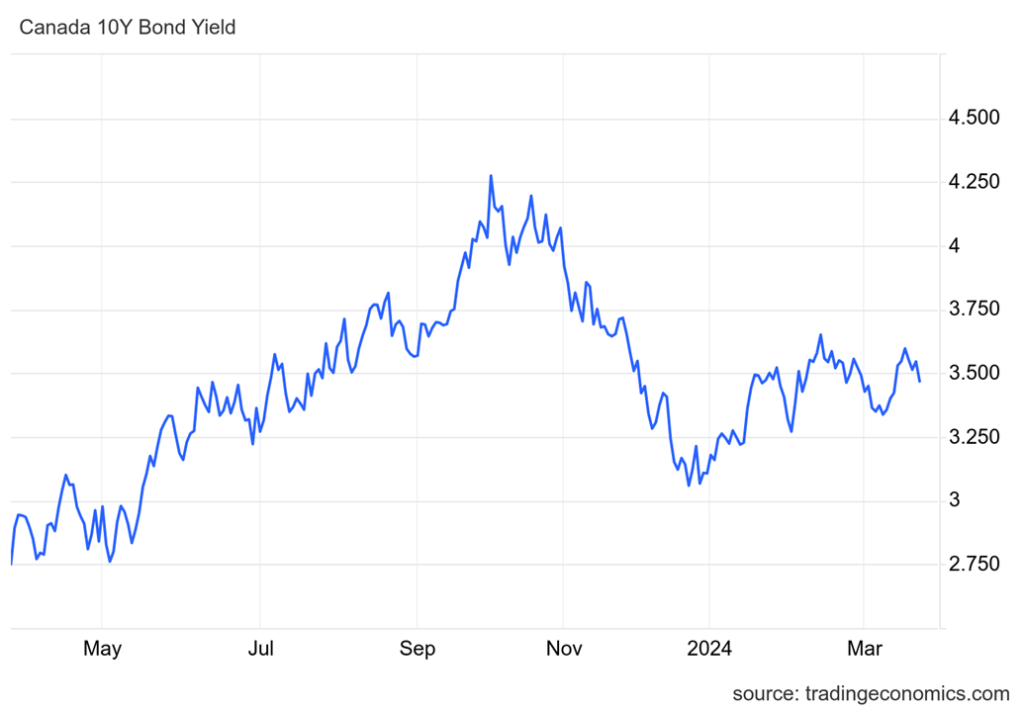
The Canadian Government of Canada 10-year bond (CGB) saw yields fall this past week to 3.47% from 3.58%. The 2–10 recession spread narrowed to 67 bp from 71 bp. The big numbers for Canada were the CPI and PPI earlier in the week. Canada’s CPI came in lower than expected at 2.8% below last month’s 2.9% and expectations of 3.0%. The PPI was down 1.7%, better than the expected decline of 2.0%.
The inflation numbers were mixed. Canada’s housing price index was down 0.4% over the past year, slightly better than the 0.5% decline expected. Retail sales faltered in January, down 0.3% but over the year they were up 0.9%. Both were below expectations. Despite all this Canada, unlike the EU and the U.K., is not yet poised to fall into recession. But the weaker numbers helped the 10-year to fall this past week.
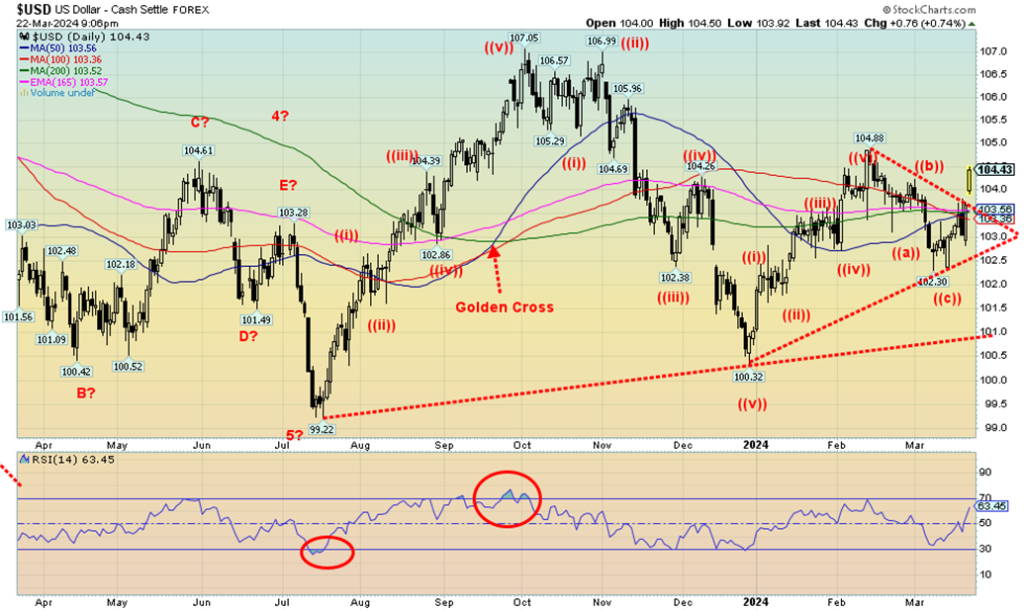
Thanks to hints that some central banks may be poised to cut interest rates (SNB did) and hints that the Fed might not be in that much of a rush to cut rates, the U.S. economy continues to do better than expected. That helped spark a breakout for the US$ Index over 104, closing at 104.43. The triangle suggests we could go as high as 109 once we make new highs above 104.88 the February high.
While 109 might not be the ultimate target, we could see a high of 106 once we are through the February high. A failure to break above 104.88 and a fall back through 103.50 could suggest that we will fall rather than go up. But for the moment the US$ Index appears to have broken out. A rising US$ Index is negative for gold.
On the week, the US$ Index was up 1.0%, the euro fell 0.7%, the Swiss franc fell 1.5%, thanks to the SNB cutting rates, the pound sterling dropped 1.1% on hints that the BOE might follow the SNB, while the Japanese yen dropped 1.5%, despite the hike from the BOJ. The Cdn$ was just caught in all this and ended the week basically unchanged.
Given the rise so far, we’d have to take out 105.50 to suggest we are poised to take out the September 2023 high of 107.05.
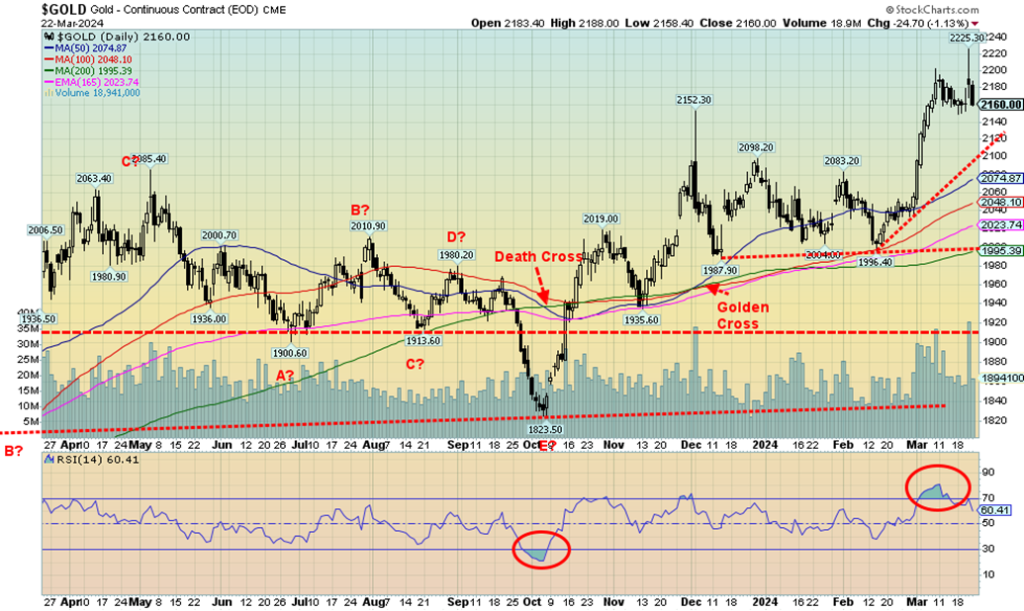
Gold hit a record high this week following the Fed’s hold-the-line announcement on interest rates. The Fed also suggested up to three rate cuts in 2024. This sparked gold to rally to new all-time highs at $2,225 as we cleared $2,200 for the first time. But, like what happened back in December, it was a spike high followed by a sell-off. After the mixed signals of the BOJ hiking rates while the SNB cut rates, fears grew again that the Fed might not cut as fast as some want. Better than expected manufacturing numbers (as we noted earlier) would do that.
Gold corrected further on Friday and then closed on the week down just under 0.1%. Silver didn’t fare as well, losing 2.1%, while platinum fell a sharp 4.8%. Palladium also dropped off 8.4% while copper was better, falling only 2.8%. The gold stock indices also fell with the Gold Bugs Index (HUI) off 0.9% and the TSX Gold Index (TGD) down 0.2%. Not a great week. The commercial COT wasn’t helping either as it came in at 28% as it continues to be under 30%. As we noted, the US$ Index jumped on the expectations of higher rates for longer.
The expectation here is that, following this correction, gold will eventually take out $2,200 with minimum targets of $2,300 and secondary targets up to $2,500. However, as we saw after the early December spike over $2,100, gold followed a pattern of ups and downs into February before the current upward thrust got underway. The advance appears to have unfolded in five waves to the top at $2,225. That suggests that after another correction we should advance once again on a strong up wave. Admittedly, this could last into late
April or even into May before we turn up once again.
Gold should have support down to $2,140, but under that level we could fall to $2,100 and trendline support. The 50-day MA is down at $2,075. Under that level we’d have more concern that any correction could be deeper and longer.
Of all the central banks, the Fed is the only one that is not signaling a potential immediate cut in rates. The BOJ was hiking rates because of an uptick in inflation in Japan. They also ended a long period of negative interest rates. But with mixed signals coming from the Fed, traders took it as a signal that the Fed may hold the line on interest rate cuts for now. That helped push the US$ Index higher and gold lower.
A corrective period is underway, but it’s not the end of the current gold rally. As noted, we prefer we stay above $2,100 but would not want to see gold go under $2,075.
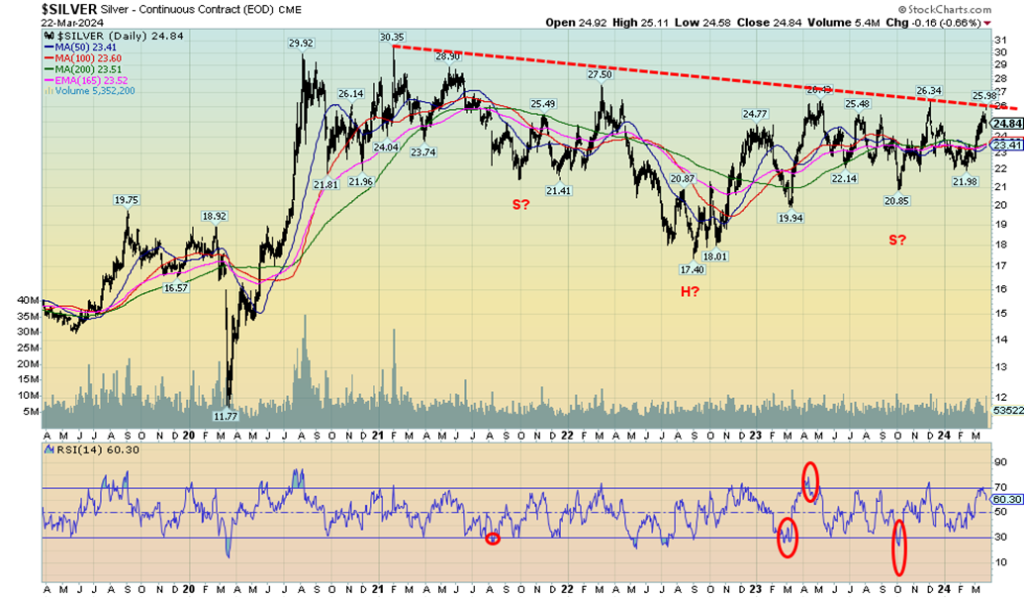
Silver teased us with a breakout above $26, then faded along with gold, closing the week down 2.1% and back under $25. Resistance zones continue to act as a stopper. The high was $25.98. Nonetheless, the potentially compelling multi-year head and shoulders pattern keeps us awaiting a breakout above $26 with confirmation only to come above $27.50.
Targets could then be up to around $39. We do have good support down to $23.50, but under $23 silver would look lower. A break under $21 would suggest the potential head and shoulders pattern is breaking down. The commercial COT isn’t helping us as it has fallen to 28% for silver, the same as gold. We prefer to see it over 40%.
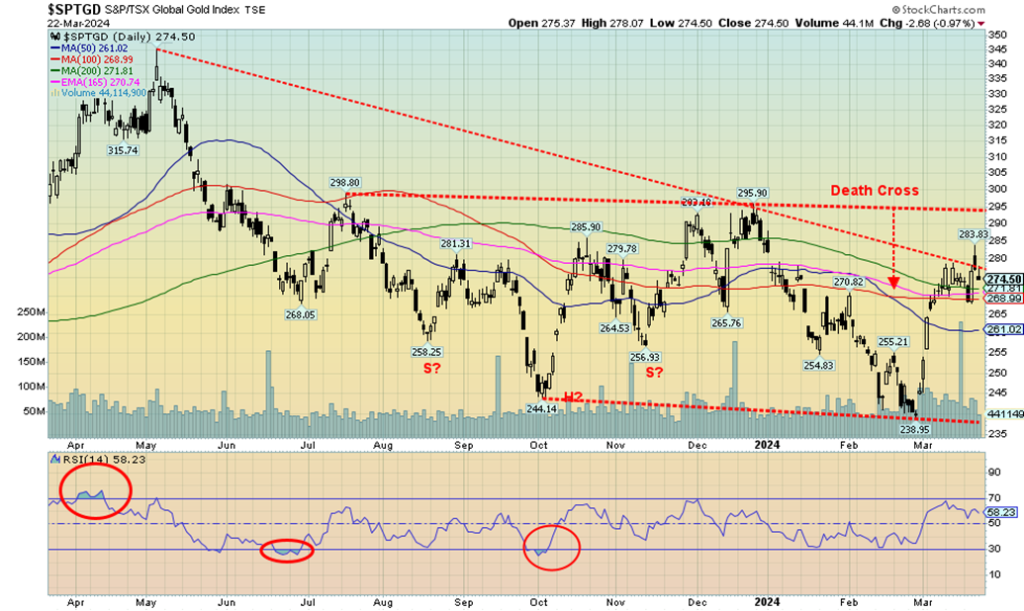
It appeared that the TSX Gold Index (TGD) was on the cusp of breaking above its resistance line around 275, only to be pushed back under the next day. While we had 275/280 as a resistance zone, it proved that it really is. We hit a high of 284 before pulling back Friday to 274. On the week, the TGD fell 0.2% while the Gold Bugs Index (HUI) dropped 0.9%. This shows once again that resistance zones do mean something. But the fact we penetrated the zone suggests we should regroup before moving higher again. Breaking above 295/300 we’d consider to be more important.
Above 320, new highs are possible over the May high of 345. Indicators are not overbought and the Gold Miners Bullish Percent Index (BPGDM) remains at a low 35.7. Plenty of room to move higher. 268/270 should now be support, but a break under 268 could suggest we could test lower towards 260. Only below 250 would suggest new lows ahead. Gold stocks continue to trace out what appears to be a bottom pattern. Relative to gold, the gold stocks remain very cheap. We continue to see signs of accumulation; however, we have not as yet broken out.
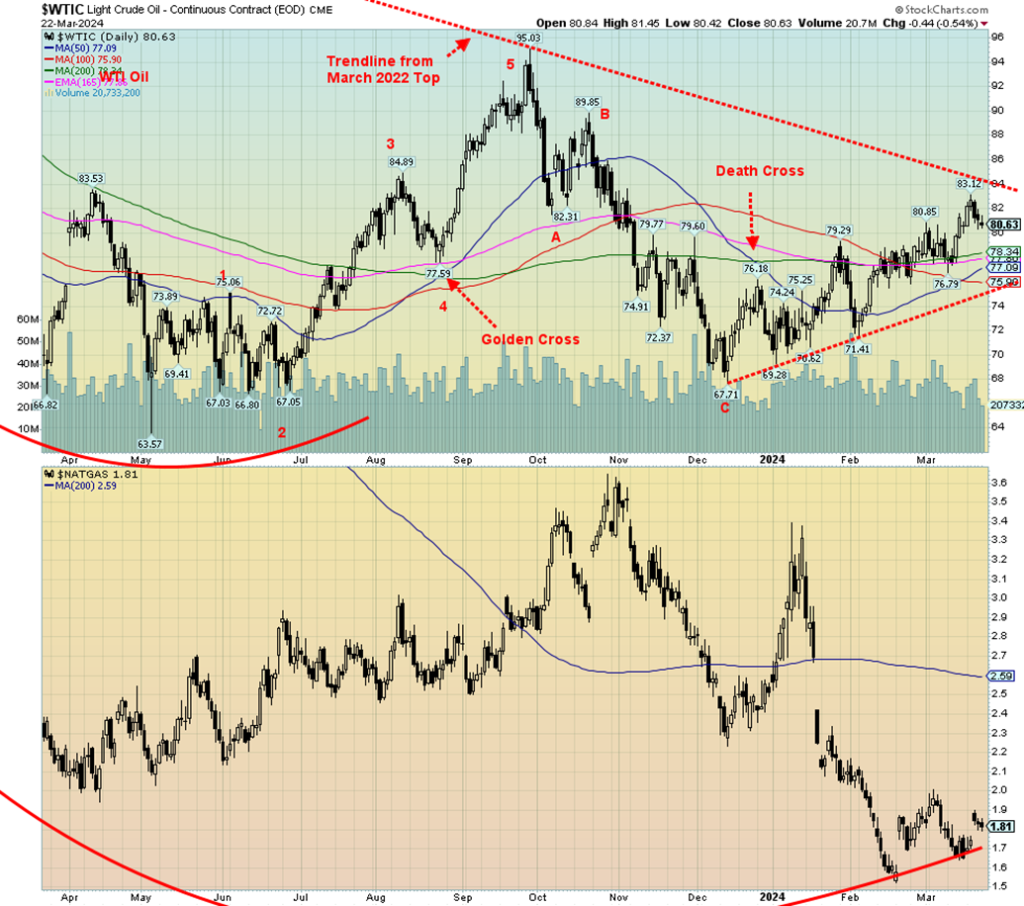
Geopolitical concerns, or should we say easing of geopolitical concerns seemed to drive the energy markets this past week. With talk of a ceasefire in Gaza on the agenda, tensions eased somewhat there. But the likelihood of anything holding appears slim. As well, the U.S. was trying to urge Ukraine not to fire missiles at Russian refineries. Could it be that the U.S. is fearful of higher oil prices and is therefore trying to dampen things?
Of course, anything is possible. But it helped push Brent back under $85 and WTI oil also fell back. WTI oil actually held a small gain for the week of less than 0.1%, while Brent lost 0.6%. Natural gas (NG) prices rose as some demand picked up, particularly in Asia, there were ongoing problems in Norway with power outages at a hub, while repairs to an LNG Terminal in Texas were choking supply in both cases.
Henry Hub NG rose 9.7% while EU Dutch Hub rose 2.8%. The energy stocks are still signaling to us that prices should move higher as the Arca Oil & Gas Index (XOI) was up 1.5% and the TSX Energy Index (TEN) rose 1.4%. Both indices (as did some oil and gas stocks) made all-time highs. But, so far, both are just over the all-time high mark.
WTI oil still needs to take out $84 to tell us we are headed to $100 or higher. We can see potential targets of up to $120/$125 once we take out $84 and then take out that September high of $95.03. Regardless of any easing of tensions in Gaza or Ukraine, the signs are still pointed higher for oil.
__
(Featured image by Austin Distel via Unsplash)
DISCLAIMER: This article was written by a third party contributor and does not reflect the opinion of Born2Invest, its management, staff or its associates. Please review our disclaimer for more information.
This article may include forward-looking statements. These forward-looking statements generally are identified by the words “believe,” “project,” “estimate,” “become,” “plan,” “will,” and similar expressions. These forward-looking statements involve known and unknown risks as well as uncertainties, including those discussed in the following cautionary statements and elsewhere in this article and on this site. Although the Company may believe that its expectations are based on reasonable assumptions, the actual results that the Company may achieve may differ materially from any forward-looking statements, which reflect the opinions of the management of the Company only as of the date hereof. Additionally, please make sure to read these important disclosures.
Copyright David Chapman 2024
David Chapman is not a registered advisory service and is not an exempt market dealer (EMD) nor a licensed financial advisor. He does not and cannot give individualised market advice. David Chapman has worked in the financial industry for over 40 years including large financial corporations, banks, and investment dealers.
The information in this newsletter is intended only for informational and educational purposes. It should not be construed as an offer, a solicitation of an offer or sale of any security. Every effort is made to provide accurate and complete information. However, we cannot guarantee that there will be no errors. We make no claims, promises or guarantees about the accuracy, completeness, or adequacy of the contents of this commentary and expressly disclaim liability for errors and omissions in the contents of this commentary.
David Chapman will always use his best efforts to ensure the accuracy and timeliness of all information. The reader assumes all risk when trading in securities and David Chapman advises consulting a licensed professional financial advisor or portfolio manager such as Enriched Investing Incorporated before proceeding with any trade or idea presented in this newsletter.
David Chapman may own shares in companies mentioned in this newsletter. Before making an investment, prospective investors should review each security’s offering documents which summarize the objectives, fees, expenses and associated risks.
David Chapman shares his ideas and opinions for informational and educational purposes only and expects the reader to perform due diligence before considering a position in any security. That includes consulting with your own licensed professional financial advisor such as Enriched Investing Incorporated. Performance is not guaranteed, values change frequently, and past performance may not be repeated.


TopRanked.io Weekly Affiliate Digest: What’s Hot in Affiliate Marketing [Changelly Affiliate Program]
It's official. TikTok is (potentially) dead. And, if you believe the news, that's gonna destroy thousands of small businesses and...


Terre et Lac Launches Crowdfunding for a Photovoltaic Power Plant
Terre et Lac, a Lyon-based company, launches a crowdfunding campaign for a solar plant in Voreppe. Residents of Isère and...


Qonto, Ledger, and Younited Credit, Leading Trio of the French Fintech Ecosystem
Qonto emerges as the top fintech in the latest rankings after its successful Series D funding. The 2024 Fintech 100...


Cannabis Clubs: Germany Introduces Strict Regulations
Germany introduces new regulations aimed at tightening control over cannabis clubs, following recent reforms. The Cannabis Act (CanG) allows limited...


Merck Invests Over 300 Million Euros in a New Research Center in Germany
Merck invests over 300 million euros in a new biotech research center in Germany, part of a larger 1.5 billion...
 |
|
 |  |
 |
|
-

 Business1 week ago
What You Can Do to Create an Online Store People Trust
-
 Business2 weeks ago
CardCash.com Pulls off Massive Turnaround in Ramp Up to RSTN Nasdaq Uplisting
-

 Markets4 days ago
Soybeans and the Products Closed Lower Last Week
-

 Cannabis1 week ago
Oktoberfest Without Cannabis: German Authorities Are Considering Introducing a Ban