Featured
Gold plunges deeper in the stock market
Gold stocks closed in another all-time low since December 2015.

Shortly after gold fell to $1,046 in December 2015, I called for a bear market rally that ranged from $1,375 to $1,428. That low mark of $1,375 has been tested three times since without being able to break above. That’s not a good sign.
Gold has been steadily down since the third test on April 11th.
I first warned our Boom & Bust subscribers on June 4th that a break below the late 2016 rising trendline would likely trigger a further fall.
Then again on June 15th as the break was occurring, saying that it “may be the last chance to sell gold for any kind of decent profits.”
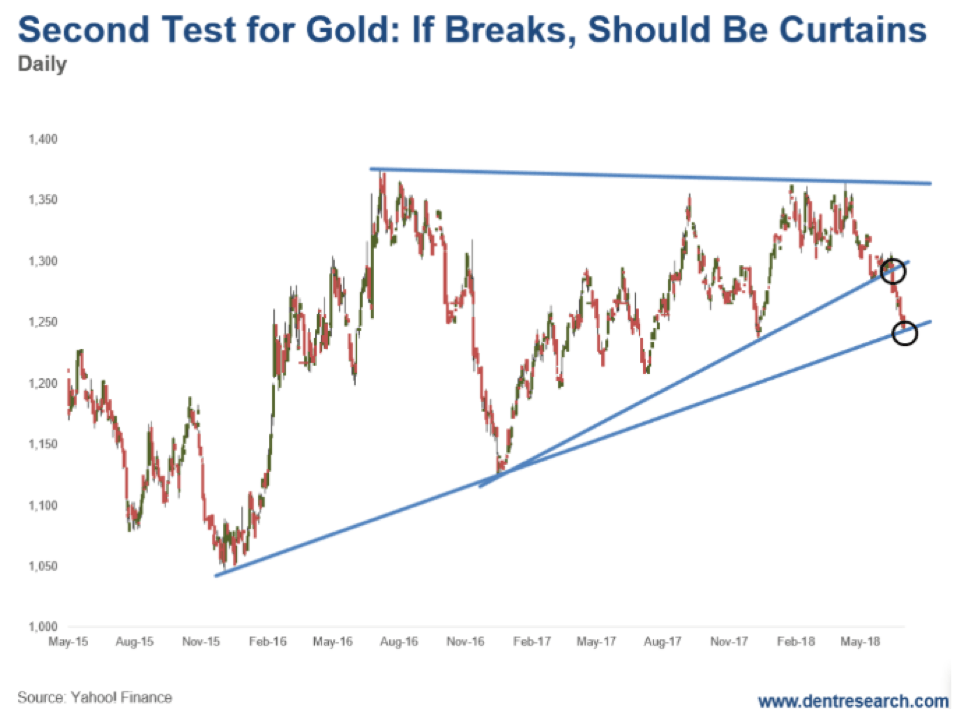
© Harry Dent
The yellow precious metal went straight down from there.
After giving a sell signal at around $1,290, it has now tested a second bottom trendline that extends back a year earlier from the major low of $1,046 on December 11, 2015. Yesterday’s low should be the final support, which will be a “make or break” point for gold.
If it cannot hold here — if it breaks significantly below Monday’s low of $1,240 — then the next real support is back at that $1,046 to $1,050 range. After that, it’ll drop to the lows seen in late 2008 around $700.
Silver is at a similar critical level. It was just under $16 on Monday and has been tested several times since late 2015.
Gold is oversold short-term and is bouncing a bit this (Tuesday) morning, as expected. This bounce could easily go back to $1,270 or so. But a clear break of this rising bottom trendline ahead would be the last stand for gold.
Mark Hulbert, a financial analyst, measures long-term sentiment in many indices. He doesn’t see gold at levels that invite a major bottom and rally ahead. His sentiment indicator for gold is at -13 percent on Monday against -30 percent, which is more ideal for major bottoms.
He says gold bugs are only moderately bearish, but that’s not bearish enough.
The dollar has also been rallying from its lows of 88 and is trying to break above the resistance at 95.
A break like that would be further bearish for gold. The precious metal trades in dollars and a rising dollar means falling gold prices. The rise in short- and long-term interest rates prompted by the Fed don’t agree with gold either since it yields no interest to compete.
And that looks to continue for many months ahead. Now, if gold were to mount a strong rally and break above $1,375, then that could actually be a bullish move that projects it towards $1,650 or so.
This is what bitcoin is doing after testing the critical $5,800 to $6,000 levels that I recently warned about. But, again, that doesn’t look likely.
So, how much do you love your gold?
Hopefully not enough to be like the gold bugs. They’ve so much emotional and ideological attachment. Despite heroic attempts to stimulate growth and inflation, we’re in a deflationary era until at least 2020, and likely into 2023.
This isn’t favorable for gold since it hasn’t fully deflated from its bubble that peaked in September 2011. Gold’s bubble deflation requires the minimum of a $700 low — the level seen in the 2008 crash.
Its bubble action (bubble origin) started in 2005 at $450. That would be the ultimate deflation and low for this bubble.
If that happens, then load up the truck and get ready for the next long commodity and inflation cycle. One where gold could see something like the $5,000 that gold bugs are forecasting — it’s just that they will be dead by then!
If you make the rational decision and sell on the break, you can buy back if it does happen to break convincingly above $1,375 without missing too much.
But again, that’s the unlikely scenario of chance here with greater downside than upside near term.
—
DISCLAIMER: This article expresses my own ideas and opinions. Any information I have shared are from sources that I believe to be reliable and accurate. I did not receive any financial compensation for writing this post, nor do I own any shares in any company I’ve mentioned. I encourage any reader to do their own diligent research first before making any investment decisions.


SBTi Net-Zero Standard 2.0 Enhances Corporate Climate Action
The Science Based Targets initiative (SBTi) has released Corporate Net-Zero Standard Version 2.0, a major update to its global framework...


Europe’s Cannabis Shift: Rising Use, and New Risks
EUDA report shows cannabis remains Europe’s most used illegal drug, with 22 million adults trying it. Use is highest among...


Remote Work Reshapes Sales Management: Key Lessons for Moroccan Leaders
Remote work is rapidly expanding among Moroccan managers, yet practices lag behind. Insights from France show higher productivity but weakening...


Corn Prices Slip Amid Strong Crop Conditions and Favorable Weather
Corn was lower again last week on Midwest rains despite a neutral WASDE report. The report showed slightly higher beginning...


Advances in Biomarkers and Targeted Therapies Transform Kidney Care in Autoimmune Disease
New biomarkers and targeted therapies are reshaping the management of kidney damage in autoimmune diseases like lupus and vasculitis. Experts...
 |
|
 |  |
 |
|
-

 Africa2 weeks ago
Morocco’s Record Grain Harvest Spurs Temporary Import Barriers to Protect Farmers
-

 Cannabis5 days ago
Cannabis Legalization in Germany: A Mixed Interim Assessment
-

 Crypto2 weeks ago
Crypto Market Slumps as Bitcoin and Ethereum Fall, Sentiment Turns to Fear
-
 Impact Investing16 hours ago
SBTi Net-Zero Standard 2.0 Enhances Corporate Climate Action
You must be logged in to post a comment Login