Featured
Is this the start or the end of the recession?
Thursday’s 1,800+ point drop for the DJI was the 4th largest on record. The drop left a unique pattern on the charts that if correct suggests a top is in and a long decline to test the March lows could be underway. Rather than a decline like in March, it is more likely to be a long grinding affair with many counter trend moves. As the stock markets fell, the U.S. dollar, bonds and gold rallied.
The recession has started. No, the recession is over. How can that be? According to the National Bureau of Economic Research (NBER), the recession got underway in February 2020 with numerous indicators hitting a peak. It’s been downhill all the way since. It was the longest period of expansion ever recorded—128 months or 10 years, 8 months. It was the weakest post-war expansion since the economic expansion immediately after WW2. Average annual growth was 2.3%. It was also the second weakest employment expansion since the period 2001–2007, averaging 1.1%.
It is now the shortest post-war recession, lasting a mere four months. Whoa! Hold on a second. The declaration and proof that the recession is over is the May job numbers that saw a gain of 2.5 million in the U.S. and almost 290 thousand in Canada. The market had expected a large rise. In the U.S., the unemployment rate fell to 13.3% from 14.7%, although here in Canada the unemployment rate went up to 13.7% from 13.0%. Now we know from the Bureau of Labour Statistics’ (BLS) own numbers that some furloughed workers considered themselves employed even though at the time they were unemployed. If that were the case, the real unemployment rate in April for the U.S. was 19.5% but fell to 16.3% in May. A sharp 3.2 points drop. Continuing claims are also coming down having peaked four weeks ago at 24,912 thousand.
Some other indicators, including consumer confidence, purchasing managers manufacturing indices (exception Chicago), and non-manufacturing indices all improved in May. The expectation is that retail sales for May will also show an improvement. Profits fell in Q1 and should be down again in Q2, but the expectation is they should rebound by Q3. The Fed has pumped up its balance sheet by $2.9 trillion since the beginning of March and money supply (M2) is also up $2.5 trillion. No surprise then that the market cap of the S&P 500 has jumped $2.8 trillion. The Fed is going to maintain its zero-interest rate policy into 2022.
But the big indictor for many is the stock market. And it is up, up, and away. Well. at least it was until it hit an air pocket on June 11, 2020.
“NASDAQ HITS ALL-TIME HIGH. Tremendous progress being made, way ahead of schedule. USA!”—Donald Trump, 45th President of the U.S.A., tweet on June 10, 2020, 8:49 am
Yes, the NASDAQ has continued to hit all-time highs this past week. So, is that an indication that the recession is over? Hopefully, Trump didn’t check where it was after a 5.3% drop on June 11, 2020.
Let’s get back to reality. We freely admit that the rally has been fueled by an unprecedented wave of liquidity provided by the Federal Reserve, the U.S. Treasury, and here in Canada, the Bank of Canada along with the Federal government. Couple that with huge leverage, low interest rates, and the sense that you can’t lose since the “Fed has your back” and it has unleashed this remarkable rally. Another element is now being noticed. The disbursement of billions to keep the unemployed afloat has seen a sharp rise in the savings rate and an unprecedented wave of new customers opening up brokerage accounts. New online brokerage accounts have surged 77% at Fidelity from a year ago. In the quarter ending March 31 new accounts at TD Ameritrade leaped 249%. Others have reported a surge in new accounts, including E*TRADE, Freetrade, and Charles Schwab. At eToro, new accounts are up 300% this year. The same is being seen at Canadian discount brokerage firms. It seems that everyone is becoming a day trader.
“Stocks only go up; this is the easiest game I’ve been a part of.”—Dave Portnoy, Founder bro-tastic Barstool Sports website
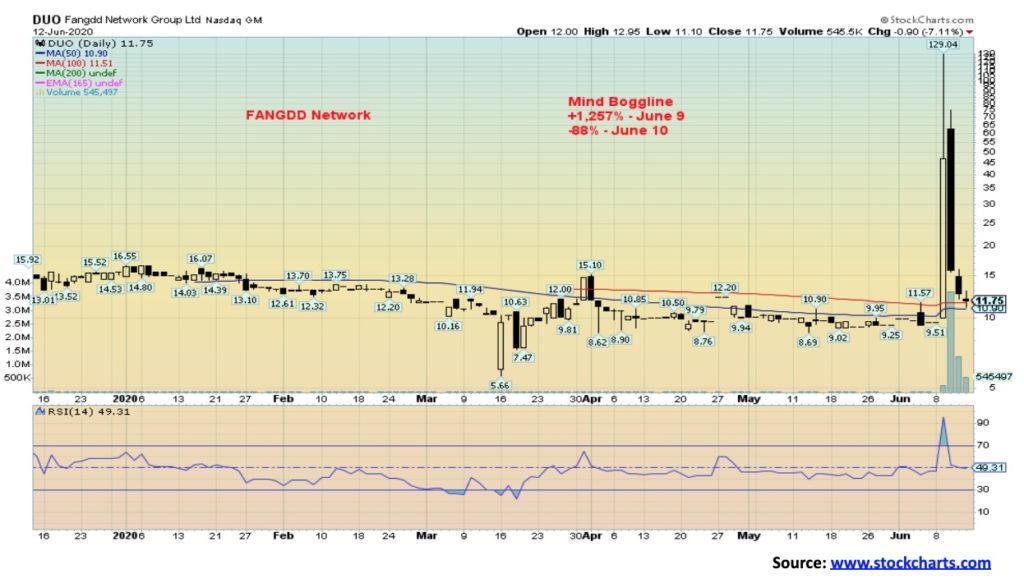
The guy is 43 and he has become a “FinTwit” figure (short for “financial twitter”). He apparently has 1.5 million followers. Portnoy jumped into airline stocks when Warren Buffett sold his. The airline stocks soared after that. Hmmmm. Hope they took their profits. The frenzy seems to have been highlighted by this previously unknown company called FANGDD Network (DUO-NASDAQ) that soared a mind-boggling 1,257% on June 9, only to quickly lose altitude and plunge 88% on June 10. The stock has only been around since November 2019. What is it? A Chinese online real estate company trading as American Depository Receipts (ADRs). When retail chases something it becomes a phenomenon. Traders must be asking themselves, “Do I feel lucky?” “Well, do you?”
Apparently the FAANGs (Facebook, Apple, Amazon, Netflix, Google) are in the same category and that has helped propel them to new heights. For those who remember the “Nifty Fifty” rally of 1972, maybe we should call this the “Phenomenal Five” of 2020. Or is it the “Phenomenal Six” if we add Microsoft to the mix.
Besides Portnoy, we have what has become known as “Robinhood traders.” Robinhood is a new popular stock-trading app that bizarrely greets visitors with the motto “It’s Time to Do Money.” All we can think of is how all of these wannabe trader newbies are going to be taken to the cleaners when they find out that what goes up also comes down. And when it comes down it takes no prisoners.
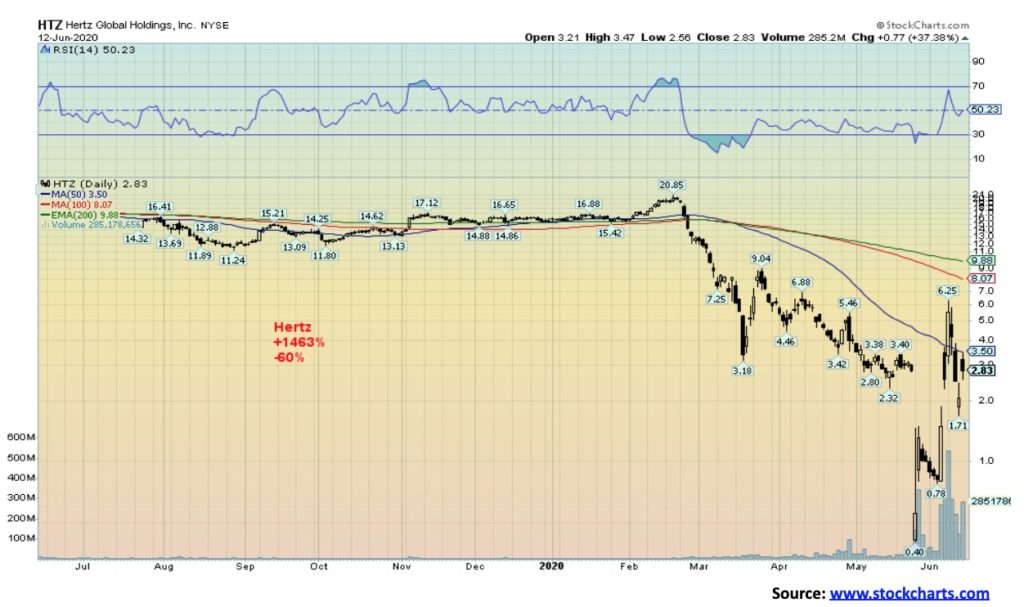
The phenomenon goes beyond DUO. Apparently, a bankrupt company is also fair game as shares of Hertz (HTZ) and Chesapeake (CHK) surged following their declaration of bankruptcy. Hertz surged from 40 cents on May 26 to $6.25 by June 8 (+1,463%). By June 10 it had fallen back 60%. Hertz rebounded again when it was learned they were able to raise $1 billion by issuing more shares.
Chesapeake Energy leaped 897% from May 14 to June 8. By June 10, CHK was down 78% from the June 8 high. CHK rose from the dead, then it died again. All of this seems to highlight the fact that the stock market is nothing more than a gambling casino. One can’t go to Las Vegas or bet on sports but you can open an online brokerage account and try and turn your $1,200 stimulus cheque or your $2,000 CERB cheque into $1,000,000. Just follow “Dave.” Note: massive speculation occurs at tops, not bottoms.
The COVID-19 collapse is a phenomenon in itself. Over a course of 33 days from February 19, 2020 the S&P 500 plunged 35.4%. Then over the next 77 days the S&P 500 rose 47.5%. Should this be a reminder that from September 3, 1929 to November 13, 1929 (70 days) the Dow Jones Industrials (DJI) fell 42.9%? Then, over the next 155 days November 13, 1929 to April 17, 1930 the DJI was up 48%. The bear market was over, the recession was over. ^NOT. It was just getting started. Over the next 2 years, 2 months, 21 days the DJI fell 86%.
None of this is to suggest that the DJI is about to fall 86% again. But there is a strong possibility a top is in. The coronavirus has struck again. The economic numbers, despite some improvement, remain depressed. We are also reminded of the 1966–1982 secular bear market. What it was, was a series of ups and downs. The DJI struggled to surpass 1,000 during this period. There were four significant rallies and five significant declines. It wasn’t until 1983 that the DJI finally surpassed the 1,000 level for good.
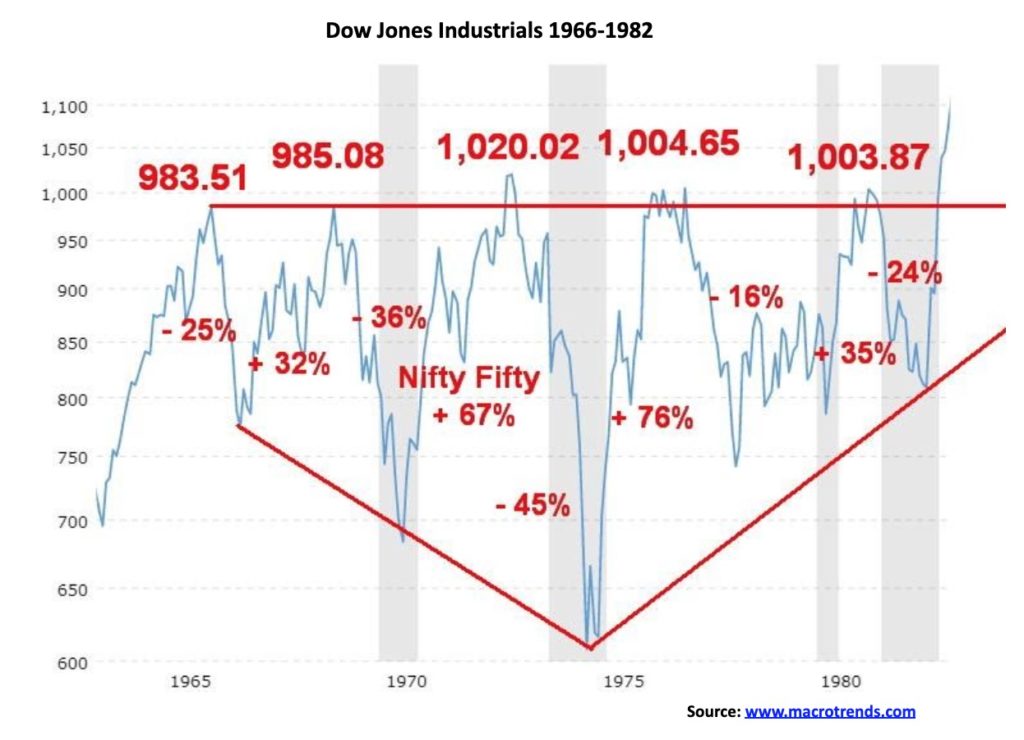
But the picture of the S&P 500 was quite different during this period, highlighting divergences between the DJI and the S&P 500. The S&P 500 mostly made higher highs during the period 1966–1982 except for that lower top in 1978. Each time the bear market was declared over and a new bull market was on its way. The proof was the S&P 500 making new highs. Except it wasn’t a new bull market. All were bear market rallies. This time around, the NASDAQ has made new all-time highs; however, none of the other major indices joined it. A significant divergence.
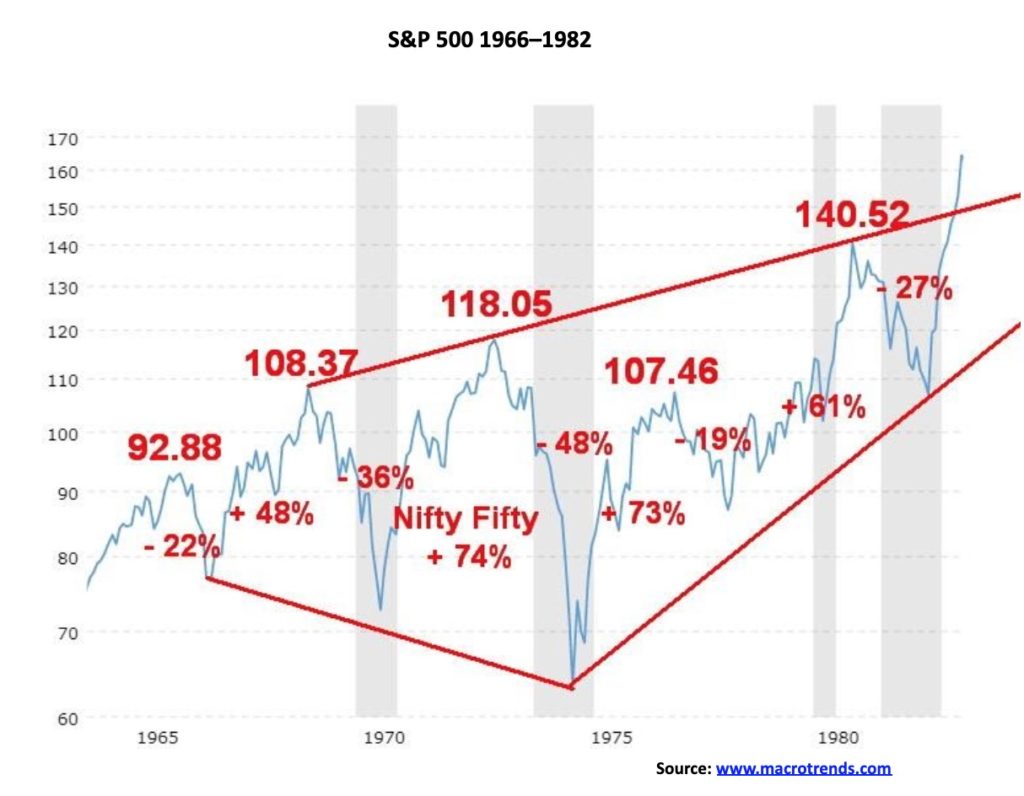
The stock market peaked in February 1966 and the final low was not seen until August 1982. The 1960s and 1970s were played out against the backdrop of the Vietnam War, anti-war protests, racial unrest and race riots, inflation, a divisive nation, Watergate, an oil embargo, and culminating in the Iranian hostage crisis with oil prices soaring to record levels. On an inflation-adjusted basis the DJI fell 72%, a figure almost comparable with the 1929–1932 collapse of 86% on an inflation-adjusted basis. Gold, however, soared during the same period, rallying 590% from 1970–1980. Gold was fixed during the Great Depression but Homestake Mining, a leading gold miner, that eventually became a part of Barrick Gold, at the time soared 400% even as the DJI was falling 86%. A comparable move today could see gold rise to $5,000/$6,000.
Is it ironic that today we made a top in February 2020 against the backdrop of a pandemic, a very divided nation, and growing racial and social unrest not seen since the 1960s. As our opening quote said:
“The four most dangerous words in investing are: ‘This time it’s different.’” – John Templeton
We repeat the same errors over and over again. Do we learn from history? Apparently not.
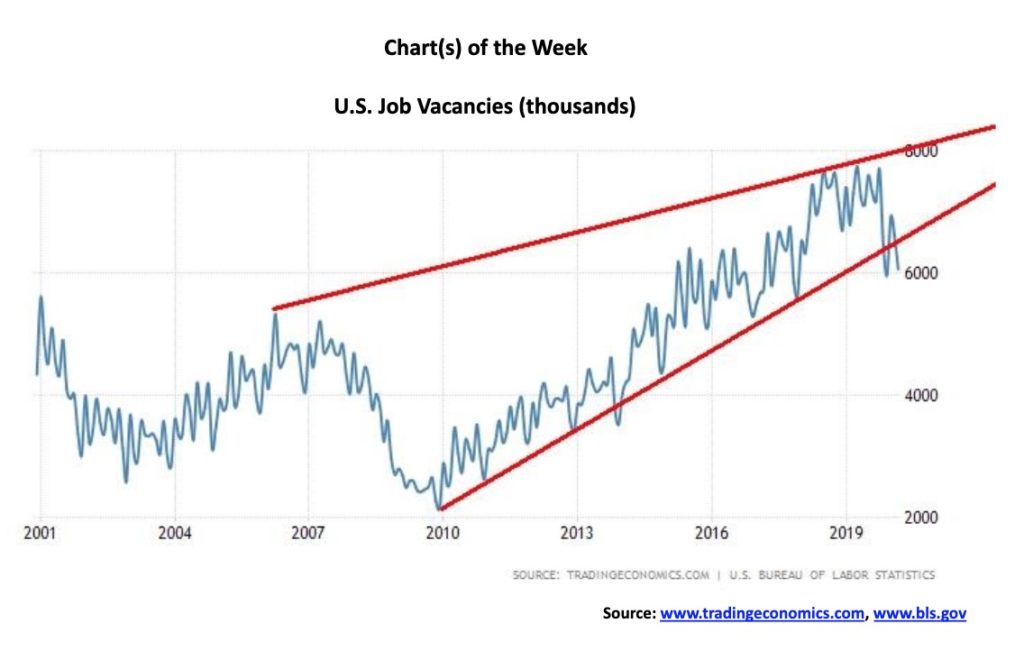
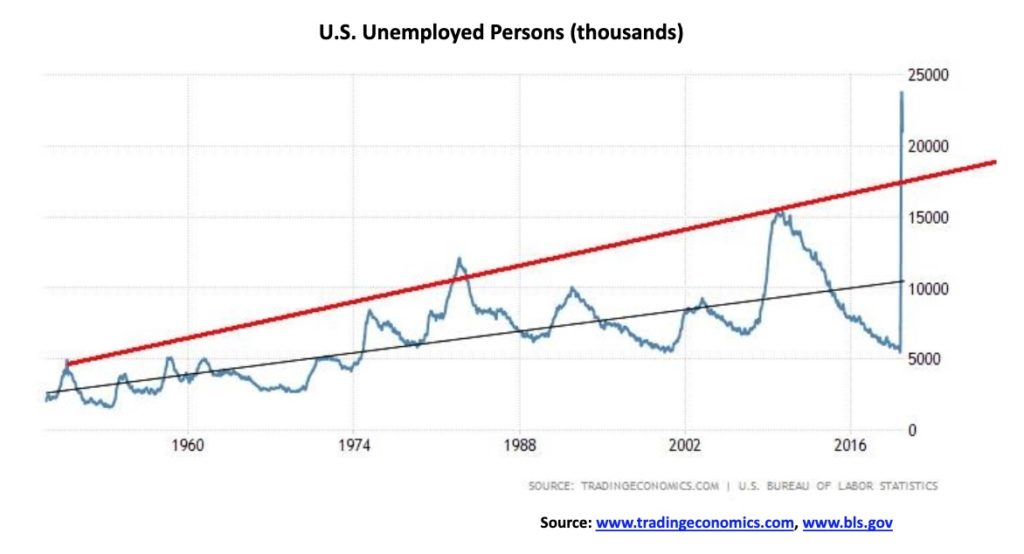
We should more rightly start calling this Economic Charts of the Week. This week’s missive starts with two moving in opposite directions. Top is U.S. job vacancies. The last figures available are for March where there were some 6,060 thousand openings. It was the lowest level since December 2019 when openings probably fell for seasonal reasons. As well, the number of openings appears to have broken a 10-year uptrend. That doesn’t bode particularly well for the unemployed. The number of unemployed persons has, of course, soared to over 20 million. In March, in order to match up with the job vacancies, the number of unemployed persons was 7,140 thousand. Naturally, all of the unemployed don’t necessarily line up with the openings because of skills, eductation, requirements, etc. Our understanding without actually seeing April’s and May’s job vacancies is that the number of vacancies has fallen further.
At the same time as the number of unemployed persons is soaring and job vacancies are falling, the number of persons employed has fallen to 137,242 thousand in May but is up from April’s 133,403 thousand. Of that, 116.5 million are full-time and 20.7 million are part-time. The number of part-time employed has fallen from 26.6 million seen in March 2020.
So many more unemployed, along with falling job vacancies—this doesn’t bode well. As well, there numerous anomalies in the these reports. They report 21 million unemployed but there are 30 million collecting unemployment insurance benefits. Uh?? Apparently it is all because of faulty data collection.
An example is a part of the job’s report is determined by a household survey where the interviewee asks if there is anyone over the age 16 employed, unemployed, or not in labour force. But the COVID-19 crisis has depressed the responses; with in-person meetings halted, this restricts how they reach households. Response rates have fallen. In May, the Bureau of Labour Statistics (BLS) reported there were 9 million who had lost their jobs but were counted as “not in labour force” rather than unemployed as they weren’t looking for a job over the previous four weeks because of the COVID. If they were considered unemployed the U3 rate would jump to 17.9% from 13.3% and in April it would have been 19.8% rather than 13.7%. March would have seen a rate of 7.5%. As well, there were millions of workers classified employed as they felt they were awaiting to be called back. The reality is they were unemployed, but because they thought they’d be called back they get counted as employed. Another Uh! To add to it, anyone who was paid for just a part of the period was counted as employed, even though they were now not working; i.e., were unemployed.
What we gather from all of this is there is a reasonable chance that unemployment claims peaked in April; however, just because they are falling doesn’t mean there is a recovery when there remain over 30 million people unemployed. This past week another 1.5 million people applied for unemployment claims, bringing the 11-week total to 40.7 million. That was down from 1.9 million the previous week and marginally above expectations. Continuing claims total 20.9 million, down marginally from the prevous week’s 21.3 million and the peak four weeks ago of 24.9 million. Continuing claims were also slightly above expectations. As well as 1.5 million applying for unemployment benefits, some 700 thousand applied for Pandemic Unemployment benefits (similar to Canada’s CERB program).
We’d looked at figures for Canada, but the job vacancies reports appear to us as a serious lag as the last good data we could find was for Q3 2019. Hardly relevent today. Canada’s reporting of unemployed is conducted differently than in the U.S. and many consider Canada’s reports to be more accurate.
Is the party over? We have to ask ourselves that, given what happened on Thursday with the huge 1,800+ point collapse of the Dow Jones Industrials (DJI). That collapse made it the fourth largest drop on record and quickly brought back memories of the huge collapses seen in March 2020. Despite the huge point collapse, the drop didn’t even register in the top 20 percentage collapses. The top 7-point drops in DJI history were all seen this year. Still, the drop must have rattled a few cages, especially one in the White House. So why the drop? The media rushed to explain. Cases of the COVID-19 are rising globally (see our comments on COVID-19 further down); the Fed’s outlook was anything but rosy (cold water on the market from Powell); Robinhood traders added to the volatility (sorry, it was given as a reason); and technicals broke. They might have added that the technicals were overextended, bullish sentiment was at the extremes last seen at the February 2020 high, and valuations were once again in la-la land territory.
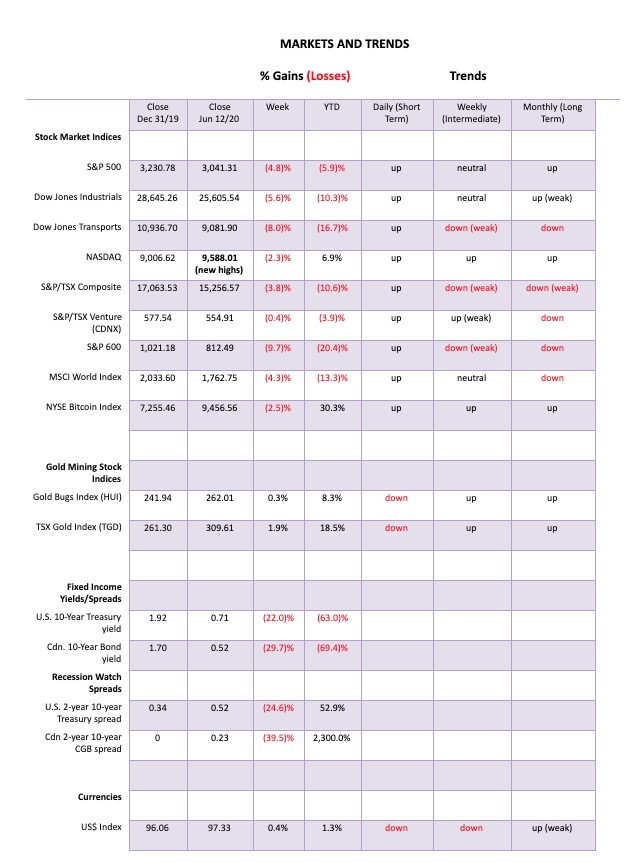
On the week, the S&P 500 fell 4.8%, frustrating those who were poised to see the S&P 500 turn positive on the year. Now the S&P 500 is down 5.9% on the year. The DJI dropped 5.6%, the Dow Jones Transportations (DJT) were hit hard, off 8.0%, and the technology-laden NASDAQ came off best, losing only 2.3% while having made new all-time highs. The small cap S&P 600 fell 9.7% and is now down 20.4% on the year. Bear markets continue. Give your head a shake that we were about to embark on a new secular bull market. Elsewhere, the TSX Composite was off 3.8% but the gold miner laden TSX Venture Exchange (CDNX) was down only 0.4%. In the EU, the London FTSE lost 5.0%, the German DAX dropped 6.9%, and the Paris CAC 40 was down 6.9%. In Asia, the Shangahi Index (SSEC) was a relative star, down 0.4% while the Tokyo Nikkei Dow (TKN) was off 1.0%. The MSCI World Index was down 4.3%. Maybe the fact that Asia seems to have the COVID-19 under control compared to the Western nations and their economies are opening up more had something to do with their relative outperformance.
We suppose we could say that the speech from Fed Chair Jerome Powell was unusually dour. Normally, even in Fed speak they try to remain somewhat upbeat. For the Fed then this was a bearish speech. Really, does anyone want the Fed to come out and tell everyone that the stock market is going to go to hell in a hand basket? Probably not. Nuance is their game. Generally though, Powell has not sounded upbeat in some time. This is the first stock market collapse and recession not caused by the Fed tightening conditions through higher interest rates since the big oil shock collapse in 1973. One other thing that Powell surprised us with was a statement about inequality. Although we confess it was an odd statement.
“Inequality has been something that’s been increasingly with us for four decades and it’s not really related to monetary policy.”—Jerome Powell, Chair of the Federal Reserve, June 10, 2020
Well, we hate to break the news to Mr. Powell but the monetary policy of the Federal Reserve with ultra-low interest rates and trillions in liquidity has been a direct boost to the incomes and wealth of the 1% compared to the rest of the population. The Fed has enriched the wealthy. And we saw that in spades during the March/June rally as the stock market (Wall Street) soared while Main Street wallowed in unemployment and riots.
As well, the surge in cases of the COVID-19 shouldn’t have been a surprise as the experts warned about COVID-19 having ongoing waves. As to warmer weather, well, someone should note that Brazil is in the tropics, yet they have now moved solidly into second place in the COVID-19 cup with over 800,000 cases. No surprise there, given that comments from their President Bolsonaro dismissed COVID-19 as a “little flu.” Maybe it was no surprise that authoritarian leaders elsewhere also embraced a derisive attitude toward the COVID-19 and their cases soared.
The market, no doubt, was poised to drop. Over the past few weeks the market had moved from being a rebound to soaring into the “what is going on” stratosphere. And it has been a very uneven rally. The NASDAQ soared to new all-time highs, peaking out at 10,000. As to most of the others, well, all they did is make it back to the 200-day MA or slightly above an area where most bear market rallies retrace to die. And the rally was led primarily by the FAANGs and Microsoft, some of who made all time highs and others who came very close. All are up on the year, even as the broader indices are down on the year.
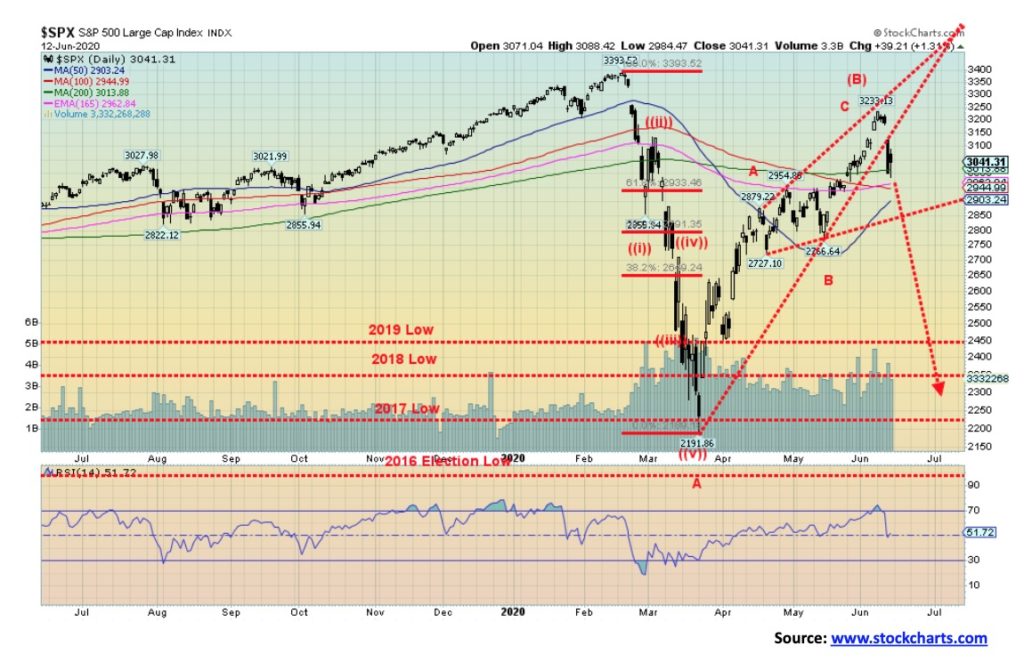
One thing stood out. All to some degree or other left what appear to be island reversals on the charts. On June 5, the S&P 500 and other indices gapped higher. For four consecutive days they traded up there with no attempt to fill the gap. Then on Thursday, June 11 the S&P 500 gapped down, leaving the four days all alone above. The gap is between 3,130 and 3,165. On Thursday, the market opened at 3,123 and never looked back. Those four days are liable to sit up there for some time. An island reversal is actually made up of two types of gaps—first, an exhaustation gap (June 5), and then the breakaway gap (June 11). It usually indicates a trend reversal of some significance and magnitude. Unless that gap is filled, the next major move is down.
Confirmation will come on a breakdown under first 2,850 and then under 2,765, the last significant low seen on May 14. As well, the S&P 500 appears to be breaking down from an ascending wedge pattern. If that’s correct, that suggests the S&P 500 could fall back to the March lows. To quip the old boy scout motto, “be prepared.”
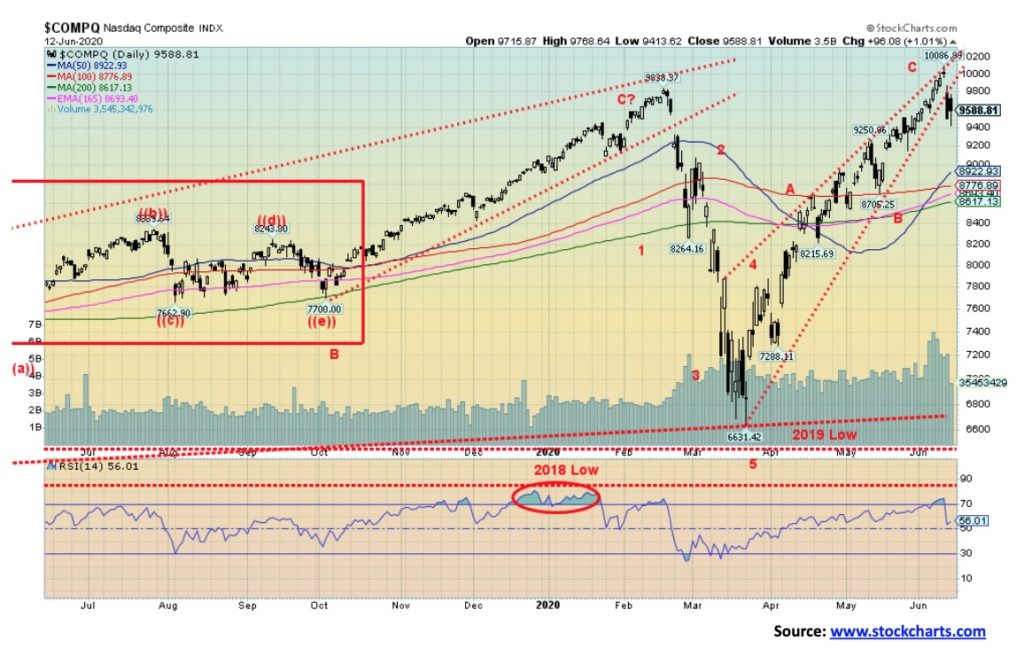
It was, we suppose, a lonely walk—or is it a climb—for the NASDAQ that made new all-time highs this past week. It was the only index to do so, diverging with the other major indices. Possibly the ulimate non-confirmation. As well, the NASDAQ put in an outside reversal week, closing lower. We call that a key reversal week because the NASDAQ made new all-time highs and a higher high and a higher low than the previous week, with a lower close. Although the close did not close below the low of the previous week which would have completed the key reversal week. Most reversal days or weeks are merely temporary pauses within the trend. But a key reversal week is rarely seen accompanied as it was with new all-time highs. Like the island reversal, this could prove to be significant and should not be easily dismissed. We could even wind up with a key reversal month if the NASDAQ were to continue falling and close on June 30 under 8,537. We note the 200-day MA for the NASDAQ is down at 8,617 and we are sure that will act as a magnet. The NASDAQ also formed what appears as an ascending wedge pattern. It suggests that, once broken, the NASDAQ could return to its March lows. Major support is seen at 6,700.
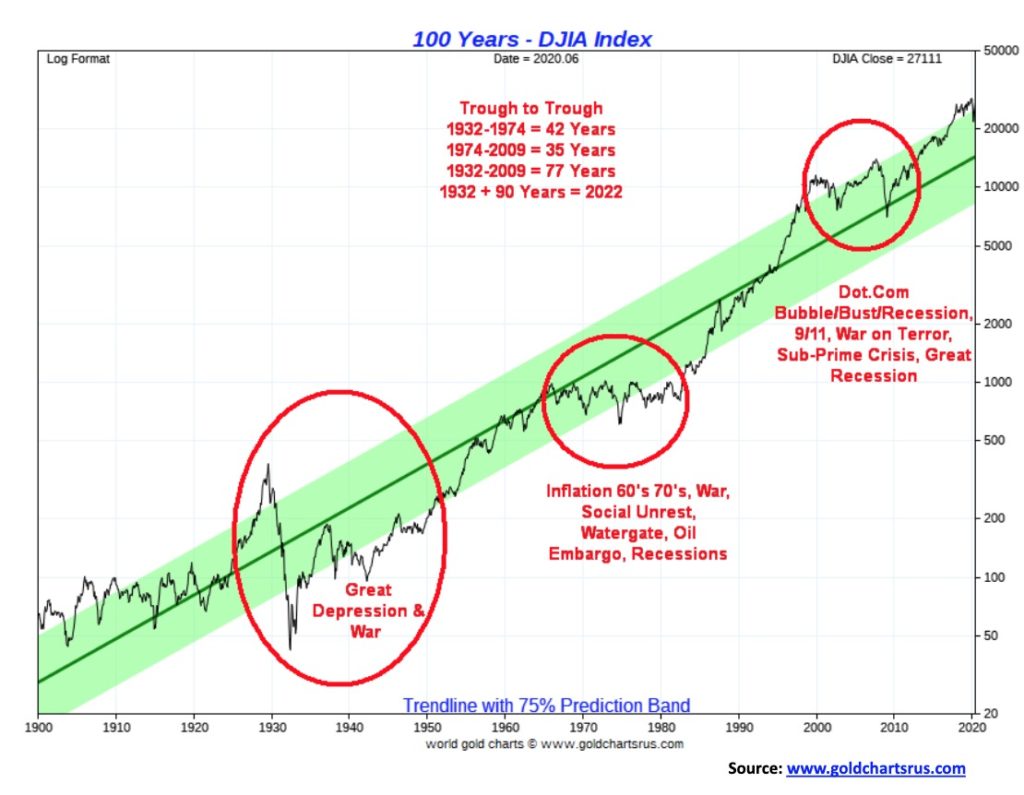
Here is a 120-year picture of the Dow Jones Industrials (DJI). Yes, it has been on a steady climb. This is not an inflation-adjusted chart. On a nominal basis, the DJI has gone up almost 600 times from the depths of the Great Depression. But on an inflation-adjusted basis the gain is only 25 times. Quite a difference. On an inflation-adjusted basis the DJI fell back, almost to where it was in 1949 during the long period of recessions 1966-1982 that culminated in the final trough in 1982. The trough of the 2009 bottom was just above the highs of 1966 on an inflation-adjusted basis.
Using the 75% prediction band, one sees there are periods where it overshoots (1929, 2000, 2007, 2018–2019) and periods where it undershoots (1932, 1942, 1949, 1974, 1980–1982). During the last major secular bear from 2000–2009, the DJI never undershot the band. It did, however, test the center line, dipping briefly under that level. That tells us that there was no period during that bear market where stocks became extremely oversold as they did during 1929–1949 and 1966–1982.
We highlight the three secular bear markets seen over the past 120 years. The 1929–1949 period was made up of three significant recessions/depressions: 1929–1933, 1937–1938 (although one could argue it stretched into 1942), and 1948–1949. The period 1966–1982 was also made up of three recessions: 1969–1970, 1973–1975, and 1980–1982. As we know, the 2000–2009 period saw only two recessions: 2001–2002 and 2007–2009. Given the 11-year period of expansion, albeit feeble, seen from 2009 to 2020 we can only note that, yes, there were some slowdown periods in 2010–2011 and 2015–2016 but they never became official recessions. The COVID-19 pandemic recession got underway in February 2020. While some pundits are declaring it over, given that unemployment and economic activity is going to remain depressed for some time it may be premature in calling the recession over.
We have often noted long-term cycles. These cycles are measured in terms of stock market troughs, from trough to trough. The 75-year cycle bottomed in 2009, being 77 years from the 1932 Great Depression low. The half-cycle is 37.5 years but it can range in theory from 26 to 44 years. The 1974 low came 42 years after the 1932 trough while the 2009 trough was 35 years after the 1974 low. Subdividing into the 37.5-year cycle is the 18.75-year cycle range from 13–22 years. On that basis, we saw a trough in 1932, 1949 (17 years), 1974 (25 years, but given a trough in 1970 it was more like a series of troughs), 1987 (13 years, but if you add 1974 and 1987 years it equals 38 years in total or half 19 years), and the last one 2009 (22 years). That makes the next 18.75-year cycle due somewhere between 2022–2031.
We have previously noted the possibility of a 90-year cycle. If that is the case, we are right in the middle of it, dating from the Great Depression trough 1932 + 90 = 2022. Depressions seem to follow the 90-year cycle, as we have observed major stock troughs and economic depressions going way back to 1555 (although that trough bounced around for the next 40 years before starting to rise in the 17th century). From 1555 the next major trough was seen in 1672 (117 years although, as we note, 1555 may have been the low but it kept testing that level for upwards of 40 years). 1672 was in the midst of what was known as the disaster years as the Western world (Europe) was plagued with wars, pandemics, famines during the period known as the “little ice age.” The next trough was seen in 1761, but stock market collapses lingered into the 1780s. Once again, wars (Seven Years War) and revolutions (American and French) predominated. The next one was seen in 1842 following the collapse of a speculative boom into 1837. Wars dominated once more and the effects of the depression lingered on past the American Civil War through the period known as the Long Depression (1873–1879) followed by the Gilded Age in the 1880s and then another depression in the 1890s. The next major trough was 1932, exactly 90 years after the stock market trough and depression of 1842. What will this one bring? And for how long? Given the massive debt levels and the speculative boom that has preceded this, a reckoning is overdue.
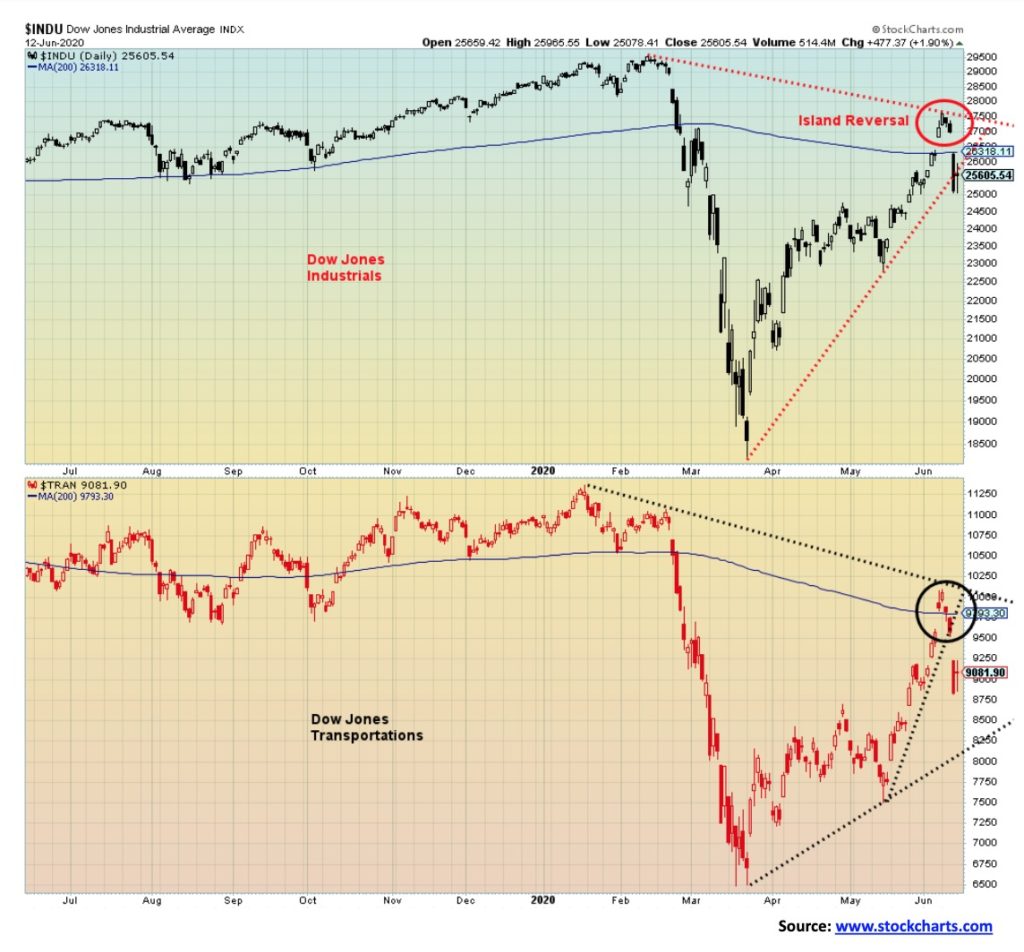
Here is a picture of the Dow Jones Industrials (DJI) and Dow Jones Transportations (DJT). Both of them gapped down on Thursday. The DJI left a very visible island reversal on the charts. The island reversal on the DJT is not as clear, but the DJT did gap up on June 5 and then gapped down on June 11, leaving a somewhat awkward-looking island on the charts. Did the DJI and DJT confirm each other on this last move? Yes, they did as both made highs roughly together, although the DJI did manage to at least briefly clear the 200-day MA while the DJT barely made it past the 200-day MA. But that is not significant. What we do know is that the DJT made an all-time high back in September 2018. It never exceeded it again. The DJI went on to make a series of new all-time highs, culminating in a possible final high in February 2020. That divergence between the DJI and the DJT was one we noted with regularity as a possible sign that the market was in the process of making a significant top. So far, Dow Theory works and both the DJI and the DJT collapsed into March 2020. Given no current divergences, the indices are confirming each other. Bottoms are difficult to read because we don’t often see a major divergence between the two at final lows. Both were, for example, making new lows together in March 2009.
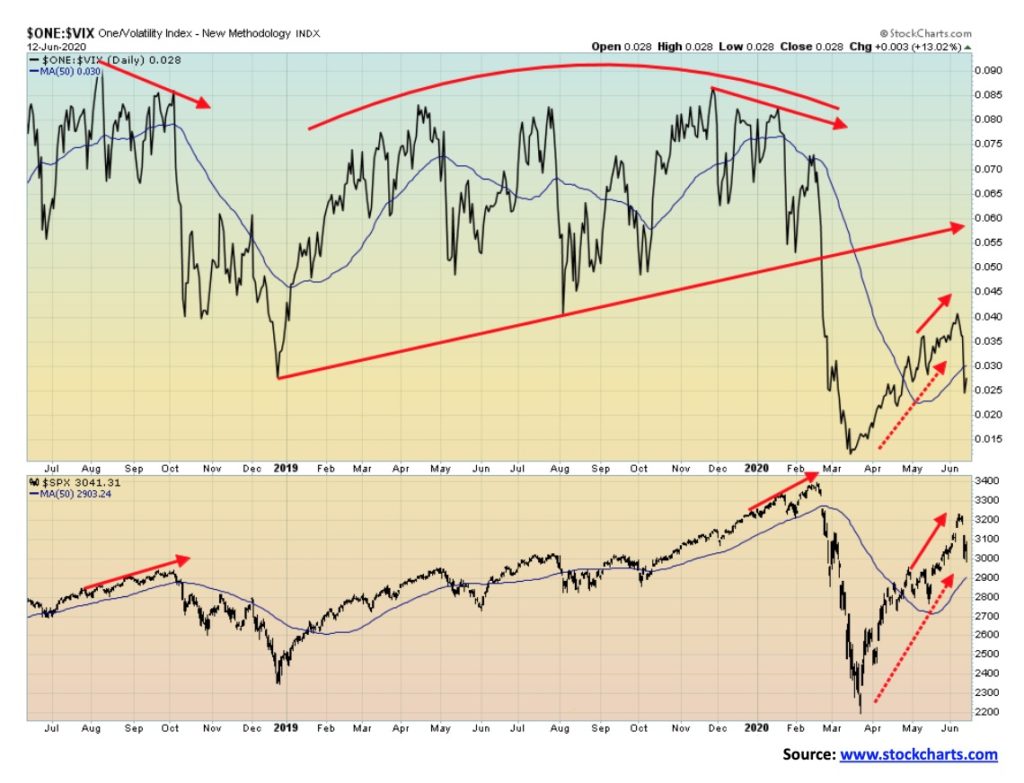
There were no divergences between the VIX Volatility Indicator and the S&P 500 at the recent high. But it is no surprise that the inverted VIX plunged, along with the S&P 500, this past week. The VIX broke under its 50-day MA while the S&P 500 is still above that key MA. The S&P 500 breaks down under 2,900. There were no divergences at the March bottom, either. Normally we only see these divergences at significant tops and bottoms. Given the two are confirming each other, we expect the two to continue to follow each other up and down. The VIX is shifting down and the S&P 500 should follow.
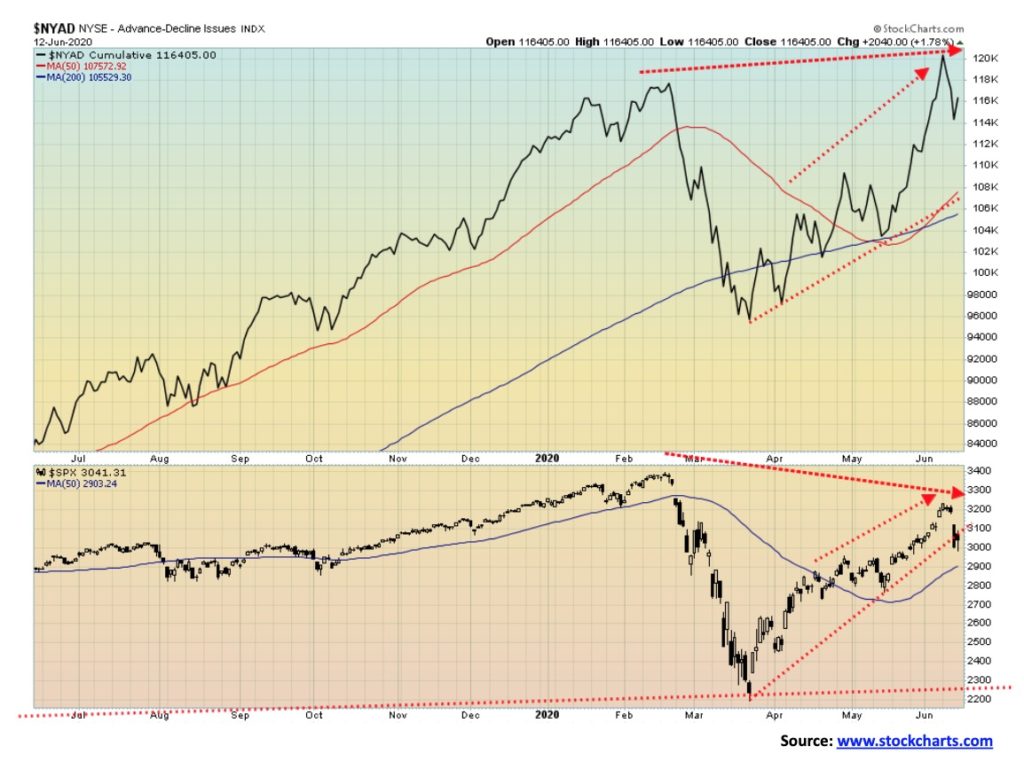
This is the bulls’ favourite. The NYSE advance-decline line came down with the S&P 500 this past week. A divergence occurred when the AD line made new all-time highs but the S&P 500 did not. Usually it is the other way around, but then we have found the AD line to be somewhat misleading of late, given there were no divergences at the recent highs that played themselves out in January/February 2020. Before that, it wasn’t unusual to find the S&P 500 making new highs while the AD line was not. That collapse in March saw no prior divergences between the two. That has led us to conclude the AD line was misleading us, giving us the illusion that all was well. It wasn’t. And now it has given us a similar illusion with the AD line making new all-time highs while the S&P 500 is not.
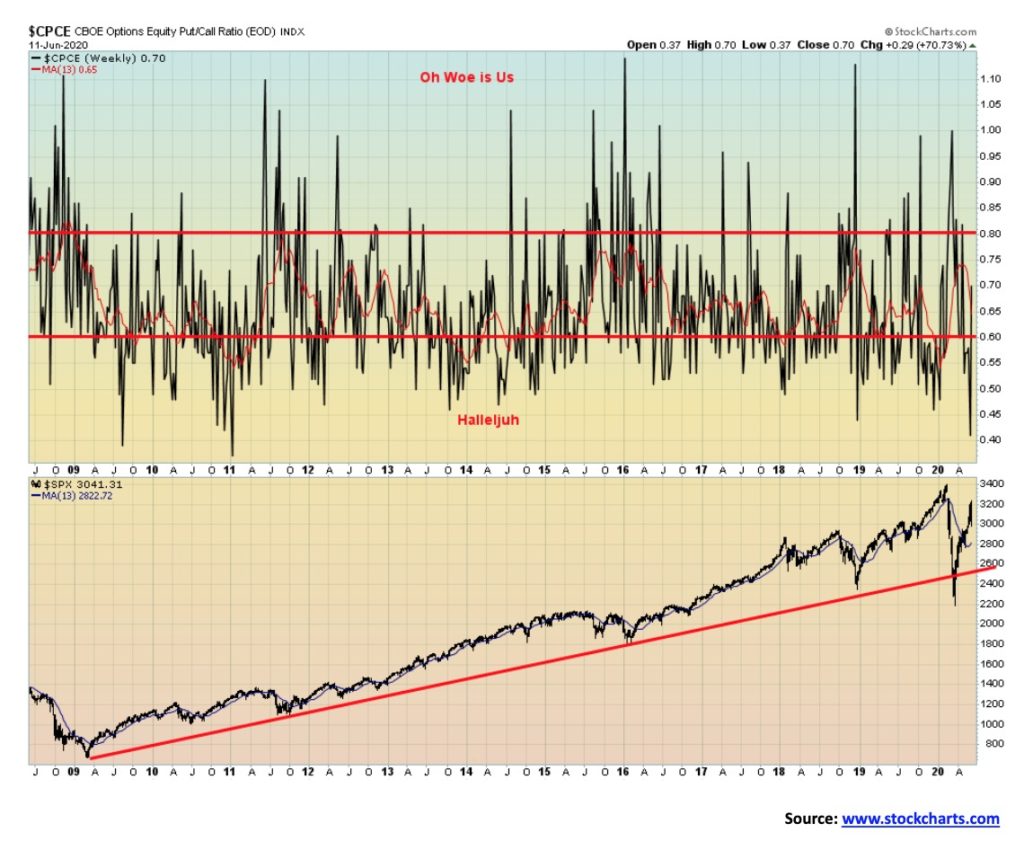
It was probably no surprise that the put/call ratio improved this past week to 0.7, up from about 0.4 the previous week. The collapse on Thursday brought in a flurry of put buying. But the put/call ratio is not at a level that would suggest a low is at hand. We are in neutral territory and not in the “oh, woe is us” territory where puts outnumber calls. Probably by next week the put/call ratio could be over 0.8. But it is not necessarily a sign that low is in, merely a sign that one should be a bit cautious about shorting further, or maybe a sign to start nibbling at some buys.
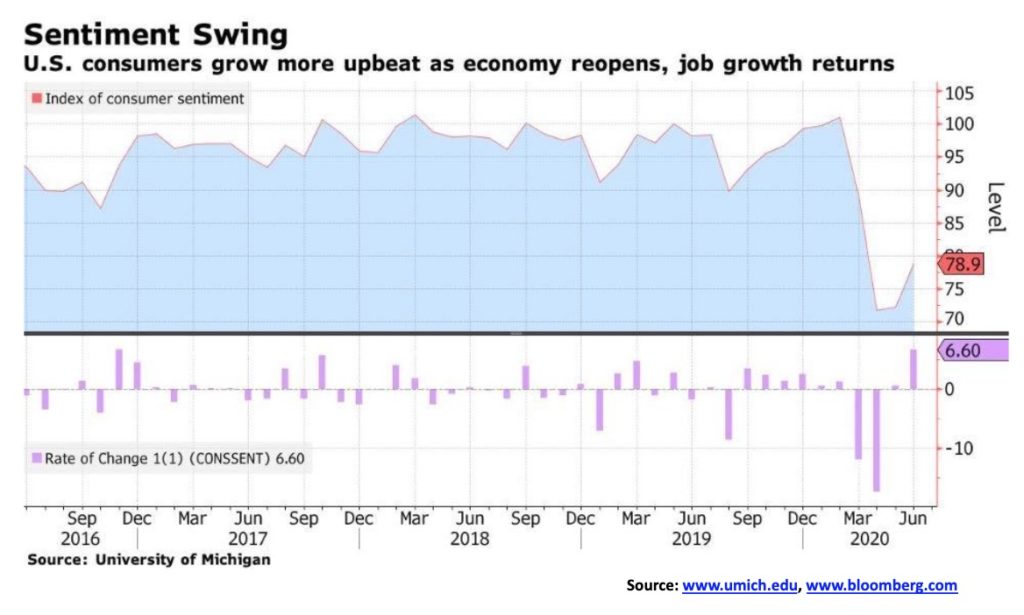
The recession is over. The consumer is feeling better. The University of Michigan Sentiment Indicator improved to 78.9 in June 2020 from 72.3 in May 2020. It was above market expectations of 75. But that remains a far cry from the 90–100 that was seen from 2014 to February 2020. In February the index was at 101. The collapse took us back to levels last seen in 2012/2013. A major trough was seen in 2008/2009. Yes, it has improved, but we keep wondering what is going to happen when the employment subsidies run out and the job market is only grudgingly improving. Most pundits note that the U.S. wage subsidy program and the one in Canada called CERB will need to be extended. Most businesses are going to have trouble re-opening, especially in the hospitality industry where hundreds of thousands worked. The forced closing of businesses may have started as a supply shock but is going to transfer into a demand shock as the consumer returns reluctantly. Consumer confidence has been hurt, purchasing power curtailed, and debt loads are becoming unmanageable. Consumers have deferred purchases and will be slow to pick up again, while travel will be restricted. When the regimen is one of physical distancing, hand sanitizing, and use of masks, enthusiasm for buying will be sluggish at best. Yes, there will be an initial surge which we may already be seeing. But getting the consumer confidence index back to 100 will take a while. And before that happens, things may get worse before they get better on any consistent basis.
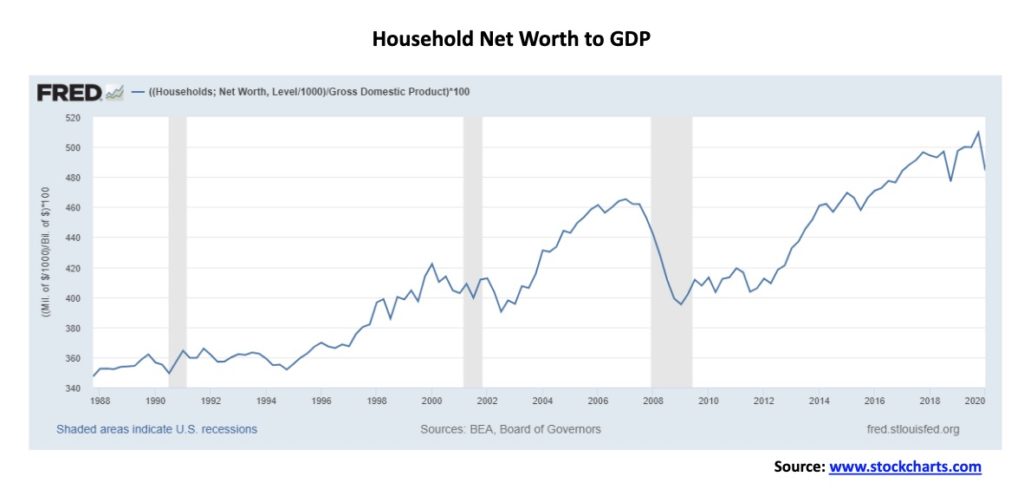
Household net worth took a $6 trillion hit through the March collapse. At the end of Q1, the net worth/GDP had fallen to 484%, down from a peak of 510%, a decline of 5%. During the 2007–2009 recession the net worth/GDP ratio fell 15%. There are various reasons why it doesn’t necessarily match up with the fall in the stock market as net worth encompasses all assets for everyone. Although it would be fair to hazard a guess that most people’s retirement portfolios are probably lower today than they were at the end of 2019—unless you owned nothing but the FAANGs. Still, the net worth/GDP ratio was lower at the end of 2018 than in Q1 2020. Household debt to GDP in the U.S. stands at 76%. In Canada, it is over 100% as on a per capita basis as Canadians are more indebted than their U.S. counterparts. Canada’s household debt to GDP is as bad today as the U.S.’s was in 2007 before the financial crisis. As net worth/GDP falls, consumer confidence falls with it and is another reason why any recovery will be sluggish at best.
It was poor week for the TSX as well. The TSX fell 3.8% this past week. The TSX outperformed the S&P 500, the DJI, and, the DJT. Only the NASDAQ did better. So, it was no surprise to see that of the 14 sub-indices 12 were down on the week. The two winners were Golds (TGD), up 1.9% and Metals & Mining (TGM) which gained a small 0.1%. Those two remain amongst our favourite sectors. The others are Materials, Information Technology, and Consumer Staples. Leading the way to the downside was Energy (TEN), falling a sharp 12.8% as the bloom came off the oil rally and natural gas (NG) remained depressed. Others that saw losses of 4% or more were Income Trusts (TCM), off 4.1%, Financials (TFS), down 4.4%, Industrials (TIN), dropping 4.0%, and Utilities (TUT), down 4.8%. Note that three of those sub-indices are income-producing sectors. The best performers, meaning the least losers, were Materials (TMT) effectively flat, off a tiny 0.03% and Consumer Staples (TCS), down 0.2%. Information Technology (TTK) also kept its loss low, down 0.6%.
The junior TSX Venture Exchange (CDNX) also enjoyed a relatively good week, keeping its loss low, off 0.4%. We continue to see good buying in the junior mining sector. Junior miners make up more than 50% of the CDNX. We believe a significant rally in the junior mining sector is still underway, although the CDNX has now reached a resistance point in the 550/600 zone. A firm break above 600 for the CDNX could send it to the next major resistance zone near 1,000, an 80% move from current levels. However, the pause here should not have been a surprise, given the CDNX is up 68% from its March low, making it one of the best-performing indices in the world since the COVID-19 crash low. There is some reason to cautious as these levels for the CDNX as the test of resistance could turn into a failure. We believe we will eventually break through above 600 but we may see some further backing and filling before that happens.
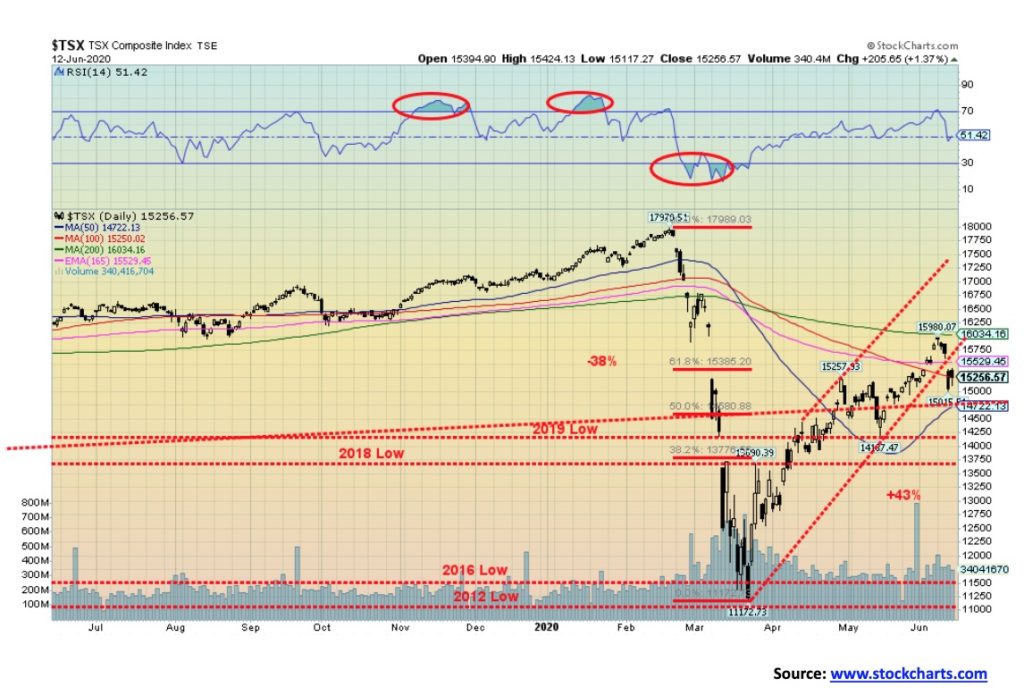
Note the TSX has failed at the 200-day MA (16,035) The high was at 15,980. Like the U.S. indices, the TSX gapped lower on Thursday, leaving behind what appears as an island reversal. As with the U.S. indices we suspect a top is in. Confirmation would come with a break below 14,190, the last significant low on the daily and weekly charts. The TSX would have to fall below 12,300 to suggest a major test of the March lows or even new lows.
The TSX has, we believe, started a new downtrend. Safety will be found in the five sectors we noted.
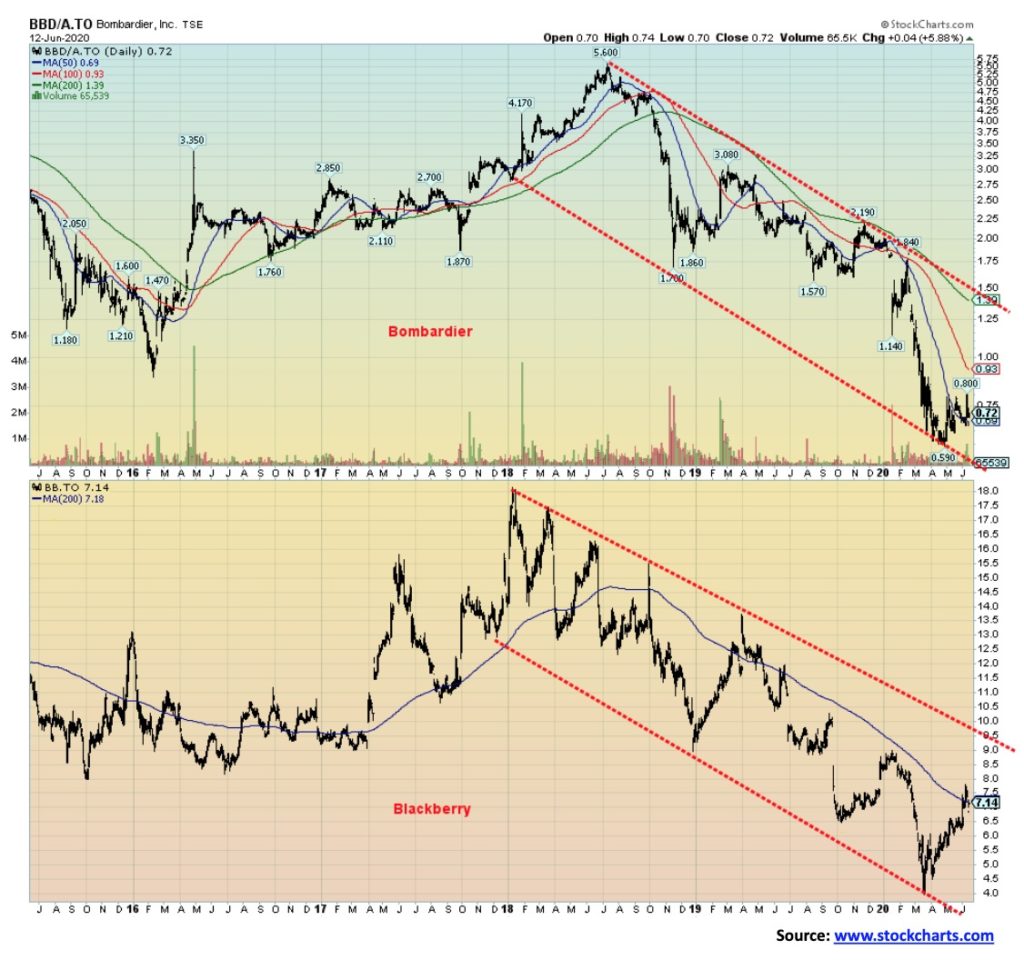
Oh, how the mighty have fallen, with two Canadian icons on their way out: Bombardier (BBD.A/T) and BlackBerry (BB/T). Maybe it should be a lesson on how not to succeed. These two Canadian icons must know they are on their way to the bottom when they have been removed from the TSX 60 the index for the bluest of blue-chip companies in Canada. It was so bad for Bombardier that they were removed not only from the TSX 60 but also from the TSX Composite. Bombardier is just another penny stock. Bombardier has fallen 87% from that top in July 2018. For BlackBerry, they are down 61% from the high in January 2018. Worse—their all-time high was in 2008 when they were the darling of Bay Street and everyone owned a BlackBerry. They topped out near $150. So, make that down 95% from the high. The past few months have been kind to them and they jumped 98% from that March 2020 low. But BB has now come to the 200-day MA and appears to be rolling over. As to BBD.A, well, they could just disappear, joining many other companies such Sears, Stelco, Nortel, Eatons, Olympia & York, Confederation Life Insurance, Steinberg’s, and others that went the way of the dodo bird. The message may have been: even if you’re the smartest guy in the room, you’re never too big or too smart to fail! Ask Nortel. These stocks are for punters/speculators only.
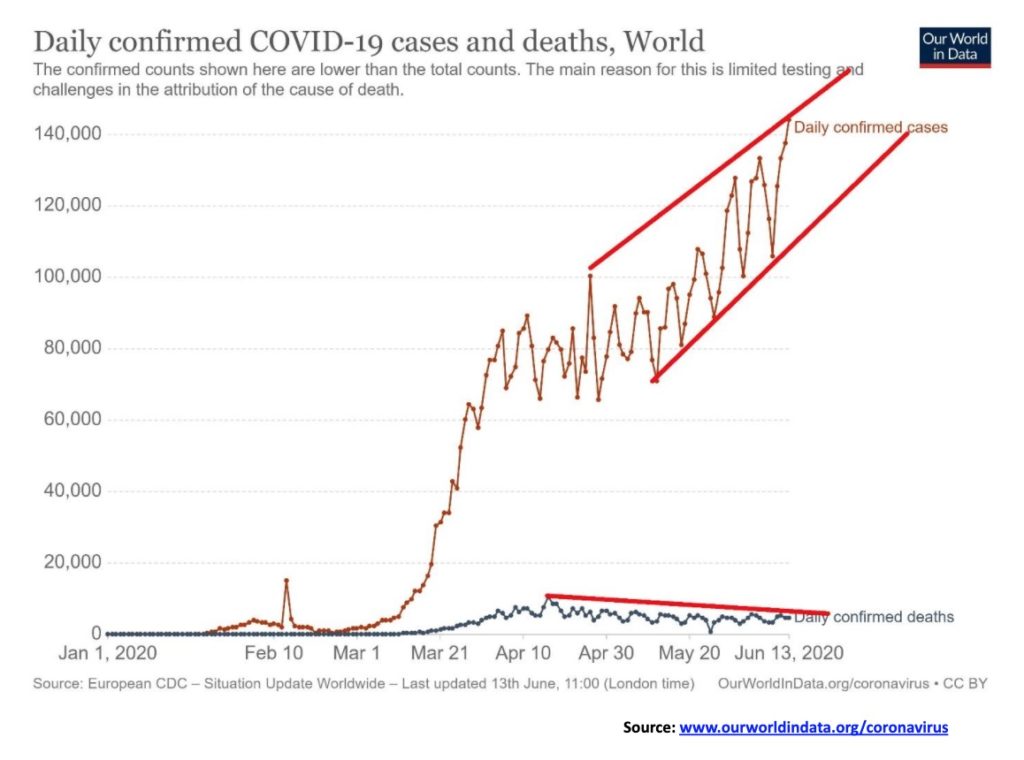
The number of cases on a global basis keeps on rising. The number of daily cases is now working out to around 120,000. At this pace we could be see upwards of 32,000,000 cases by year end along with 1,300,000 deaths. The big surges are being seen in Brazil, India, Pakistan, Bangladesh and Saudi Arabia while cases remain elevated in the U.S. and Russia although subsiding in the euro zone and Canada. Cases in Asia have consistently remained well below the levels seen in the west as they control it though strict contact and tracing, quick quarantines, and masks. Otherwise life in Asian countries with the odd exceptions like South Asia remains pretty normal.
Sunday June 14, 14:44 GMT
Cases: 7,911,909
Deaths: 433,158
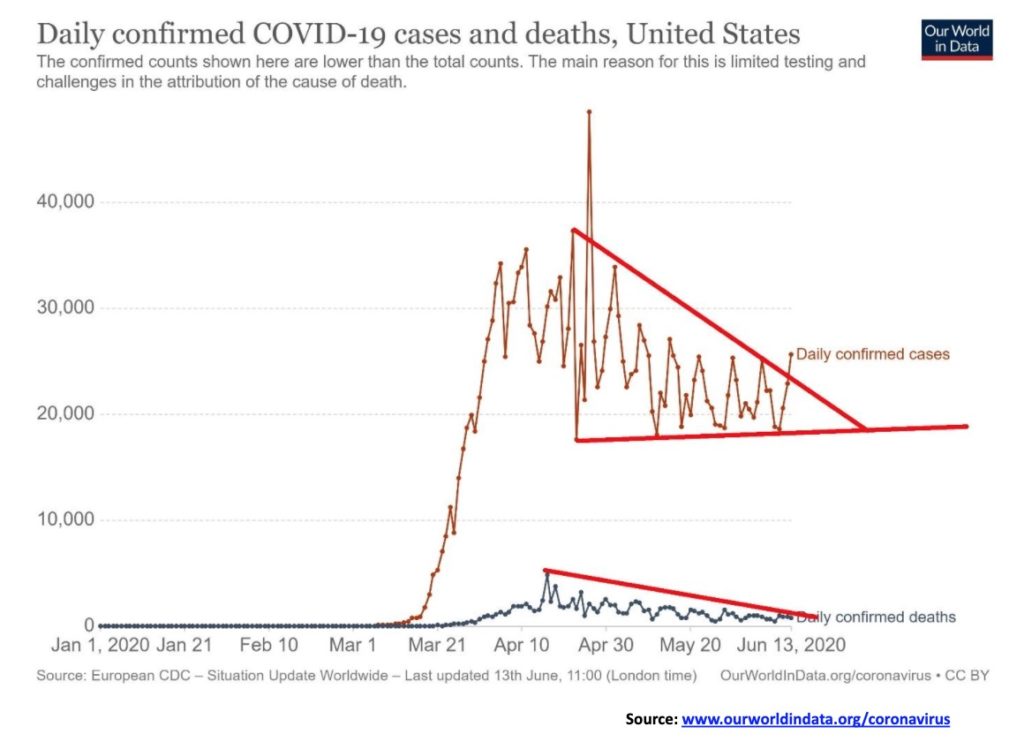
Could the U.S. be seeing a rise in cases? As the number of cases and deaths subsides in the North East i.e. New York, New Jersey the number of cases is rising in states that insisted on opening too soon and did not enforce the lockdowns as say New York did. The result is that the number of cases could be rising in the U.S. appearing to be breaking out of the triangle that formed over the past several weeks. Number of deaths, however, appears to be staying on a slightly downward trajectory.
Sunday June 14, 14:44 GMT
Cases: 2,143,648
Deaths: 117,555
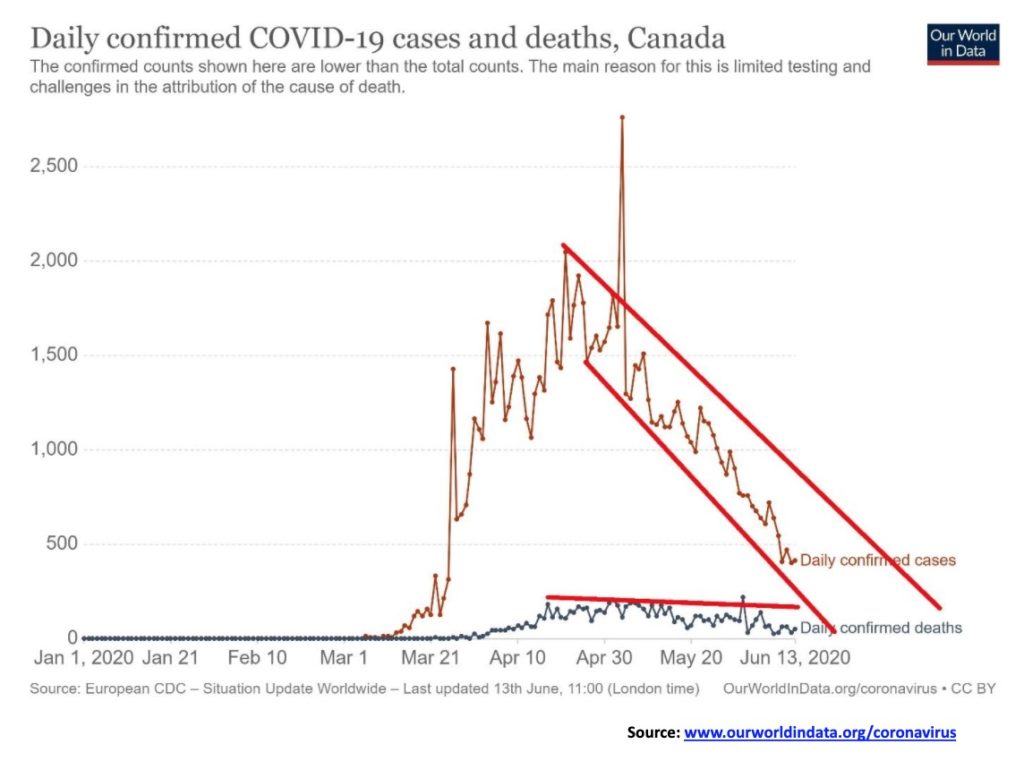
Down, down, down we go. Canada appears to have the COVID-19 under control as the number of cases, and deaths, continue to fall. For Canada that’s great. Not so great as we note to the country below us. We can only guess that the border no doubt will remain closed.
Sunday June 14, 14:44 GMT
Cases: 98,410
Deaths: 8,107
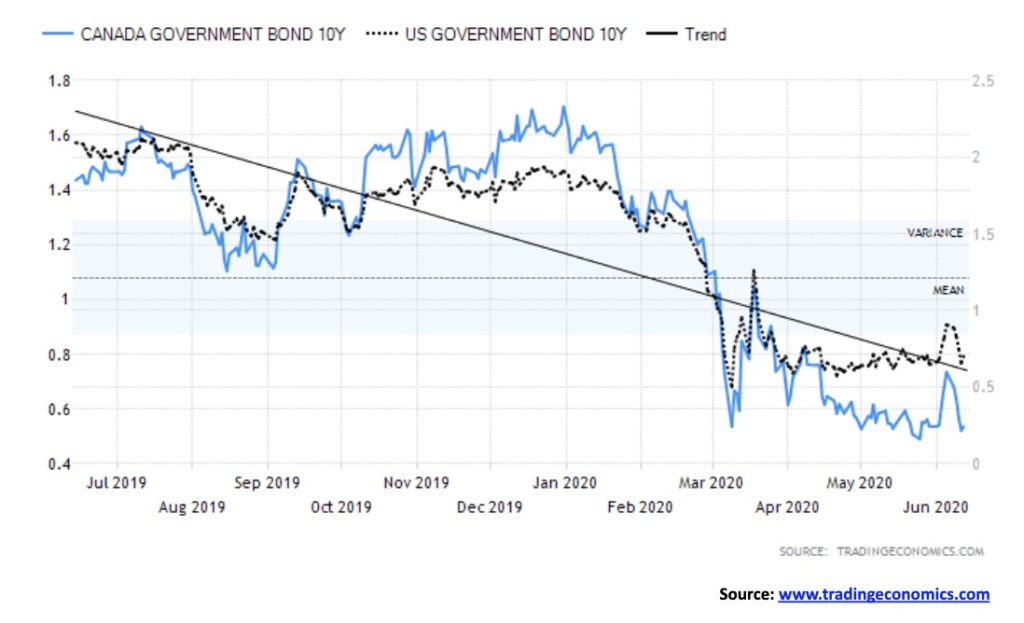
Following the stronger than expected job numbers, bond yields rose. That was all reversed this past week with the sudden mini-collapse in the stock market. The U.S. 10-year treasury bond yield fell back to 0.71% from 0.91% and the Canadian Government of Canada 10-year bond fell to 0.52% from 0.69%. Whenever the stock market falls like this, there is a rush into bonds as a safe haven, regardless of the low yield. We have little expectation of seeing much higher yields, especially as the Fed has committed to near-zero interest rates into 2022. Probably the yield curve will continue to widen, but we are not expecting a huge jump in longer yields. Issuers are so confident we have seen a surge in issuing bonds with maturities of 100 years. Crazy, as remember someone is buying them. But there is little reason for bond yields to rise too much given low inflation, Fed bond-buying programs, and the ongoing deliberate suppression of interest rates. After all, governments with huge borrowings can ill-afford high interest rates, so the central banks will do what they have to do to keep rates low.
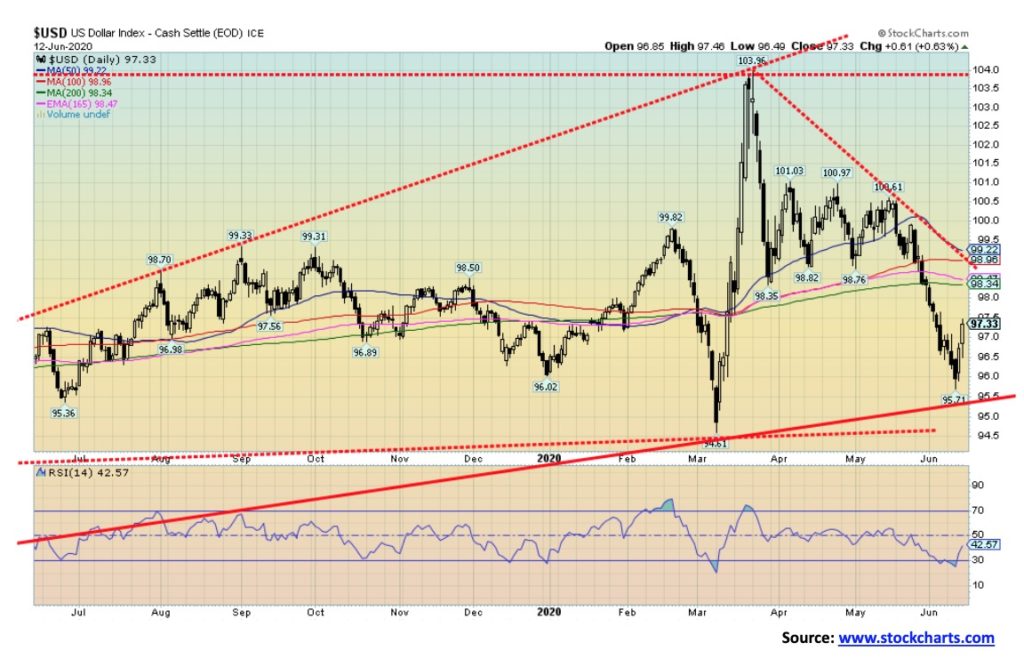
After plunging down to a support line near 95.30, the US$ Index reversed and closed higher on the week, gaining a small 0.4%. The euro fell 0.2% but the Swiss franc continued to exhibit strength, gaining 1.1%. The pound sterling lost 1.1% but the Japanese yen was up 2.1%. The Canadian dollar lost flight, thanks to the drop in oil prices and was off 1.3%. The Japanese yen was up, probably because it is a country with a much lower rate of COVID-19 than the U.S. and the eurozone. Switzerland’s number of COVID-19 cases is also relatively lower compared to the surrounding eurozone so that may be helping. The week does qualify as a reversal for the US$ Index, given a lower low and a slightly higher close. But it wasn’t an outside reversal week. Follow-through to the upside will be important this week. A return to test the 200-day MA near 98.35 would not be a surprise. The current downtrend line is way up near 99. We are not expecting that any time soon. Helping the U.S. dollar rebound was the fact that bullish sentiment had reached levels not seen since March. The RSI had slipped under 30, indicating it was oversold and potentially due for a rebound. A rising US$ Index could weigh on gold.
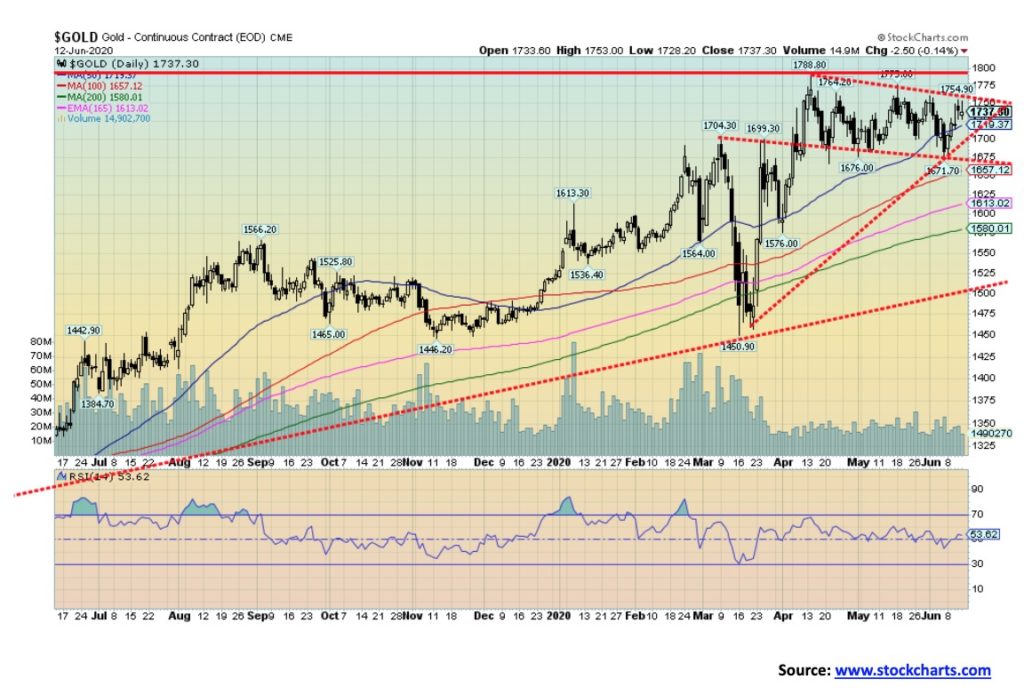
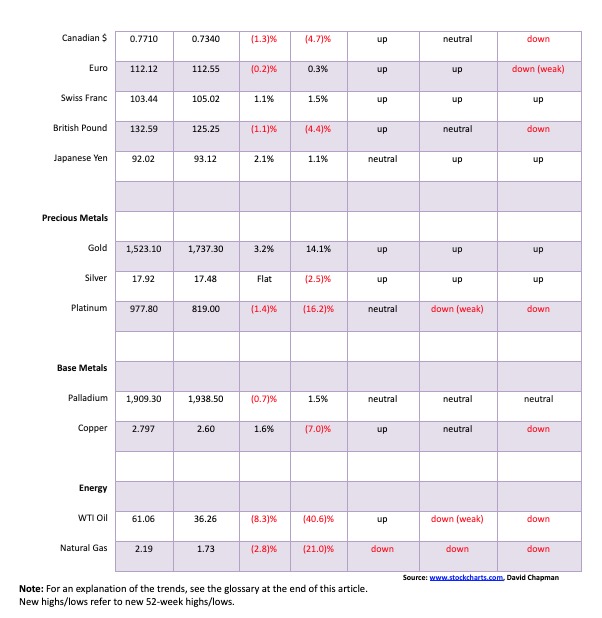
Gold continues its current corrective period, even as we gained 3.2% on the week. The big stock market collapse on Thursday was positive for gold as it rose, although in the end the gain was muted. Friday saw a pullback. Gold continues in what looks like a down-sloping channel. It could be a descending triangle and, if so, a breakdown under $1,675 could project down to $1,560. We note the 200-day MA is currently at $1,580 so a test of the 200-day MA is not out of the question or unusual. Gold’s last major low was seen on March 16, 2020. We believe that the March 16 low was an important cycle low and we are now in an up-phase. The next significant low shouldn’t be seen until sometime in 2021. We note that there is lot of geocosmic activity over the next few weeks with a solar eclipse on June 21 and a partial lunar eclipse on July 4/5. Any one of these periods could prove to be a low for gold. Irrespective of this, we expect any low for gold to be in by mid-July and we should then begin another strong upward move. We need to clear $1,800 to suggest to us that we are on our way to our targets of $1,935/$1,950. Any move now over $1,760 should set us on our way to $1,800.
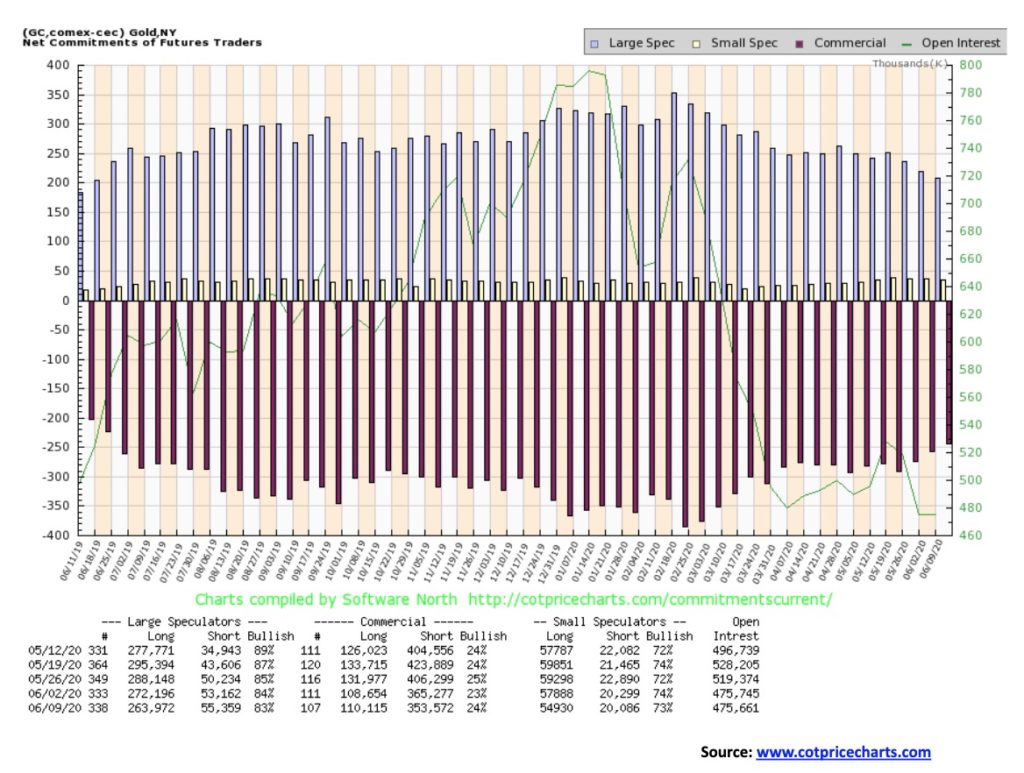
Could it be small but significant? The gold commercial COT improved to 24% this past week from 23%. Short open interest fell about 12,000 contracts, suggesting further short covering. And long open interest rose around 1,500 contracts. The large speculators COT (hedge funds, managed futures, etc.) slipped to 83% from 84% as they cut their long open interest by just over 8,000 contracts and raised their short open interest by roughly 2,000 contracts. Still bearish, but we are encouraged by the improvement.
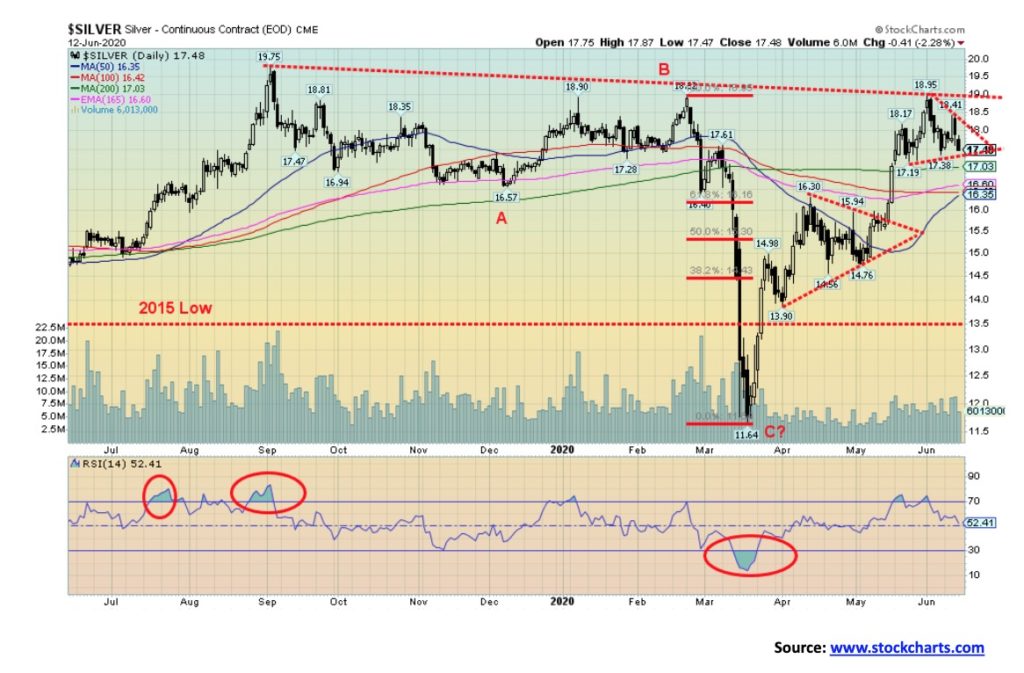
It was a flat week for silver as it rose early to a high of $18.41 and then plunged right back to close flat on the week at $17.48. We are of a couple of minds here. Silver could be forming a flag or pennant, or it could be forming a small head and shoulders top. The pennant breaks out above $18, but the reality is we need silver to break out over $19 to convince us that we are on our way to higher prices. If the H&S pattern is correct, then the breakdown is at $17.30 and could project down to $15.55. That would be a scary move, considering there is potential for strong interim support down to $16.35/$16.60. A normal Fibonacci retracement could take us down to $16.15. So, it all fits. We know we are going through a seasonal slump for both gold and silver so a decline to those levels would not surprise us. However, we do think that would be it. The RSI is not oversold enough here at 52. But it is at a level that could see prices turn up once again. If prices do turn up and we break out over $19 our next target would be $20, then up to the 2016 high of $21.23. The area near $20 is major resistance so a firm breakout over that level could, in theory, project up to almost $30. We remain long-term bullish on silver, but the short-term is still cloudy and vulnerable to pullbacks until we break above $18 and, better still, above $19.
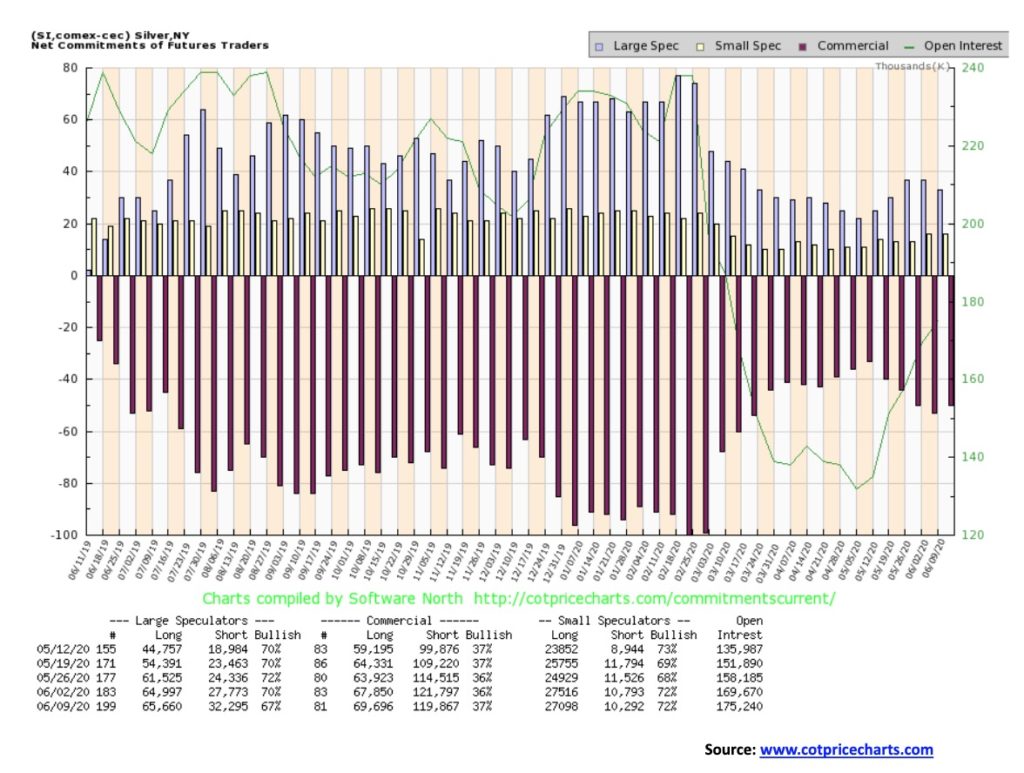
Like gold, the silver commercial COT also improved from 36% to 37%. Long open interest rose about 2,000 contracts while short open interest fell about 2,000 contracts. The large speculators COT fell to 67% from 70%. As with the gold COT, we are encouraged as the COT has become a little bit more bullish.
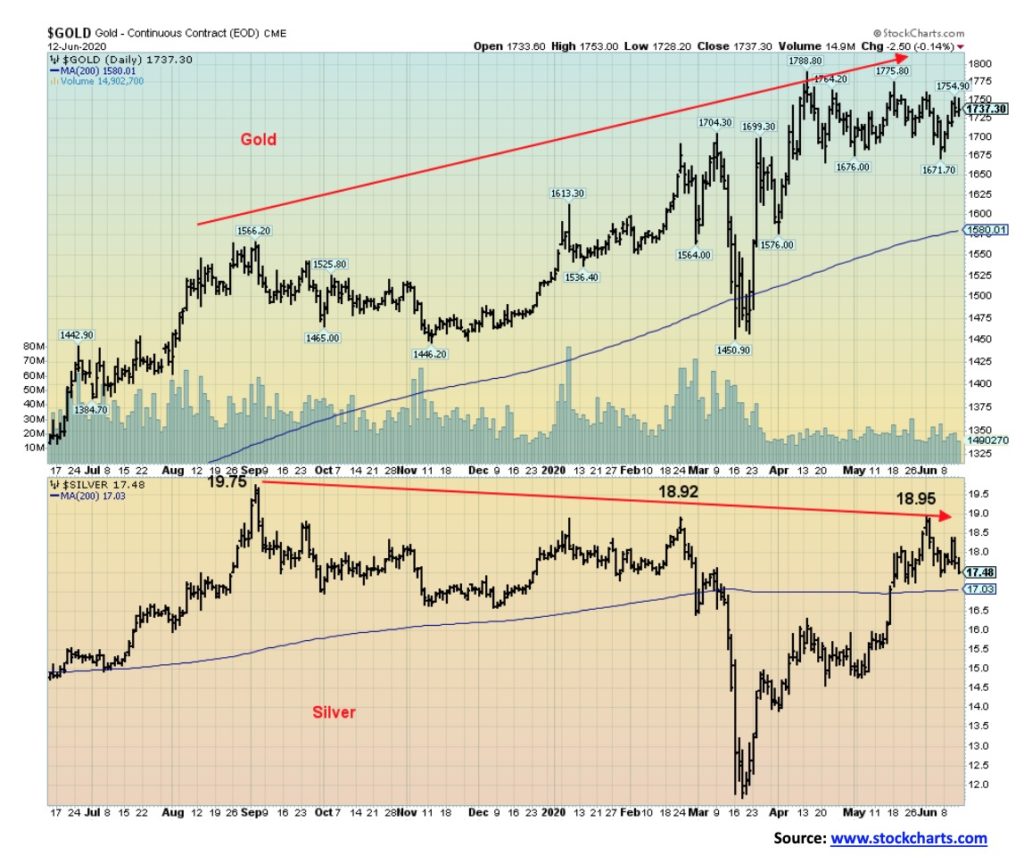
We freely admit this continues to bother us. Gold has been over the past year making higher highs. Silver has been making lower highs. As well, we note during the March COVID-19 crash silver made multi-year lows below even the 2015 low. Gold did not, not even coming close to its 2015 low of $1,045. At $17.48 silver is just 2.6% above its 200-day MA. Gold, on the other hand, is almost 10% above its 200-day MA. All of this translated into the highest gold/silver ratio ever seen. We view the record gold/silver ratio as bullish for the metals, but we do need silver to start leading rather than lagging as it as generally done over the past year. Going back in history, however, we note that gold and silver diverged in 2011 over a period of five months again with gold making new highs and silver not confirming. This also occurred in 1987 over a period of 8 months once again with gold making new highs and silver not confirming. So, this makes the current divergence a concern as in both 1987 and 2011 that proved to be tops for the precious metals. One difference is, however, the gold/silver ratio. In 1987 and again in 2011 the gold/silver ratio was making a low. This time the gold/silver ratio is making a high, not a low. So, we have a divergence within the presence of a divergence. Which is it? We continue to see prices as going higher but remain wary about this ongoing divergence between the two. Like the DJI and the DJT, we want the metals to confirm each other. They are not and that’s a concern.
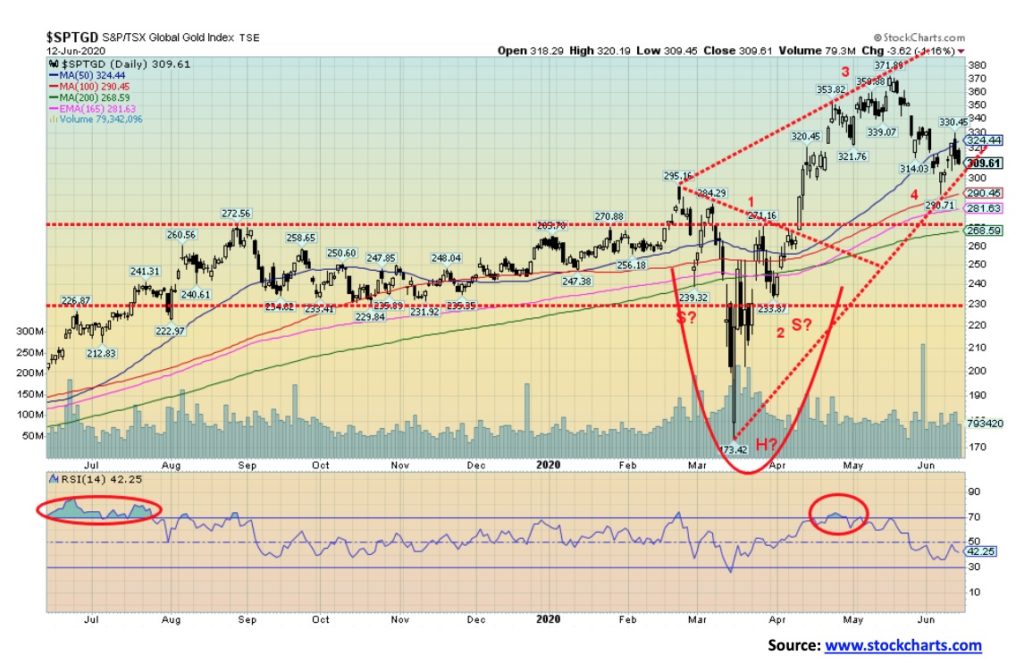
Gold stocks continue their corrective way even as the miners managed to eke out gains this past week. The Gold Bugs Index (HUI) was up a small 0.3% while the TSX Gold Index (TGD) rose 1.9%. Both made new lows for the current move down last Friday and then rallied this past week. The TGD closed up 6.5% off the lows. The TGD ran into resistance at the 50-day MA and failed to establish any value over that level. It poked as high as 330 before settling back and closing at 310. The 330/335 level is now resistance. Above that level the TGD could run up to 350. Above 355 new highs are probable. We still have unfullfiled targets up to 385. Bullish enthusiasm has come down and the Gold Miners Bullish Percent Index (BPGDM) has fallen to 69%, down from a high of 92%. That is more neutral territory, although we confess it does have room to move lower. In a bull market a decline to the 50% mark would probably be a good buying zone. To the downside, support is at 300 but below that a decline to 290 and then to 270 is quite possible. Only below 265 would be we consider the bull over and a bear officially underway. Gold stocks remain cheap compared to gold. The gold/HUI ratio is at 6.6, a level that is considered high. Levels over 5.5 tell us gold is expensive and the gold stocks cheap. Under 2.5 gold becomes cheap vs. the gold stocks. We last saw those levels in 2010/2011. This correction in the gold stocks could continue into month-end or even July before we see our final low.
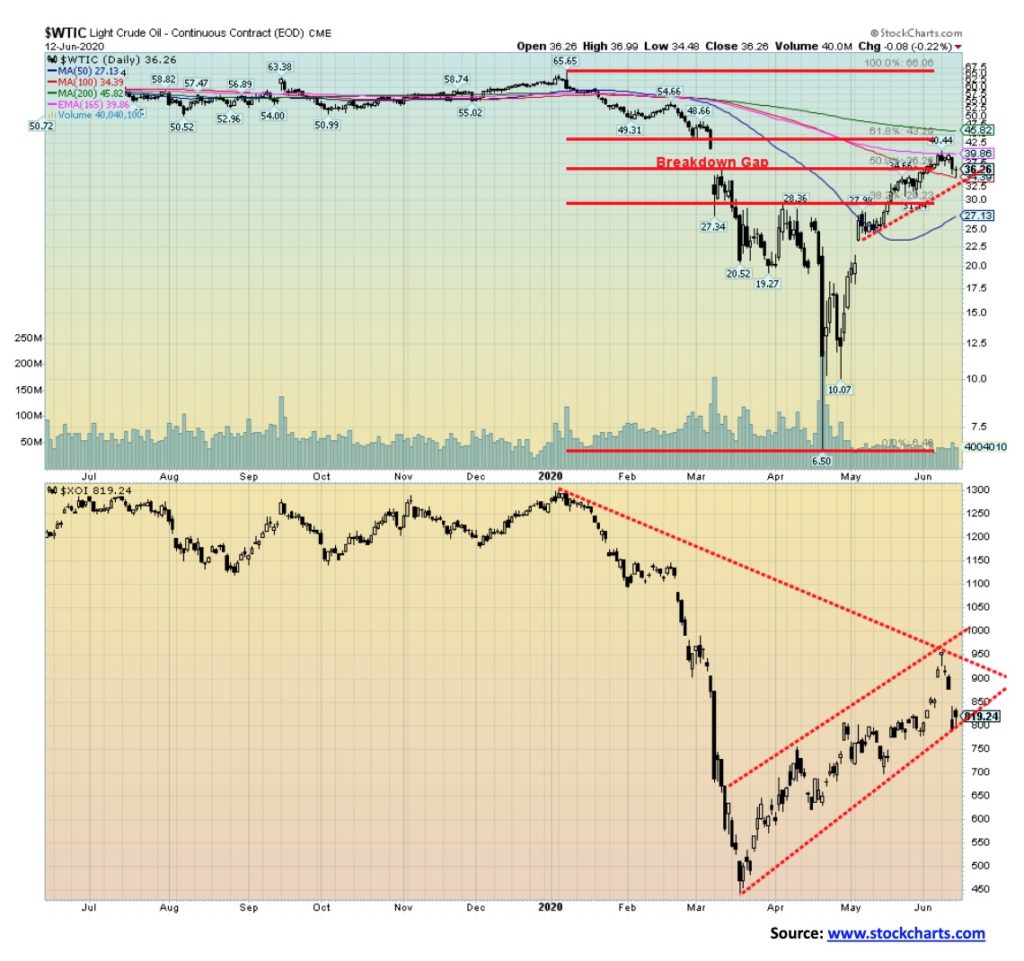
Looks like the oil rally is over. With the number of COVID-19 cases rising globally and threats that oil supplies could also rise again, WTI oil hit a wall and fell 8.3% this past week. The oversupplied natural gas (NG) fell 2.8% while the energy stocks were whacked, with the ARCA Oil & Gas Index (XOI) down 10.8% and the TSX Energy Index (TEN) down 12.8%. It was the first weekly decline for oil in a month. With the number of COVID-19 cases rising instead of falling, it raised concerns about thoughts of a global recovery. All of this was happening as the U.S. summer driving season got underway and demand has actually picked up somewhat. And supplies were also rising. So, with the price of oil probably going to fall and supplies high the rally ended abruptly.
Oil breaks under $32.50. WTI oil made it up to test the 165-day EMA, falling well short of the 200-day MA. Under $27 the oil bear resumes. Only fresh highs above $40 could change this. The 200-day MA was up just under $46.
Low prices and the risk of even lower prices are bringing more companies to the brink of bankruptcy. The shale industry appears to be headed for a long-term depression. Despite Trump trying to open offshore drilling and onshore drilling in formerly protected areas, the odds of anything happening are slim to none. Too many companies are worried that a change of regime could close those areas again and, as well, too may are worried about blowback, lawsuits, protests, and more to make it worth their while particularly in the current low-price environment. Many companies need upwards of $80 for oil to make it worthwhile. That’s not going to happen for some time. It is noted that U.S. production has fallen to 10.6 m/bpd vs. 12.6 m/bpd that was seen just last November 2019. The expected average for 2020 is 11.6 m/bpd. Investment has fallen sharply and is not expected to revive any time soon.
The XOI starts to break down under 750. Neither of these charts looks particularly bullish.
—
(Featured image by Pixabay via Pexels)
DISCLAIMER: This article was written by a third party contributor and does not reflect the opinion of Born2Invest, its management, staff or its associates. Please review our disclaimer for more information.
This article may include forward-looking statements. These forward-looking statements generally are identified by the words “believe,” “project,” “estimate,” “become,” “plan,” “will,” and similar expressions. These forward-looking statements involve known and unknown risks as well as uncertainties, including those discussed in the following cautionary statements and elsewhere in this article and on this site. Although the Company may believe that its expectations are based on reasonable assumptions, the actual results that the Company may achieve may differ materially from any forward-looking statements, which reflect the opinions of the management of the Company only as of the date hereof. Additionally, please make sure to read these important disclosures.


The TopRanked.io Weekly Affiliate Marketing Digest [The Top VPN Affiliate Programs Roundup]
Want to be let in on a little secret about two massive affiliate opportunities you can take advantage of today?...


Sustainable Finance Faces Hurdles as Green Asset Ratio Reforms Fall Short of Full Transparency
The Green Asset Ratio (GAR) measures banks' alignment with the EU Taxonomy but remains low due to methodological flaws and...


XRP Hits New All-Time High Amid U.S. Crypto Policy Shift and Ripple’s Expansion
XRP surged past its 2018 all-time high, reaching $3.65 amid renewed political support for crypto in the U.S. under Trump....


Germany Moves to Curb Medical Cannabis Abuse, Sparking Access Concerns
Medical cannabis imports in Germany have surged, but health insurance-covered prescriptions remain low. Easy online access raises concerns about abuse...


JPMorgan’s Data Fees Shake Fintech: PayPal Takes a Hit
JPMorgan Chase will charge fintechs for customer data, threatening business models reliant on free access. PayPal’s stock plunged 5.7% after...
 |
|
 |  |
 |
|
-

 Africa1 week ago
BLS Secures 500 Million Dirhams to Drive Morocco’s Next-Gen Logistics Expansion
-

 Fintech2 weeks ago
Ripple Targets Banking License to Boost RLUSD Stablecoin Amid U.S. Regulatory Shift
-

 Impact Investing3 days ago
Sustainable Investments Surge in Q2 2025 Amid Green and Tech Rebound
-

 Biotech1 week ago
Biotech Booster: €196.4M Fund to Accelerate Dutch Innovation