Featured
The COVID-19 pandemic or the ‘Black Swan’ event of the century
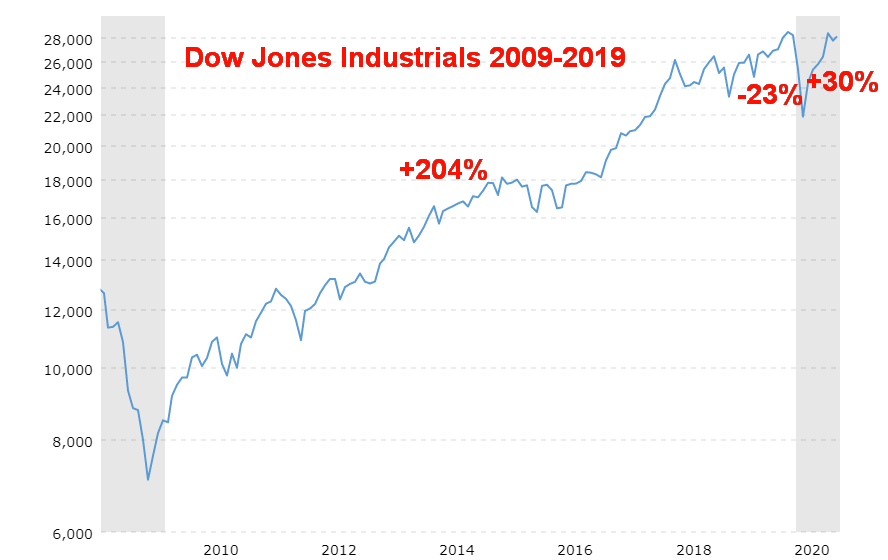
“Black Swan” events are thankfully few. But when they do happen they can be quite destabilizing even devastating. The pandemic of 2020 is a “black swan” event. Seemingly out of the blue, it has had widespread negative ramifications but it was actually predicted by scientists for years. Here is a comparison between the stock market of 1921-1932 and how it looks compared to the 2009-2020 market to date.

in February and March 2020, the Dow Jones Industrials (DJI) recorded eight days where the index fell over 1,000 points, including a record 2,997.10 points (12.9%) on March 16, 2020. The DJI also recorded two days over 1,000 points down in February 2018. They constitute the top 10-point declines of all time. To be fair, the DJI also recorded nine up days of 1,000 points or more of which eight occurred in March 2020 and one in December 2018. The largest was March 24, 2020 when the DJI gained 2,112.98 points (11.4%) and is the largest one-day gain ever. The final score: 10, 1,000 point + declines to 9, 1,000 point + gains.
Black swan events are not unusual. They just don’t happen with any predictability; ergo, the phrase “black swan event.” So, what is a black swan event? Well, it is an event that happens that is difficult to predict, it has major ramifications or impact, and, after the event, people will say it is explainable and was predictable (hindsight).
The arrival of Europeans on the shores of North and South America in the late 15th century was a black swan event for the civilizations and millions of people who lived there. When the dust cleared over the next few centuries, their civilizations were destroyed and upwards of 90% of the population perished. For them it was like the asteroid(s) and volcanic eruptions that occurred millions of years ago that killed the dinosaurs. More recently, black swan events can be beneficial, like the rise of the internet and the personal computer, or they can be disruptive like the collapse of the Soviet Union or the 9/11 attacks. The 20th century has had its fair share of black swan events like World War I, World War II, the 1929 stock market crash, and the 1918–1920 Spanish flu pandemic.
Cycle analysts predict with some degree of accuracy business cycles and stock market cycles based on observations of history. But black swan events come, it seems, out of the blue or even if there was some anticipation that an event was building it still comes as a surprise when it actually happens. Take the 2020 COVID-19 pandemic. That an event like that had been predicted years ago by scientists and health officials is moot. They couldn’t say when it would come, only that it would come and we should be prepared. Predictably, we were not.
Countries that were prepared have fared far better than others. Except few were prepared, an exception being Taiwan. Others brutally and forcibly shut down their economy to curb the spread of the virus. Think China. And, predictably, others dismissed it as “just the sniffles.” Except it wasn’t and a price was paid with shrinking economies and rising cases and deaths.
Today, despite over 37 million cases and over a million dead, there remain many—including some in powerful influential positions—who are dismissive of the virus or who see it as a conspiracy or a hoax perpetrated to control the world. Here’s a handful of such theories: the COVID-19 is a bioweapon from a lab in Wuhan, China, leading to the tag the CCP virus, the Wuhan flu, and many more; the U.S. Center for Disease Control is exaggerating the virus for control; wealthy elites are engineering the coronavirus for power and profit; the coronavirus is no worse than the flu so wearing a mask and social distancing is just meant to control everyone; certain drugs like hydroxychloroquine are an effective treatment; the Deep State wants to control the world with a “New World Order” that will lead to a one-world government; and (our personal favourite) that Microsoft founder Bill Gates, whose foundation is providing funding for vaccines, wants to embed chips in all of us to control the world. That the conspiracy theories have been debunked is moot because, despite showing they are wrong, these theories have millions of followers and shills who have no problem pushing them.
However, the pandemic is having an effect. The global economy has shrunk, millions of jobs have been lost, millions have been pushed into poverty, world trade has shrunk pushing back globalization, global tensions have gone up as multilateralism has shrunk, government deficits have gone up sharply, and inequality has gone up. The benefits, which create winners and losers, include a rising stock market that benefits few (Wall Street), creating more inequality (Main Street); rising house and property prices but falling prices for rental housing; a shift to working at home that has reduced traffic congestion and benefited the environment but which has negatively impacted commercial real estate and associated businesses; a rise in e-commerce that has negatively impacted bricks and mortar retail; a rise in savings rates but a decline in consumer spending.
Winners are e-commerce companies, home-office creators including internet communications, staples such as food (grocery chains), and, down the road, health care. Losers are restaurants and bars, mass entertainment, spectator sports, automobiles and car rental companies, mass transit, global travel (tourism), and airlines.
Pandemics are major drivers of history. They shift how society works and functions. We already note that the current pandemic has had a major impact on how we work (remotely), medicine and health, and online shopping (e-commerce). Pandemics and plagues are not one-off affairs. They can and do last for years, coming and going in waves. Even previous plagues in this past century caused a depression (the 1918–1920 Spanish flu sparked the Depression of 1920–1921) and recessions (the Asian flu of 1957–1958 sparked the recession of 1957–1958 while the Hong Kong flu of 1968–1969 sparked the recession of 1969–1970). It is interesting to note that the mortality rate of these previous flu pandemics was around 2.5%–3.0%. The COVID-19 flu’s mortality rate is currently about 3%, in line with previous pandemics of the past century. The mortality rate for plagues like the Black Death, the Plague of Antoine, or the Plague of Justinian was much higher, ranging in some cases up to 50%.
The pandemic of 2020 is a black swan event. Given the rise once again in the number of cases of COVID-19 plus the extremely divisive U.S. election, could a “black swan event” happen before election day November 3? As they say, anything could happen.
One thing we were struck with in looking at some charts are some eery similarities between 1921–1929 and 2009–2020. Naturally, that is not to conclude that the end results would be the same. But it is interesting.
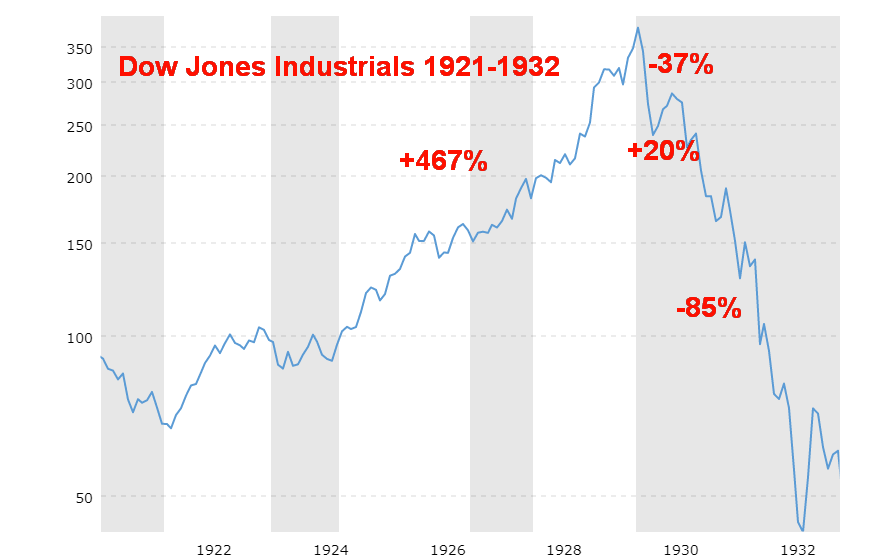
We have used the charts from (www.macrotrends.net) to keep the comparisons similar. The charts are based on monthly closes, not on actual highs and lows. While the actual rise and fall are not equal, the look is very similar. And the time frame is also similar. The period of 1921–1929 was eight years and the 2009–2019 rise was about ten years. The crash bottom was seen from September 1929 to November 1929 (three months) and December 2019–March 2020 (three months). The rebound rally went from November 1929 to April 1930 (six months) and, so far, March 2020 to August 2020 (the DJI has not taken out that August 2020 high close since then). The total loss (high to low) of the 1929 crash was 48%, while the March 2020 crash saw the DJI fall 38%. The rebound from the lows has been stronger this time than what was seen in 1929–1930. What is missing is the conclusion. The 1930–1932 bear was a devastating 86%. What will follow this time from the pandemic of 2020?
The argument has been, what kind of recovery are we having? We call them the Alphabet recoveries: L, V, U, W, and K. The K recovery is starting to have some cachet. What is a K recovery? A K recovery sees one part of the economy rising and doing well (Wall Street?) and another part of the economy doing poorly and falling (Main Street?). This divergence is a recipe for social unrest as inequality rises. Putting this all together—with an extremely contentious election and the current culture wars and divisions in society against the backdrop of a pandemic—the next few years promise to be rocky and volatile at best. The black swans have struck again.
MARKETS AND TRENDS
| % Gains (Losses) Trends | |||||||
| Close Dec 31/19 | Close Oct 9/20 | Week | YTD | Daily (Short Term) | Weekly (Intermediate) | Monthly (Long Term) | |
| Stock Market Indices | |||||||
| S&P 500 | 3,230.78 | 3,477.13 | 3.8% | 7.6% | up | up | up |
| Dow Jones Industrials | 28,645.26 | 28,586.90 | 3.3% | 0.2% | up | up | up |
| Dow Jones Transports | 10,936.70 | 11,861.95 (new highs) | 5.0% | 8.8% | up | up | up |
| NASDAQ | 9,006.62 | 11,579.94 | 4.6% | 29.1% | up | up | up |
| S&P/TSX Composite | 17,063.53 | 16,562.81 | 2.2% | (2.9)% | up | up (weak) | up |
| S&P/TSX Venture (CDNX) | 577.54 | 732.25 | 3.3% | 26.8% | neutral | up | up |
| S&P 600 | 1,021.18 | 926.19 | 5.7% | (9.3)% | up | up | down (weak) |
| MSCI World Index | 2,033.60 | 1,910.48 | 3.0% | (6.1)% | up | up | down (weak) |
| NYSE Bitcoin Index | 7,255.46 | 11,069.29 | 5.2% | 52.6% | neutral | up | up |
| Gold Mining Stock Indices | |||||||
| Gold Bugs Index (HUI) | 241.94 | 340.18 | 4.8% | 40.6% | neutral | up | up |
| TSX Gold Index (TGD) | 261.30 | 369.11 | 2.1% | 41.3% | down | up | up |
| Fixed Income Yields/Spreads | |||||||
| U.S. 10-Year Treasury yield | 1.92 | 0.77 | 10.0% | (59.9)% | |||
| Cdn. 10-Year Bond yield | 1.70 | 0.61 | 8.9% | (64.1)% | |||
| Recession Watch Spreads | |||||||
| U.S. 2-year 10-year Treasury spread | 0.34 | 0.62 | 8.9% | 82.4% | |||
| Cdn 2-year 10-year CGB spread | 0 | 0.34 | 6.3% | 3,400.0% | |||
| Currencies | |||||||
| US$ Index | 96.06 | 93.07 | (0.9)% | (3.1)% | neutral | down | down |
| Canadian $ | 0.7710 | 0.7620 | 1.3% | (1.1)% | up | up | neutral |
| Euro | 112.12 | 118.28 | 1.0% | 5.5% | neutral | up | up |
| Swiss Franc | 103.44 | 109.89 | 1.2% | 6.2% | neutral | up | up |
| British Pound | 132.59 | 130.43 | 0.8% | (1.5)% | neutral | up | neutral |
| Japanese Yen | 92.02 | 94.69 | (0.2)% | 2.9% | neutral | up | up |
| Precious Metals | |||||||
| Gold | 1,523.10 | 1,926.20 | 1.0% | 26.5% | down (weak) | up | up |
| Silver | 17.92 | 25.11 | 4.5% | 40.1% | down | up | up |
| Platinum | 977.80 | 894.30 | 0.3% | (8.5)% | down | neutral | neutral |
| Base Metals | |||||||
| Palladium | 1,909.30 | 2,463.20 | 5.9% | 29.0% | up | up | up |
| Copper | 2.797 | 3.08 | 3.4% | 10.1% | up | up | up |
| Energy | |||||||
| WTI Oil | 61.06 | 40.60 | 9.6% | (33.5)% | neutral | neutral | down |
| Natural Gas | 2.19 | 2.74 | 12.3% | 25.1% | up | up | neutral |
Note: For an explanation of the trends, see the glossary at the end of this article.
New highs/lows refer to new 52-week highs/lows.
Chart of the Week
With the election barely three weeks away, things are sure to get even bumpier than they have already. This election campaign has been one of the most partisan, acrimonious ones ever. As many are saying, it is approaching near civil war proportions. Civil war was highlighted by the failed right-wing plot to overthrow Michigan Governor Gretchen Whitmer. Most analysts are already gearing for a disputed election, irrespective of the results on November 3—whether it’s close or a landslide. Even Canada has announced they are preparing for possible “disruptions” as a result of the U.S. election.
A disputed election, regardless of the results, could result in destabilization of the stock market. The stock market (financial assets) is dependent on stability and certainty. The question then becomes: how much money will the financial authorities, led by the Federal Reserve, throw at the problem to keep it afloat if the market should destabilize following a disputed election? To date, U.S. financial authorities have thrown some $3 trillion at the market through the Federal reserve, plus another $3 trillion or more from the U.S. Treasury. U.S. federal debt has gone up $3.6 trillion since the end of February 2020. The U.S. budget deficit is a record $3.1 trillion but the real budget deficit is probably higher, estimated at $4.2 trillion. The debt to GDP ratio now stands at 137.7%, putting the U.S. close to the same range as Italy (155%+) and Greece (177%). Unemployment has soared and the U.S. remains over 11 million jobs short, based on where they were eight months ago.
Here in Canada the Federal government and the Bank of Canada (BofC) have embarked on similar programs. The Feds are running a record budget deficit of at least $343 billion. The BofC has embarked on a QE program not dissimilar to the Federal Reserve that has seen its balance sheet explode 342% since December 2019 or $408 billion. That is only until June 30, 2020 as it is probably even higher now. To put that into proportion with the rise of the Federal Reserves balance sheet the BofC did not embark on programs of QE1, QE2 and QE3 as was the case south of the border. So, it looks higher percentage wise by comparison as its base was a lot smaller. Canada’s Federal debt to GDP is also a lot smaller at about 50% even taking into account the current budget deficit. Canada’s unemployment soared as well as over 3 million jobs were lost in March/April 2020. However, Canada’s recovery has been stronger as only 719 thousand remain on the unemployment rolls having recovered 76% of the jobs lost.
All this destabilization has been very positive for gold in 2020. Setting aside the 49% rise for Bitcoin in 2020, gold has been the top-performing asset, rising 24.4%. Gold’s junior partner, silver, has performed even better, up 32.6%. Gold stocks, as measured by the TSX Gold Index (TGD), have gone up 37.4%. They have vastly outperformed the S&P 500 up 6.7% and the TSX Composite down 3.1%. The uncertainty has also weighed on the U.S. dollar as the US$ Index has fallen 2.5% in 2020.
So, what could the destabilization bring following a disputed election? Some have postulated that violence could rise between supporters of the two sides. But here is where it could get very dangerous, as some are postulating that the divisions and violence could spread to disputes and clashes between intelligence agencies, the police, and the military. All of this adds to the unknown. If any of this comes to pass, even in a scaled-down version it could weigh on the stock market, gold, and the U.S. dollar.
Gold could still be considered to be cheap. One way to possibly look at how cheap is gold is to look at the Money Supply (M2)/Gold ratio. In 1971 when President Richard Nixon took the world off the gold standard, the M2/Gold ratio stood at 16.04. By February 1980, during gold’s huge run-up in the late 1970s to over $800, the ratio fell to 2.25. Over the next 21 years as gold prices fell and M2 rose during the 1980s and 1990s, the ratio peaked in December 2001 with gold near $250. The 2000s saw gold prices soar again as debt rose, M2 soared, and markets became destabilized during the dot.com bust 2001–2002 and the global financial crisis 2007–2009. By 2011, when gold rose to over $1,900, the M2/Gold ratio fell to 5.42. Today it sits around 9.35 and has turned down again in favour of gold.
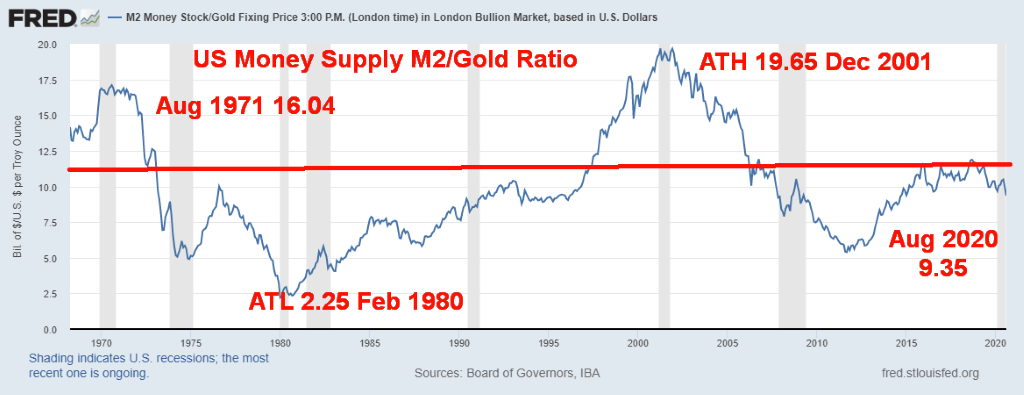
If M2 were stable (not likely), gold would need to rise to $8,300/ounce to reach the ratio level seen in February 1980. Even to reach the ratio level of 5.42 seen in August 2011 gold prices would need to rise to $3,400/ounce. Given everything that is going on, the likelihood is that M2 will continue to rise, and along with it, debt, which could soon reach $30 trillion. By many measurements, gold remains cheap and the U.S. dollar remains overvalued. Going forward, there will be downward pressure on all fiat currencies and upward pressure on gold. Debt and the global supply of money will keep on rising as currencies are further devalued.
Stimulus takes precedence over the potential for a chaotic election, it seems. The on-again/off-again/ back-on-again and possibly off-again stimulus talks are all that market seem to care about. Then again, maybe the markets believe that, come the November 3 election, the loser will do the right thing and concede. However, many signs are pointing to a chaotic end to the election. Uncertainty and instability, even on the political front, is not what the markets want to contemplate. We were expecting a low in October; instead, we appear to be headed for a high. We call that an inverse—meaning the market is inverting and, rather than getting a low, we get a high instead. That would normally set up November as going the opposite way and, instead of a rocket shoot after a resolved election, we get a down market into 2021. The election itself continues to turn on the mail-in votes which will, it seems, be challenged by Trump if he loses and could even be challenged by Biden if he loses. This election has the potential to be exceptionally chaotic and one that has implications not only for the U.S. but also for the world.
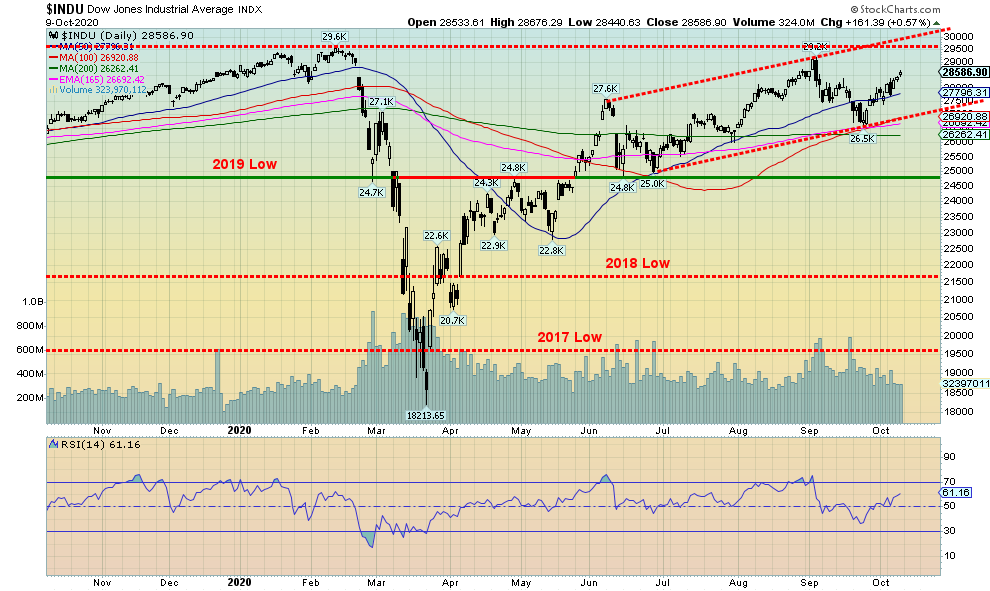
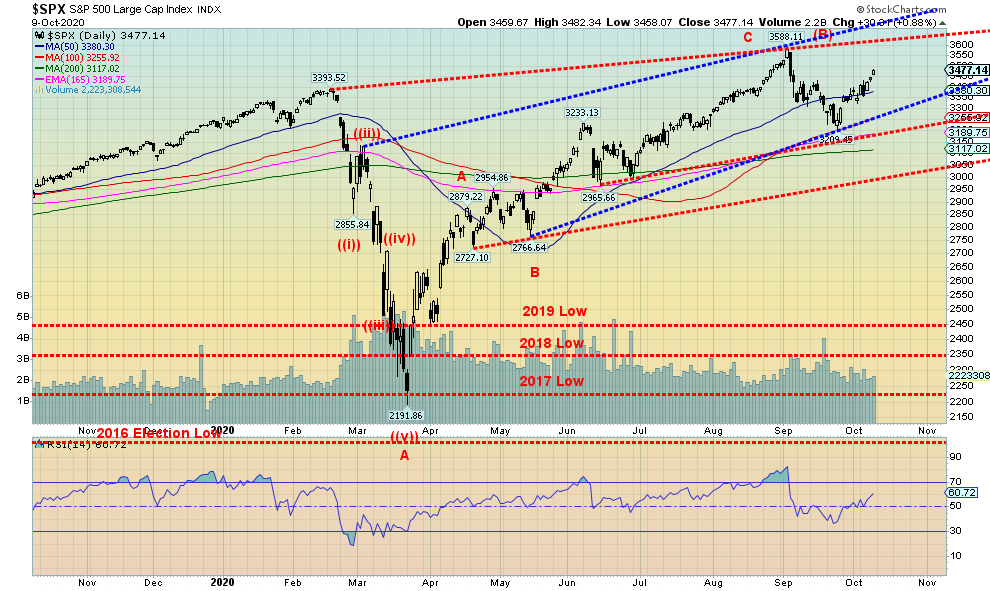
This past week the S&P 500 gained 3.8%, continuing its winning ways after the September correction that saw the S&P 500 pull back 10.6%. The S&P 500 found support at the 100-day MA. So, was this an A wave down or merely a correction within the context of the bull move from the March 2020 low? If this is a B wave, we are reminded that we have often seen B waves make new highs that suck everyone in. The only high of note we have ever seen in October was October 11, 2007. Recall that, in that year the market topped in July, then the first sub-prime debacle appeared, some Bear Stearns funds went under, and the S&P 500 fell about 12% into August. The recovery was laboured but eventually the S&P 500 made small new highs at 1,576 vs. the 1,556-high seen in July. A 12% drop in July/August 2007 and 10.6% drop this time in September 2020. This rally has lasted longer than the one seen in 2007.
Elsewhere this past week the Dow Jones Industrials (DJI) gained 3.3%, the Dow Jones Transportations (DJT) made new all-time highs (yes, hard to believe) gaining 5.0%, and the NASDAQ was up 4.6%. The small cap S&P 600 enjoyed another banner week, up 5.7%, but is still down 9.3% on the year. The world MSCI World Index was up 3.0%. Canada’s TSX Composite gained 2.2% and the hot TSX Venture Exchange (CDNX) was up 3.3%, making it up a stellar 26.8% on the year. Bitcoin continued its hot hand, gaining 5.2%, and is up 52.6% on the year. But the cryptocurrencies remain plagued with hacks and scams and the market is still very small.
In the EU the London FTSE gained 1.9%, the Paris CAC 40 was up 2.5% and the German DAX was up 2.9%. China’s Shanghai Index (SSEC) gained 1.7% and the Tokyo Nikkei Dow (TKN) jumped 2.6%.
The S&P 500 has a lot of potential scenarios from here. We appear to be within a few channels. The most notable top channel is one joining the February high with the recent September high. The top of that channel is around 3,625. Another channel top lies just above at 3,700. So, those are potential targets for this rebound. To the downside, a break occurs under 3,250 then under 3,180. The final breakdown is under 3,000. Below that level a serious bear market could develop.
The rally continues, but we continue to believe this a “sucker” rally and the market is inverting to a high when we expected a low this month. The message seems to be “beware the upcoming election.”
This past week we are seeing our first potential divergence between the Dow Jones Industrials (DJI) and the Dow Jones Transportations (DJT). The DJT made new all-time highs. The DJI is nowhere near its old highs. Okay, the DJI would still have to gain only an additional 3.4% from current levels to equal the February 2020 high. However, we continue to believe that the March crash was a very bearish signal, given the DJI took out the previous year’s lows of 2019, 2018, and 2017. Whenever we have seen that happen it signals to us that the great bull market is over and the new bear is underway. What we have been experiencing since the March low is the B wave or, as we like to say, the “sucker” wave. Why the “sucker” wave? Because it sucks everyone into thinking the great bull market is resuming or that a new great bull market is underway. It is rare for a crash like we saw in March to mark merely a pause in a bull market. Oddly, the 1929 crash was severe but it never took out the 1928 low, let alone any other year’s lows. The rally from November 1929 to April 1930 never made any new highs and turned out to be a “sucker” rally. The 1987 crash, as steep and scary as it was, did not take out the 1986 low, let alone any other previous year’s lows either. Subsequently, the rally that lasted to July 1990 made new all-time highs and, while the mini-crash into October that year was severe at over 20%, it never even came close to the lows of 1987. The DJI’s failure to make new highs is an interesting, potentially negative divergence with the S&P 500, the NASDAQ, and now the DJT. Naturally, only time will tell whether we are right and the failure for the indices to confirm each other translates into another big leg down in the market.
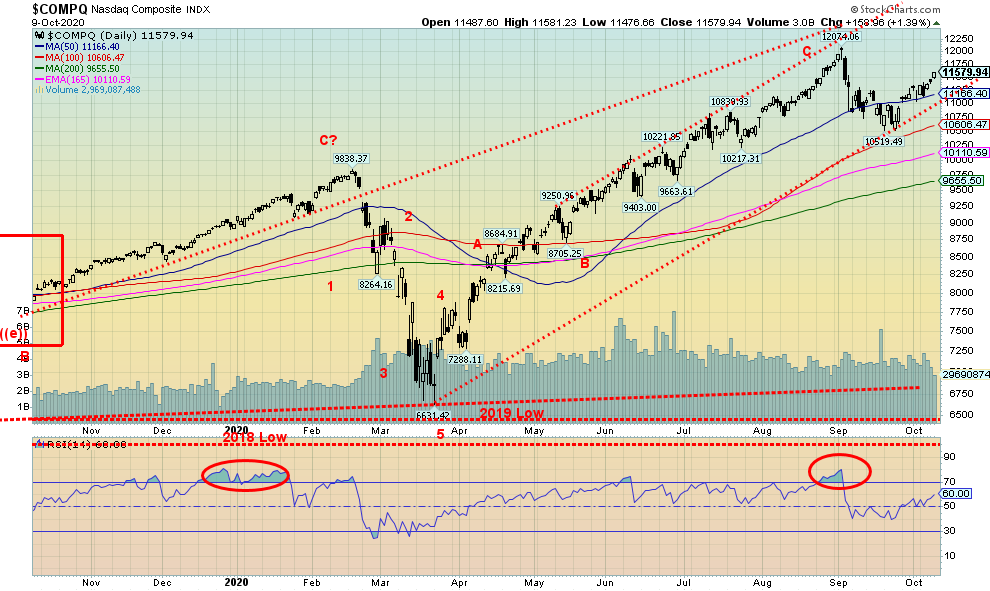
The NASDAQ’s little correction appears to be over. It lost almost 13% in the recent pullback. But will it make new all-time highs once again? It will, once again, probably take the big six to pull the market to new all-time highs. This past week the big six saw nothing but gains: Facebook +1.7%, Apple +3.5%, Amazon +5.2%, Netflix (raising its prices) +7.2%, Google +3.9%, and Microsoft +4.7%. Oh, yes, and for the record Tesla was up 4.6%. Buffet’s Berkshire Hathaway is trying to keep up, gaining 1.9%. We seem to have an interesting rising channel for the NASDAQ. However, we doubt that this time it will reach the top of the channel which we estimate to be near 13,000. The NASDAQ found support near its 100-day MA and it has now recovered its 50-day MA. The recent pullback was the first significant correction seen for the NASDAQ since the March low. The only question on our mind is, this a continuation of the uptrend or is this merely a B wave up following the A wave down that bottomed on Sep 21 at 10,519? We are leaning to the B wave theory. However, we fully admit B waves of this nature can see new all-time highs, although likely by only a small margin.
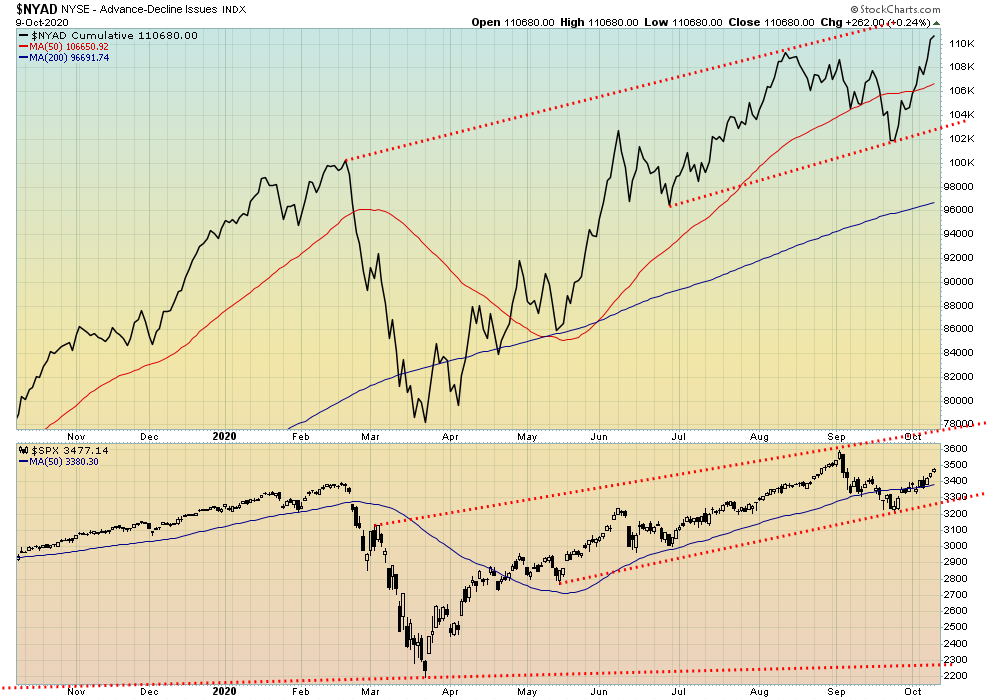
Up, up, and away. That is the NYSE advance-decline line rising to a new record high. The AD line is suggesting that the S&P 500 should soon be making new all-time highs and we are probably not going to argue with that. The AD line seems to have led the market up for months.
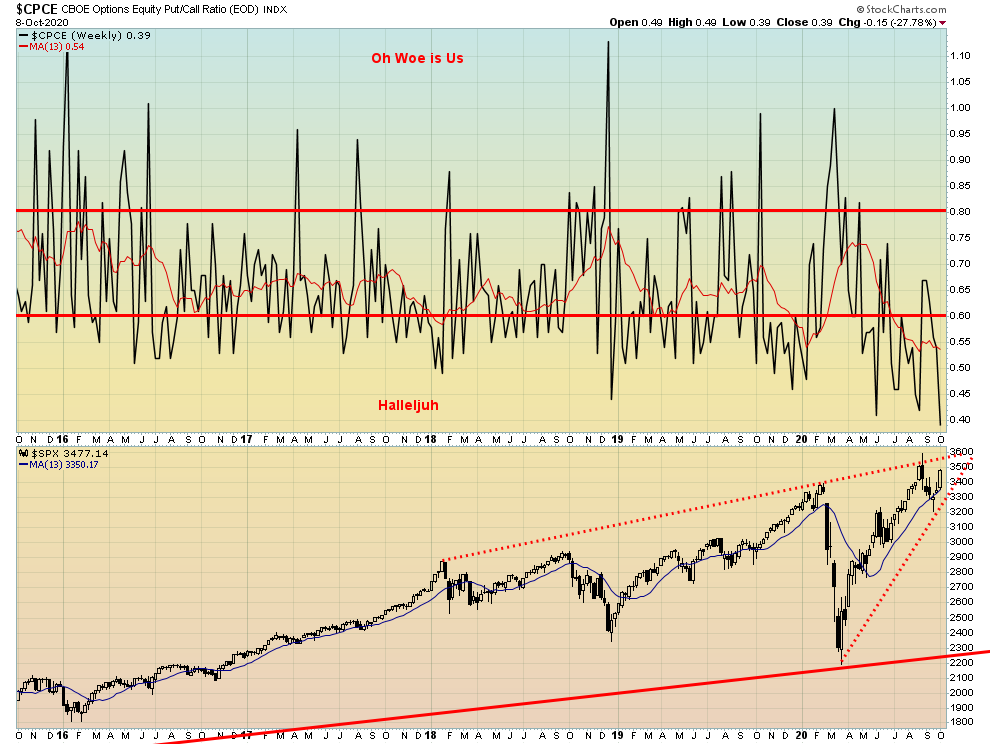
Frankly, we are a little shocked to see the put/call ratio plunge to a new record low at 0.39. Is this market so complacent that investor/traders are piling into calls at record levels? That certainly appears to be the case. Here, the put/call ratio has made a new record low in favour of calls but the S&P 500 has not yet made new all-time highs. It is very possible the S&P 500 does see new highs, but the complacency being shown in the put/call ratio is a severe warning sign.
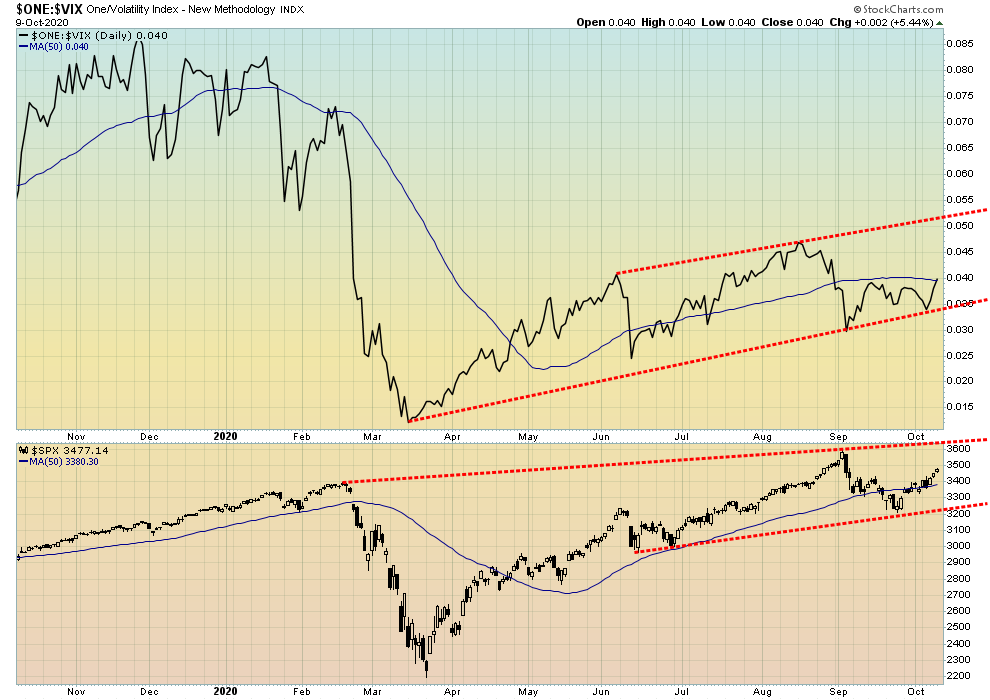
We had noted that the VIX volatility indicator did not make a new low along with the S&P 500 on the recent short-term down swing. This was a divergence and indicated that one of them was wrong. Well, this past week the S&P 500 started rising again and has cleared its 50-day MA. While the VIX indicator is up, it has, so far, failed to clear its 50-day MA. Another divergence? Could the S&P 500 make new highs but the VIX fail to do so? That is a distinct possibility. We’ll continue to monitor this going forward.
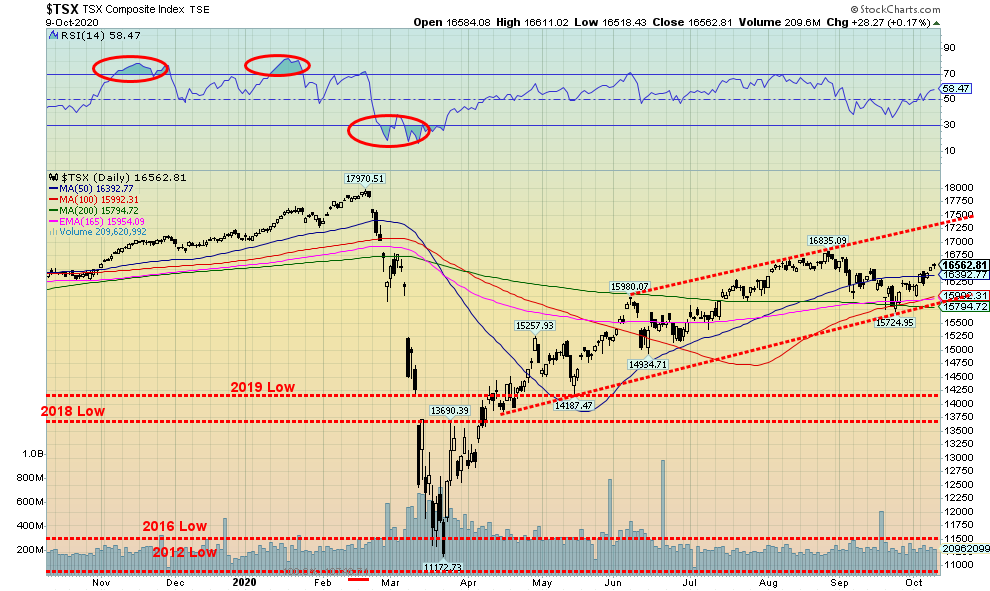
The TSX Composite continued its recent climb, gaining 2.2% on the week. The TSX found support at the 200-day MA and an uptrend line from lows seen back in April and May. Could the TSX now go to the top of the channel, currently up near 17,250? If so, counting from the March low we see a wave A up to 15,257 in April, the B wave bottom in May at 14,187, and now a 5-wave move from the May low for wave C.
Twelve of the 14 sub-indices closed up on the week led by Health Care (THC) that gained a big 13.8%, thanks to some big moves by marijuana stocks like WEED. Next best was Energy (TEN) up 8.6%. Consumer Discretionary (TCD) gained 5.1%. Health Care is not a major component of the TSX but Energy is. The only losers were Income Trusts (TCM) -0.3% and Consumer Staples (TCS), off 0.7%.
The TSX has been rising on reduced volume. At times trading has been sluggish. Nonetheless, the TSX could be making a move towards the top of that channel, if our comments about a high in October are correct. The breakdown level is under 15,800. The sluggish rise since the March low has all the earmarks of a corrective B wave to the upside, the March low being the A wave down. The C wave down should start under 15,800.
Canada – Unemployment Rate, Employment Change
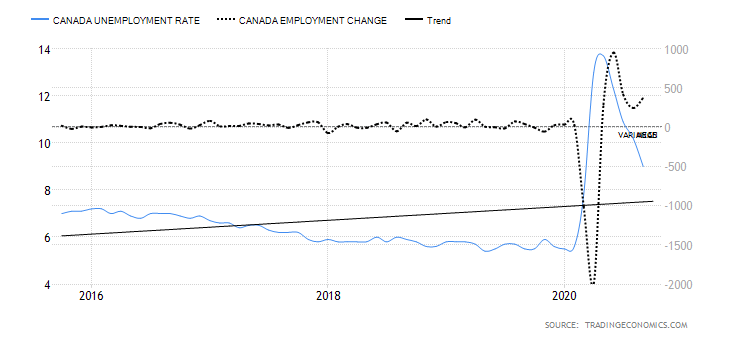
According to Statistics Canada, the Canadian economy created 378 thousand jobs in September 2020. That was well above the forecast of 156.7 thousand jobs and above the 245.8 thousand created in August. Full-time rose 334 thousand while part-time was up 44 thousand. The unemployment rate fell to 9% from 10.2%. When one considers discouraged workers plus those waiting and involuntary part-timers (R8), the unemployment rate was 11.2%, down from 14.5%. In March/April Canada officially lost 3,004.5 thousand jobs. To date they have recovered 2,285.0 thousand, leaving them still short 719.5 thousand. They have recovered 76% of the jobs lost. That ratio is far better than the one for the U.S. who has barely recouped half the jobs that were lost. Still, according to Stats Can, the labour force has fallen by 352.6 thousand since February 2020. While the goods-producing sector has recouped its job losses, the services-producing sector is not even close. With the number of COVID-19 cases rising sharply in Canada and shutdowns being announced once again, there is a chance that the October numbers could once again be negative and the unemployment rate rise. Some 25%+ are working but are working from home. That rate is over double where it was pre-pandemic. The unemployment continues to hit hard against low-wage earners and young people while high-wage earners continue to be employed. During the 2008 financial crisis, the unemployment rate rose to 8.7%, up from 6.2% before the crash. It took nine years for the unemployment rate to fall back to where it was pre-recession. Based on that, the likelihood is it will take even longer this time to return to pre-pandemic levels. And, given a second wave, things could get worse again.
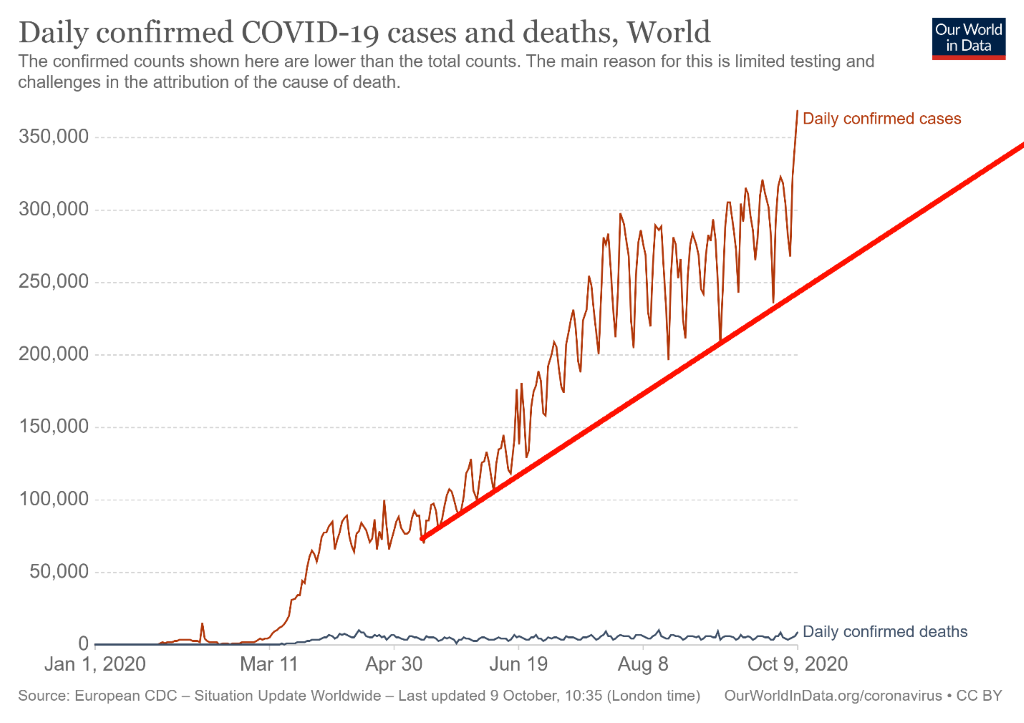
The world is setting records for the COVID-19 when 368 thousand cases were reported on October 9. The 7-day average is now over 305,000 every day. Deaths haven’t jumped substantially but still remain at over 5,000 daily. The death/cases ratio remains steady around 2.9%. That’s well above the common flu death/cases ratio of around 0.1%. And it is in keeping with historical figures on deaths/cases. Okay, not in the league of the Black Death and bubonic plagues where upwards of 50% perished. The global climb in cases continues in a nice uptrend with no sign of a top. The U.S., India, and Brazil lead the way in cases while the U.S., Brazil, and India (in that order) lead the world in deaths. Rounding out the top 10 in cases are Russia, Colombia, Spain, Argentina, Peru, Mexico, and France. Rounding out the top 10 in deaths are Mexico, U.K., Italy, Peru, Spain, France, and Iran.
Coronavirus cases and deaths as at October 11, 2020 15:25 GMT:
Number of cases – 37,576,163
Number of deaths – 1,078,832
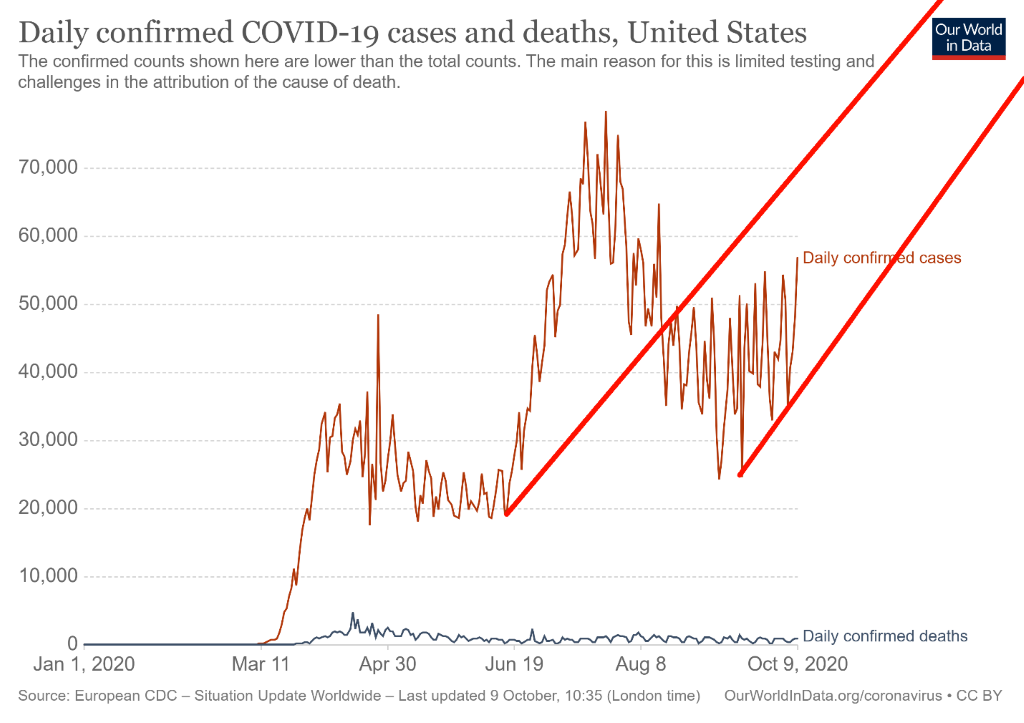
As we swing towards the November election, the number of cases in the U.S. is starting to rise. At the current pace, the number of deaths could be over 300,000 by year end. On October 9 the U.S. went over 60,000 cases for the first time since a spike in August. Through June 60,000 + every day was normal. The 7-day MA is rising and is now at over 48,000 cases daily and over 700 dead daily. Actually, that’s good as it is down from over 1,000 daily seen in August. But it is rising. California, Texas, and Florida continue to lead the way in cases while New York, Texas, and California top the charts in deaths. It seems that the entire White House has been diagnosed with the virus even as Trump has made what appears to be a miraculous recovery. With numbers rising for cases and deaths, expect this to continue into the election and even beyond.
Coronavirus cases and deaths as at October 11, 2020 15:25 GMT:
Number of cases – 7,950,510
Number of deaths – 219,304
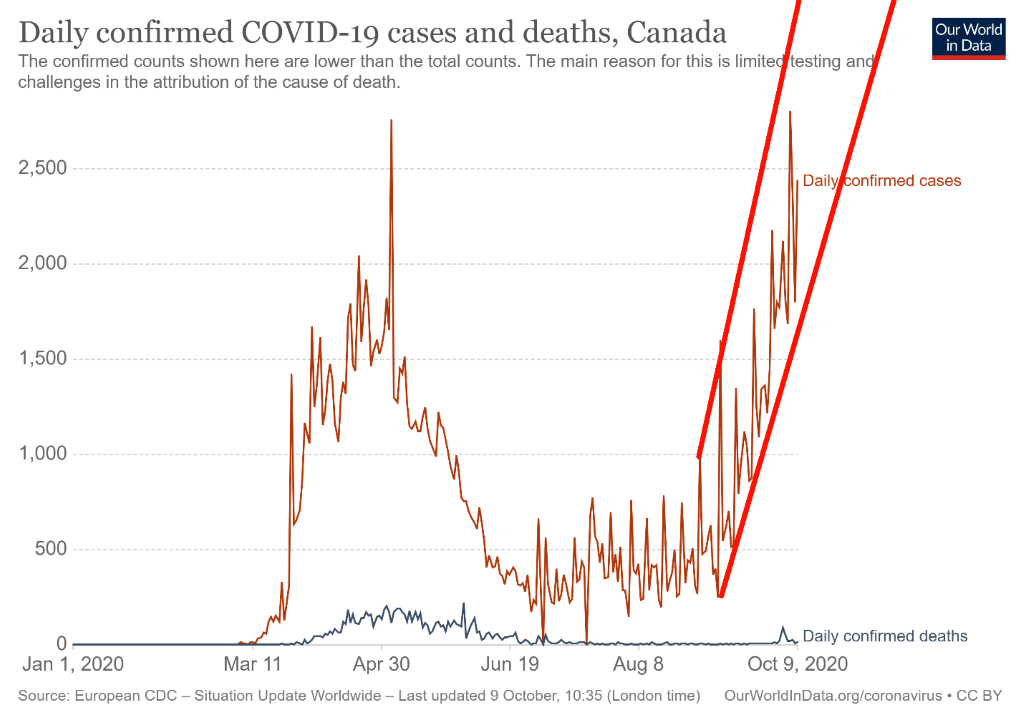
Up, up, up, and away? Are Canada’s numbers soaring? Well, they appear to be and parts of Quebec and Ontario have moved back into lockdown mode, although not the full-blown lockdown seen back in March/May 2020. Deaths have also perked up, but they are nowhere near the levels seen through March to May. Not yet. In the previous round, some 80% of the deaths were occurring in long term care homes, the elderly being a natural target for the virus. Canada’s cases are now averaging 2,200 daily with deaths averaging 25 daily. That’s a far cry for deaths that were averaging as high as 175 daily back in May. Deaths per cases are now a more reasonable 1% vs. 10% back in May. That’s still high, although below the global average of around 3%. Canada hit a record 2,800 cases on October 5 and both Ontario and Quebec have had record cases. The new lockdowns are more concentrated rather than across the country or throughout the provinces.
Coronavirus cases and deaths as at October 11, 2020 15:25 GMT:
Number of cases – 180,179
Number of deaths – 9,608
US 10–Year Treasury Note, Canada 10–Year Government Bond (CGB)
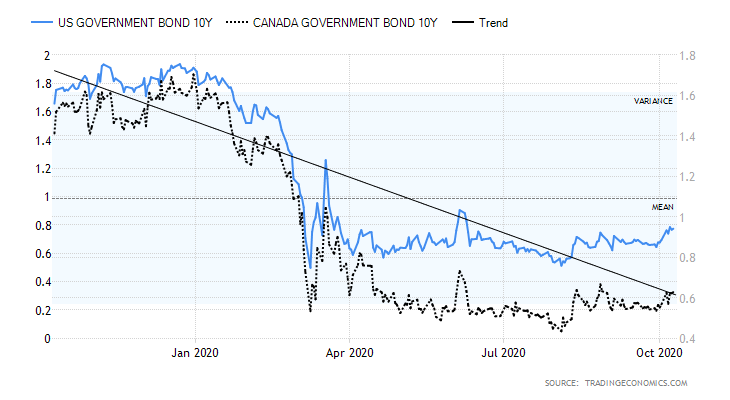
Interest rates rose this past week as the U.S. 10-year treasury note went from 0.70% to 0.77%. The Canadian 10-year government of Canada bond (CGB) rose to 0.62% from 0.57%. The impetus for a rise in rates was the potential for a stimulus deal and a falling U.S. dollar. In Canada, there is also the potential for further stimulus given the sharp rise in COVID-19 and further lockdowns under way. All this raises inflationary expectations and helps push up longer dated interest rates. Given that the odds of a rate hike from the Fed or the BofC are virtually zero, our expectations that rates are going to shoot to the moon are low. However, a rise to 1% for the U.S. 10-year is not out of the question. The most recent high for the U.S. 10-year was back in June at 0.90%. For the Cdn 10-year, the high was 0.73% also back in June 2020. If the U.S. 10-year were to take out the June high and break out above 1%, potential targets are up 1.3%. That would still leave the 10-year below the rate of inflation and continue negative interest rates. Right now, we can’t see above that level, and first we need to break out over 0.90%.
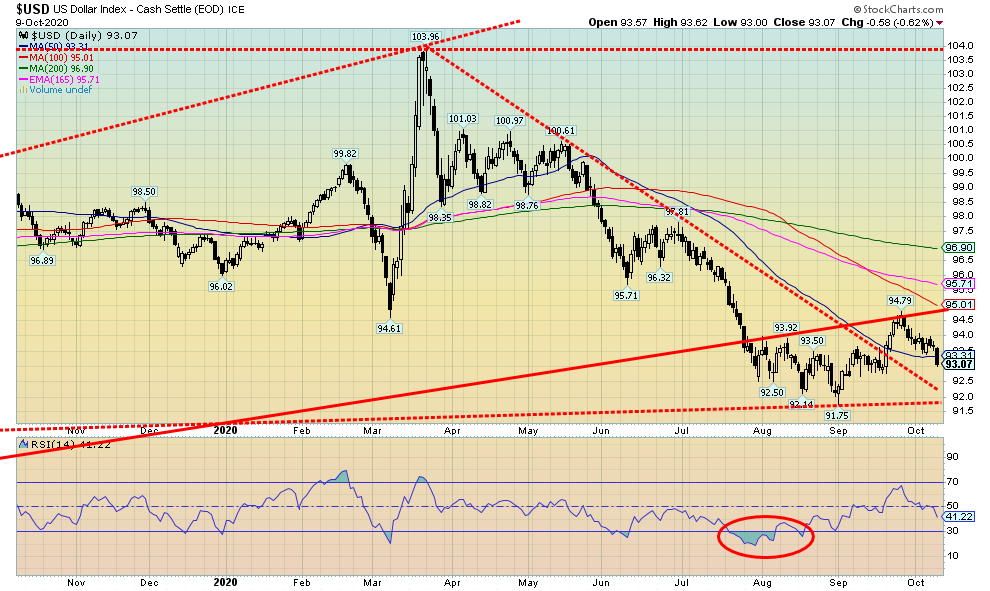
Could the US$ Index now be in the process of making another wave to the downside? It appears that is very possible. The rally from 91.75 on September 1 unfolded in 3 waves to the upside, suggesting it was a corrective move only. While we appeared to break the downtrend line, we failed at an old uptrend line that dates back to the all-time low at 72.70 back in 2011. Clearly that area up to 95 is now major resistance. What’s left now is for the US$ Index to break the old low of 91.75. It could then target down to 88.70 with further potential down to 86.80. The on-again/off-again/on-again stimulus talks were the trigger for a fall in the US$ Index. So is the uncertainty and potential for chaos out of the November 3 election. The US$ Index fell 0.6% on Friday and closed the week down 0.9%. The Cdn$ was the best performer, gaining 1.3% on the week. The euro was up 1.0%, the Swiss franc gained 1.2%, and the pound sterling was up 0.8%, but the Japanese yen lost a small 0.2% even as it rebounded on Friday. The on-again/off-again/on-again stimulus package has seen the administration raise its offer and the opposition Democrats come in a little bit. So, they are inching closer together and both probably want a deal before the election, regardless of the rhetoric out of the White House. The US$ Index has some support at 92.70, but below 92.45 new lows below 91.75 are highly probable.
Chinese Yuan (US$1 = 6.68853 Yuan)
Down, down, down we go. Yes, that is the U.S. dollar falling against the Chinese yuan. That’s a nice double top on the charts at US$1 = 7.17 yuan. The breakdown below 6.78 has the potential to see the $/yuan fall to 6.39. The $/yuan closed Friday at 6.68. This could also help the U.S. trade deficit with China that is $302 billion and still rising, despite Trump’s trade wars and sanctions.
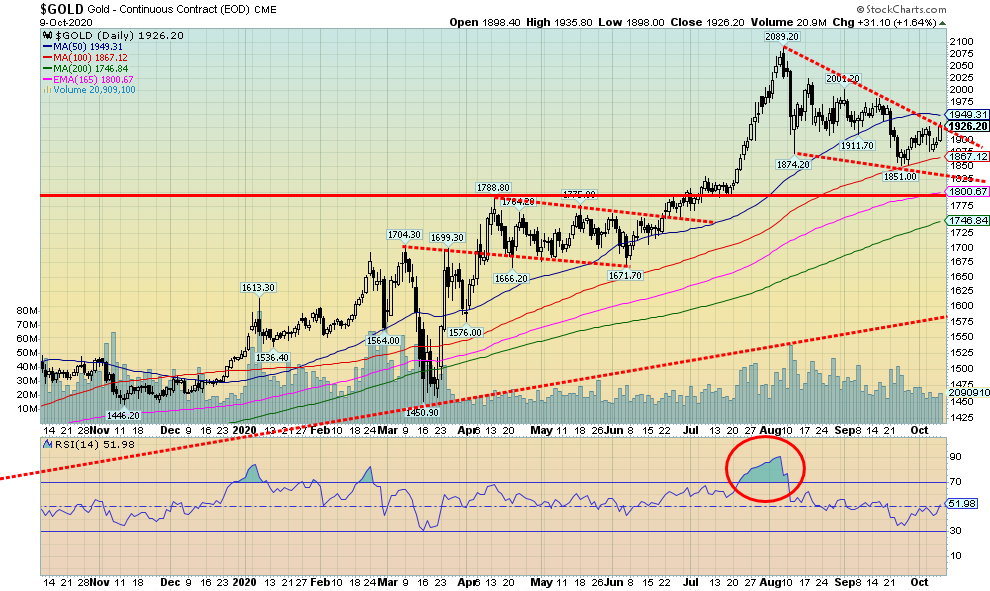
Thanks to the stimulus “is it on or is it off” babble throughout the week, the “on” won out in the end and gold soared 1.6% or $31 on Friday. If it goes “off” again gold could fall. With stimulus talks seemingly back on, the U.S. dollar fell and gold rose. Gold has been battered back and forth lately as the stimulus talks go from on to off to back on again. It is probably in the interests of both parties to find a deal of some sort. And, given that polls continue to point to a Biden victory, that is also spurring gold on the expectations that even more stimulus would be forthcoming. The U.S. dollar was doing the opposite. Near-zero interest rates and unprecedented money printing are music to gold’s ears. And the potential for a hung election or at least a challenged election and disruptions, even violence, is also helpful for gold. On the week, gold gained 1.0%, silver was up 4.5%, platinum gained 0.3%, palladium was up 5.9%, and copper also gained up 3.4%.
Gold continues to form what appears to us as a descending wedge triangle. We closed Friday on the cusp of a breakout. A move above $1,950 would confirm that a low is probably in and moves above $2,000 and $2,040 would add to the confirmation. Above $2,040 would suggest new highs ahead. If the descending wedge is correct, then potential upside targets are to $2,160/$2,200. Further potential is up to $2,300. Given that we have not yet confirmed an upside breakout, we are at the point of potential failure as well. The downside breakdown is at $1,840 with interim support at $1,880 and $1,865. We doubt that gold would break down but we don’t want to eliminate these possibilities until we confirm the upside.
But it is the drama over the stimulus package and potential mass disruption over the election that is currently driving gold. A stimulus package is inevitable. Election chaos may also be inevitable. The question on the package is: how big. As well, we’ll keep an eye on the Fed to see if it ups its bond purchases.
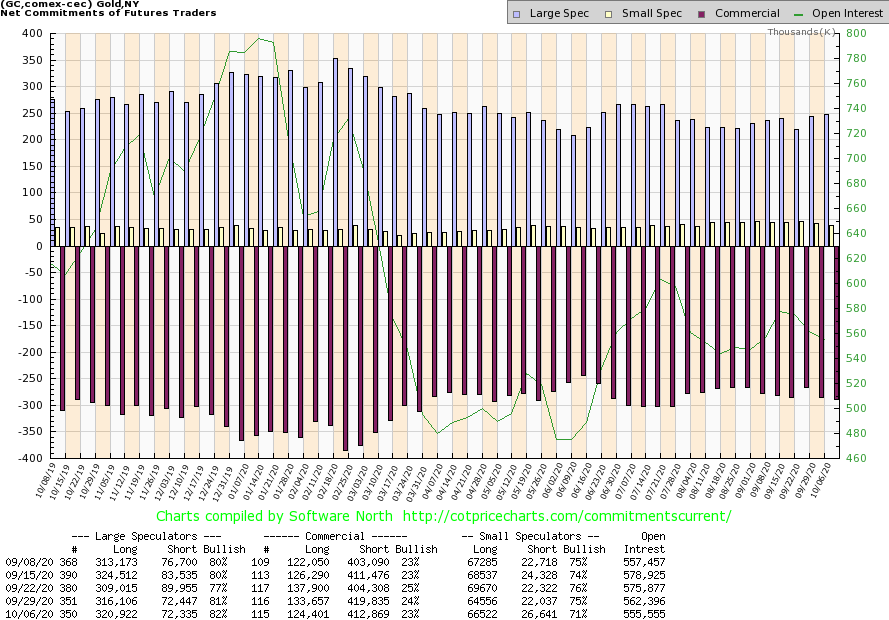
The gold commercial COT did not take our preferred direction this past week, falling to 23% from 24%. Long open interest fell roughly 9,000 contracts while short open interest was also off down roughly 7,000 contracts. Open interest was down on the week, off about 7,000 contracts. But remember, this report is only to October 6 and does not include the gains seen for gold at the end of the week. Next week’s report will be dated October 13 and hopefully we see an improvement. The large speculators COT (hedge funds, managed futures, etc.) rose slightly to 82% from 81%. Makes us a little concerned when we see the large speculators COT that high. We ask: “are they too bullish?”
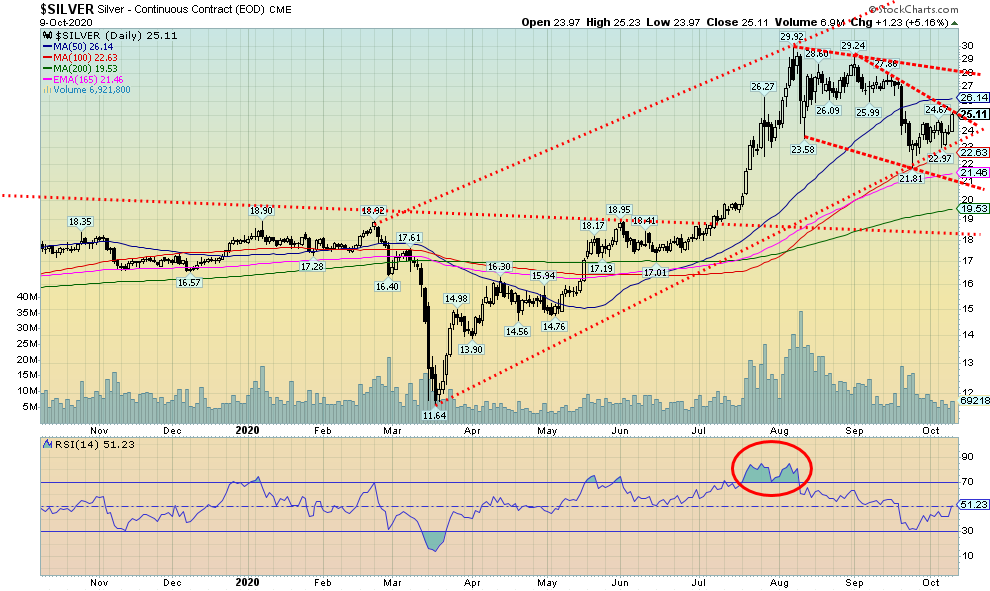
After falling to $23 on Tuesday, silver prices surged on Friday, gaining $1.23 or 5.2% and closing over $25. On the week, silver was up 4.5% leading the way. The gold/silver ratio fell to 76.7 but is still above the recent low of 68.6. A firm breakdown under 70 would be quite positive and could see the gold/silver ratio fall to as low as 35. At that point, silver would be expensive compared to gold. What’s key is that the bull market underway continues. Silver could be in a descending wedge pattern. We appear to be on the cusp of potentially breaking out above it once we clear $25.25 with a confirmation close above $26. Potential targets could be up to $32.50/$33.00. Above $28 there is further potential for a rise to $36. While there are many calling for silver prices to rise to $50, $100, and even beyond we only project what we can see at the time. And we do not ignore the downside even if we believe we won’t break to the downside. But, obviously, new lows below the Sep 24 low at $21.81 could see silver fall to $14. We doubt that very much given the strong fundamentals, but we don’t want to ignore it until we firmly confirm the upside breakouts. In a bull or bear market we prefer to see silver leading so the recent gains of silver vs. gold is welcome However, we remind everyone that gold has made new all-time highs over $2,000 while silver is still only half of its all-time high at $50.
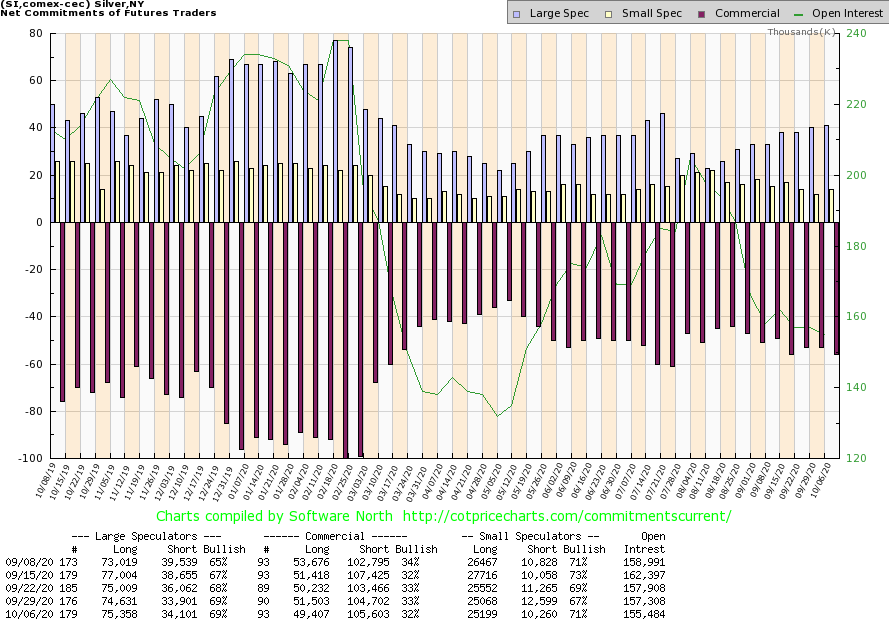
The silver commercial COT is not helping us as it slipped this past week to 32% from 33%. Long open interest fell about 2,000 contracts while short open interest rose roughly 1,000 contracts. The large speculators COT was flat 69%. Despite the 4% up week, total open interest was off marginally. However, this report only goes to October 6 so it doesn’t include the big gain seen on Friday. Next week’s report will capture most of this past week. We hope to see an improvement with rising open interest.
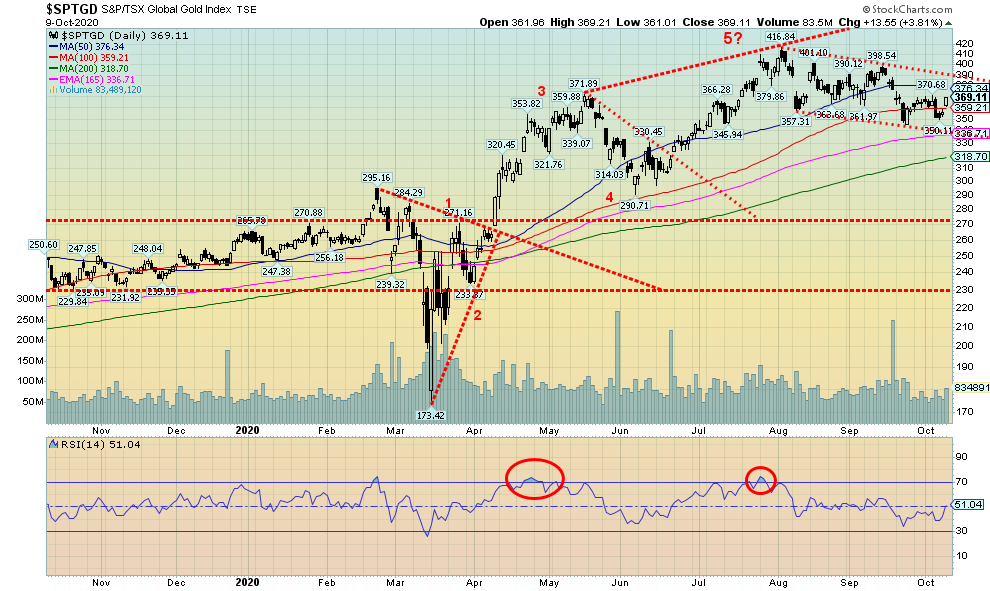
Gold stocks tried to sink in the early part of the week but then rebounded when gold and silver shot back up. By the week’s end the TSX Gold Index (TGD) had gained 2.1% on the week and the Gold Bugs Index (HUI) was up 4.8%. The result was that the TGD held above a support line near 340 (actual low on the week was 350), but we are still looking up at the breakout line at 390. It is possible that we made our final low for this correction near 346 on September 24, but until we break out above 390, we can’t eliminate the potential for another move up followed by yet another move to the downside. This correction has seen some 17% shaved off the TGD from the recent high to the low. That’s not unusual for gold stocks whose volatility is well known. The March 2020 collapse saw the TGD fall 41% and the May/June correction saw the TGD lose almost 22% at its worst. The 2008–2011 bull market saw the TGD go through three roughly 25% corrections. Yet, since that key low in September 2018 at 147, the TGD has gained over 150% and we are up 113% from the March 2020 low. The great bull market of 2008–2011 saw the TGD gain roughly 200%. Wide swings on gold stocks are not unusual, given how small the market really is. If and when the TGD manages to break out over 390, potential targets are up to 460 with further potential to 500, depending on how powerful the move is. A move to 460 would be a new all-time high for the TGD, taking out the 455 seen in 2011. But until we do break out over 390, we can’t ignore the downside. A breakdown under 350 would be negative. A breakdown under 335 would be potentially dangerous and we could see the TGD could fall to 265. The 200-day MA is currently at 318, the June 2020 low was at 290, and there is potential major long-term support near 265/270. The pattern appears to us to be a bull flag, but we can never dismiss the downside until we firmly take out the points to the upside.
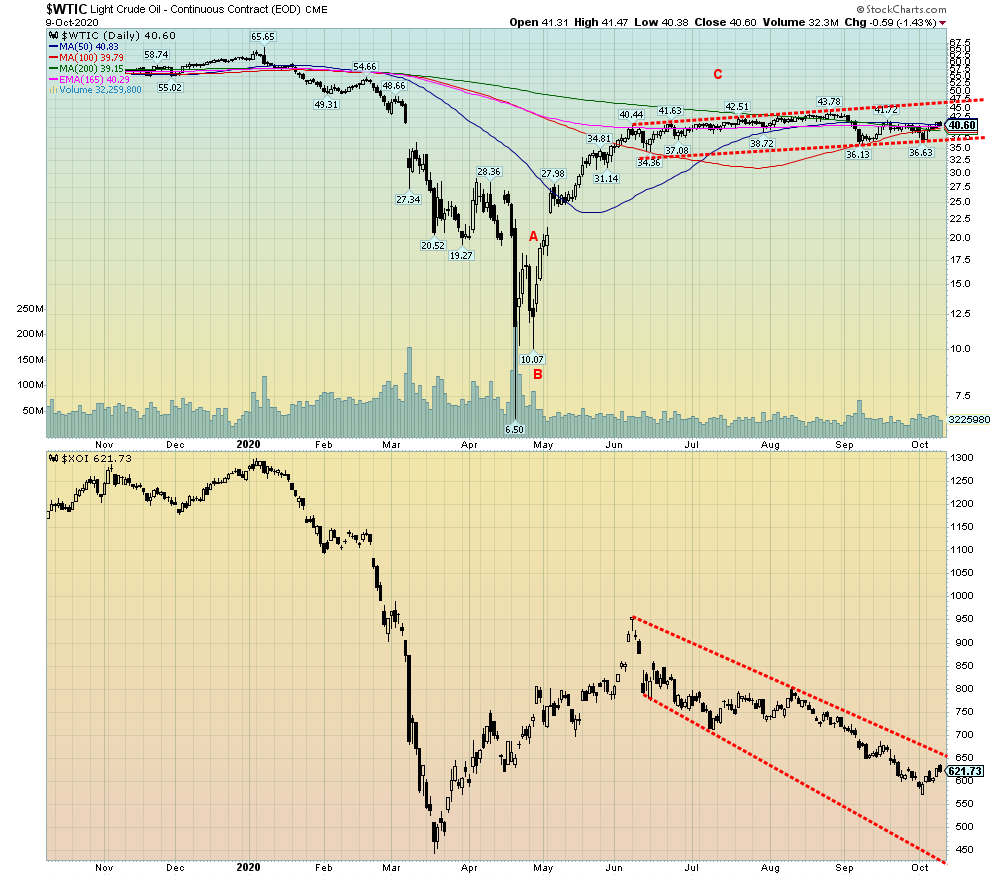
Volatility still seems to dominate, even the oil market. The previous week saw WTI oil plunge below $37 after it was announced that Trump had come down with the COVID. Then, this week, Hurricane Delta was shutting down 90% of the Gulf oil production. The result was that oil prices climbed back over $40, gaining 9.6% on the week. The Gulf shutdown also helped natural gas (NG) as it rose even more, up 12.6% on the week. The energy stocks caught a bid as the ARCA Oil & Gas Index (XOI) rose 4.9% and the TSX Energy Index (TEN) spiked 8.6%. Nothing like a little hurricane to help this beaten-up sector.
So, will this last long? WTI oil can’t seem to break down but it can’t seem to break out to the upside, either. It is just caught in a see-saw range of roughly $36 to $43/$44. And, once again, here we are at about mid-point. Given that oil has probably priced in the slowing economy and seems impervious to the U.S. election not showing any predilection to either candidate, this range trading is more likely to continue rather than break out either way. Naturally, we can’t dismiss the possibility of a breakout one way or the other. A downside breakout under $36 could target down to $28/$29 whereas an upside breakout over $44 could target up to $50/$51.
Saudi Arabia is a wildcard in the equation. Their production costs are so low that if they want to eliminate competition, they could absorb another sharp drop in prices even as it is known that they need around $80 to balance their extravagant budget. Low prices are, however, devastating for the already battered fracking industry and Alberta’s oil sands. Nobody is exactly exploring these days, either, as the world’s easiest accessible oil is already known and most discoveries are deep, underwater, or very dirty. Falling prices for clean energy are not helping oil.
Gasoline demand remains good but jet fuel demand is depressed. Unfortunately, they usually can’t produce one without the other. As a result, margins are squeezed. Hurricane Delta is playing havoc and the Venezuelan oil industry is in a state of collapse as we learned their rig count has fallen to zero. Despite everything, oil is not going to collapse and while it is causing budgetary constraints don’t expect Saudi Arabia, Russia, or any of the other Middle East oil producers to collapse. Even OPEC has acknowledged the potential for peak demand, but we are still several years away from that.
Our expectation is that this range trading is more likely to continue than result in a major breakout one way or the other. However, be prepared if the tide shifts.
Copyright David Chapman, 2020
Disclaimer
David Chapman is not a registered advisory service and is not an exempt market dealer (EMD) nor a licensed financial advisor. We do not and cannot give individualised market advice. David Chapman has worked in the financial industry for over 40 years including large financial corporations, banks, and investment dealers. The information in this newsletter is intended only for informational and educational purposes. It should not be considered a solicitation of an offer or sale of any security. The reader assumes all risk when trading in securities and David Chapman advises consulting a licensed professional financial advisor before proceeding with any trade or idea presented in this newsletter. David Chapman may own shares in companies mentioned in this newsletter. We share our ideas and opinions for informational and educational purposes only and expect the reader to perform due diligence before considering a position in any security. That includes consulting with your own licensed professional financial advisor.
—
(Featured image by Martin Sanchez via Unsplash)
DISCLAIMER: This article was written by a third party contributor and does not reflect the opinion of Born2Invest, its management, staff or its associates. Please review our disclaimer for more information.
This article may include forward-looking statements. These forward-looking statements generally are identified by the words “believe,” “project,” “estimate,” “become,” “plan,” “will,” and similar expressions. These forward-looking statements involve known and unknown risks as well as uncertainties, including those discussed in the following cautionary statements and elsewhere in this article and on this site. Although the Company may believe that its expectations are based on reasonable assumptions, the actual results that the Company may achieve may differ materially from any forward-looking statements, which reflect the opinions of the management of the Company only as of the date hereof. Additionally, please make sure to read these important disclosures.


Biotech Booster: €196.4M Fund to Accelerate Dutch Innovation
The €196.4 million Biotech Booster fund in the Netherlands supports scientists and research teams to turn biotech innovations into market-ready...


Why the iGaming Industry Offers Some of the Best ROI for Affiliate Marketers
iGaming affiliate marketing offers high earnings through RevShare (up to 60%) and CPA ($50–$550), far exceeding e-commerce. Key advantages include...


Ripple and Mercado Bitcoin Expand RWA Tokenization on XRPL
Ripple advances its RWA ambitions with Mercado Bitcoin tokenizing $200 million in fixed-income and equity assets on XRPL. This deepens...


Soybean Market Reacts to Trade Hopes, High Stocks, and Global Price Pressure
Soybeans and Soybean Meal rose on hopes of a U.S.-China trade deal, though Soybean Oil fell. Lower Brazilian prices and...


Legal Process for Dividing Real Estate Inheritance
Dividing inherited real estate involves more than legal steps—it's strategic. Recent reforms ease probate and offer tax breaks, but proactive...
 |
|
 |  |
 |
|
-

 Crypto7 days ago
Ripple Launches EVM Sidechain to Boost XRP in DeFi
-

 Africa2 weeks ago
Côte d’Ivoire Unveils Ambitious Plan to Triple Oil Output and Double Gas Production by 2030
-

 Impact Investing2 days ago
Shein Fined €40 Million in France for Misleading Discounts and False Environmental Claims
-

 Business2 weeks ago
The TopRanked.io Weekly Digest: What’s Hot in Affiliate Marketing [NordVPN Affiliate Program Review]