Featured
Panic at the FOMC!
Far off the public’s radar screen Mr Bear is attacking tooth and claw a financial bubble created by the FOMC’s “monetary policy.” Possibly in the OTC derivative market, where the consequences of a deflation-in-valuations can rise to a few hundreds-of-trillions of dollars in specific performance issues for Wall Street. Most bonds are issued with an interest rate derivative “bundled” with them.

Usually, I begin my weekly articles with a chart of the Dow Jones; but not this week! This week the Federal Reserve’s “monetary policy” takes top billing as its weekly change in US Treasury Debt Holdings’ * 10Wk Moving Average * went from 18.23 billion up to 82.66 billion IN JUST TWO WEEKS (chart & table below).
NOW THAT’S WHAT I CALL “POLICY MAKING!”
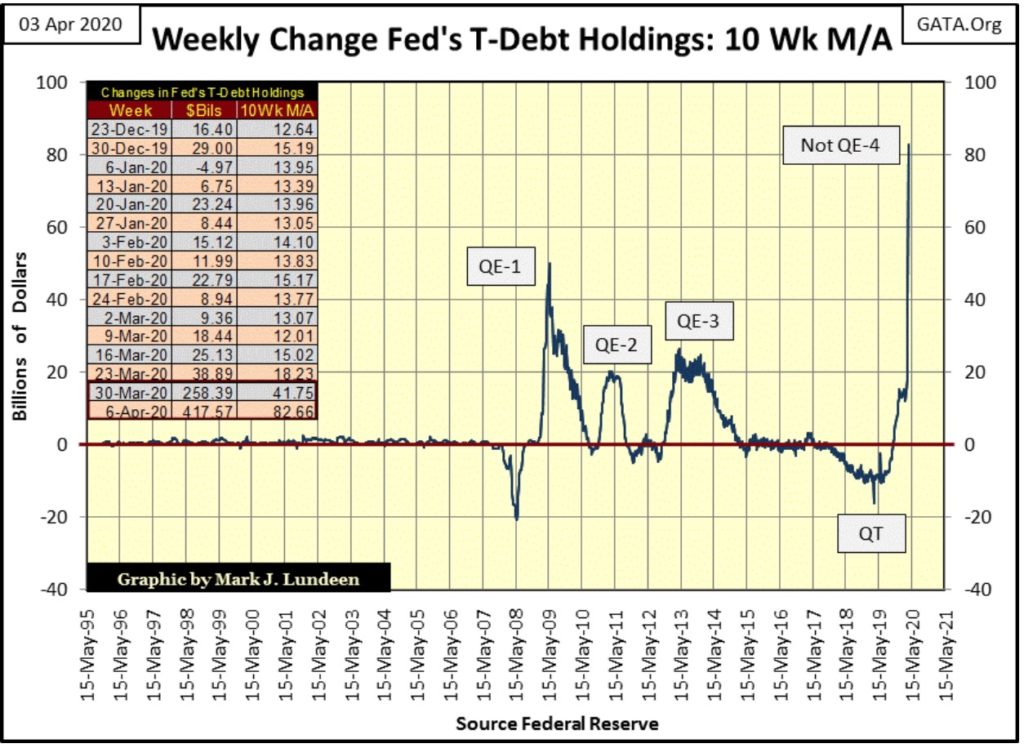
But the “policy makers” themselves modestly claim they are simply addressing a global shortage of US Dollars.
Reality Flash: except for the average American wage earners and pensioners’ savings accounts, there isn’t a shortage of US dollars anywhere in our solar system. The problem is all these dollars were the result of debt creation by the Federal Reserve System; so many that now debt service for these dollars are overwhelming the world’s economy, now stricken by the coronavirus pandemic, to pay its debts.
Here’s a quick video of Downtown Minneapolis, Minnesota. So many businesses have shut down during the coronavirus pandemic that wild turkeys now roam wild and free during business hours.
This results in the Federal Reserve System to resort to “Zombie Finance”; where insolvent corporations, hedge funds and other Too-Big-To-Fail Entities that should have been liquidated long ago are given additional credits (debt) to service past debts to maintain a fiction of normality in the financial system. But any pretends of solvency thus created is only a fiction, whose expense is paid for by everyone who values their net worth in terms of the currency being inflated to a state of worthlessness; in this case the US dollar.
Yep, no “dumb” farmer, plumber or salty old-sea dog (such as myself) WOULD EVER, COULD EVER do something this stupid – we’re not that smart!
If dummies like us dominated the FOMC during its open-market meetings we’d turn off the computers, fire up some big Cuban cigars, crack open a few bottles of 100 proof Kentucky bourbon and play poker with huge stacks of $100 Federal Reserve Notes until it was time to go home.
And when the big Wall-Street banks called for a little “injection-of-liquidity” from the FOMC, as they always do, we’d tell our secretaries to inform the banksters we were out fishing today and won’t be back until tomorrow, or possibly the day after. As far as “monetary policy” goes, this would be pretty lame stuff, but ultimately everybody would be better off for it.
Unfortunately, that isn’t what happens at the FOMC. Nope, in these charts you’re looking at the consequences of having the brilliant minds of the elite of the Ivy League’s Schools-of-Economics setting their meat hooks deep into America’s money supply, and they have been having their way with our money and markets for decades.
These people are “the policy-makers”; meaning they operate in a realm far above the laws of God and man, yes in the facilities of Harvard, Yale, and Princeton. If Mr Bear wants to deflate one of their bubbles – well screw him. Our “best & brightest” will just do what they’ve been doing since August 1971 when they decoupled the US Dollar from the Bretton Wood’s $35 gold peg; “inject” a little “liquidity” into the financial system.
You can believe this is exactly what is happening now, but now on a massive scale. Far off the public’s radar screen Mr Bear is attacking tooth and claw a financial bubble created by the FOMC’s “monetary policy.” Possibly in the OTC derivative market, where the consequences of a deflation-in-valuations can quickly rise to a few hundreds-of-trillions of dollars in specific performance issues for Wall Street.
Most, if not all bonds today are issued with an interest rate derivative “bundled” with them, attached to the bond as a fire insurance policy is to a home with a mortgage. But as we discovered during the sub-prime mortgage debacle, unlike insurance companies that maintain reserves to pay off claims on their insurance policies, the big Wall Street banks just pocketed the fees from their interest-rate derivatives. In 2008 when the big banks couldn’t service their derivative obligations in the mortgage market, they got bailed out by the Federal Government and the Federal Reserve.
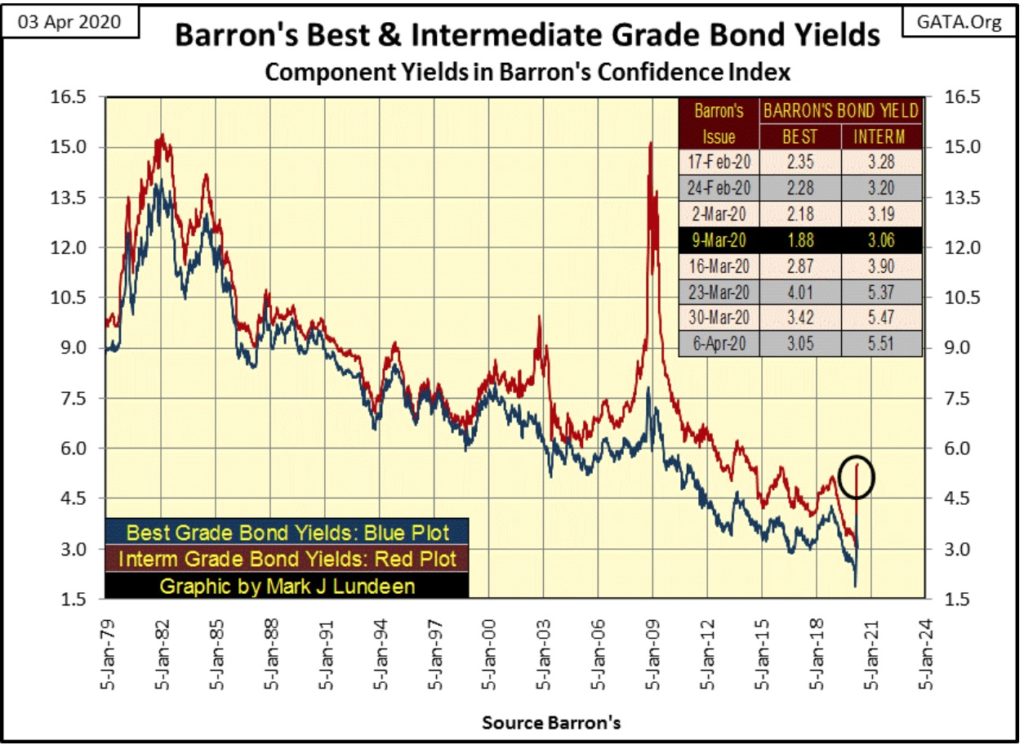
There are reasons to believe a similar situation is reoccurring today. Looking at Barron’s Best and Intermediate Grade Bond Yields below, they bottomed in Barron’s 09 March 2020 issue and have been rising since. Seeing such a sharp spike up in bond yields is a big-red flag the “policy-makers” are growing weaker, as Mr Bear is gaining strength as counterparty risks in the interest-rate derivative market grows.
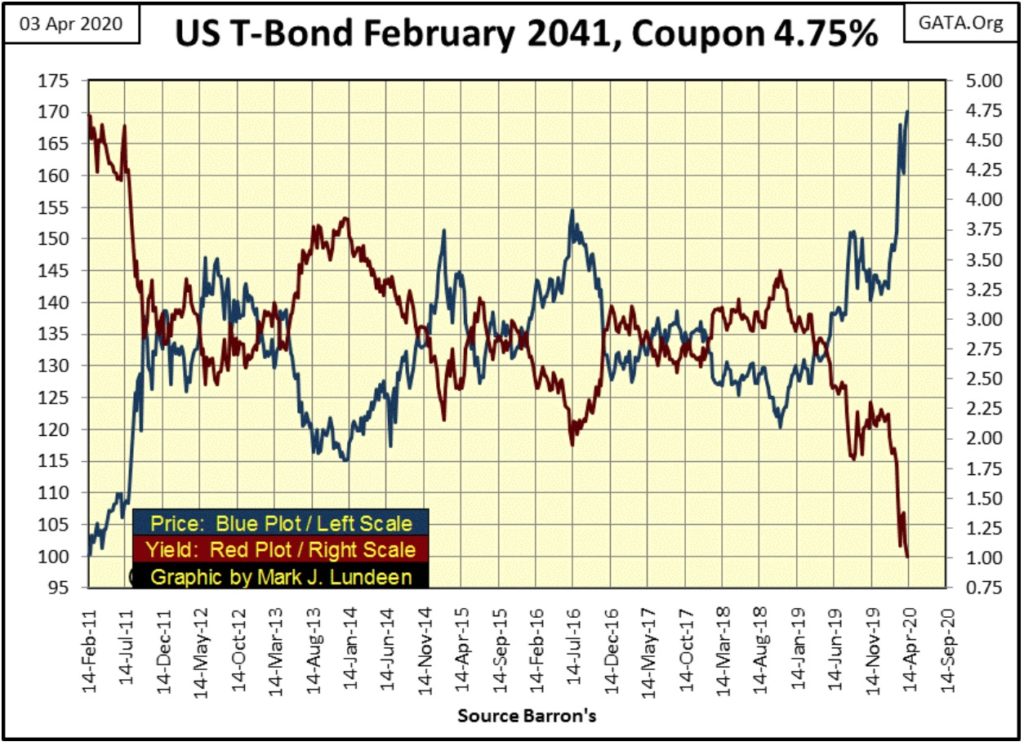
Here is a T-bond with 21 years to maturity. Let’s call it a 20-year bond, and any 20-year bond yielding only 1.00% in this monetary environment isn’t going to be yielding only 1.00% for long.
I hear talk that the FOMC being “forced” to take interest rates negative in the Treasury market. They can talk all they want about doing that, but should they attempt to make good on such babbling, there will be hell to pay elsewhere in the financial system.
I have a table giving the weekly data in these charts of the Federal Reserve’s balance sheet. In this article’s first chart I’ve plotted the 10Wk M/A. But in the table, I’ve also listed the weekly changes since Barron’s 23 Dec 2019 issue. In the last two weeks, the FOMC has expanded its holdings of US Treasury Debt by 675.96 billion dollars, or over half a trillion dollars, as seen in the chart below plotting the actual weekly changes.
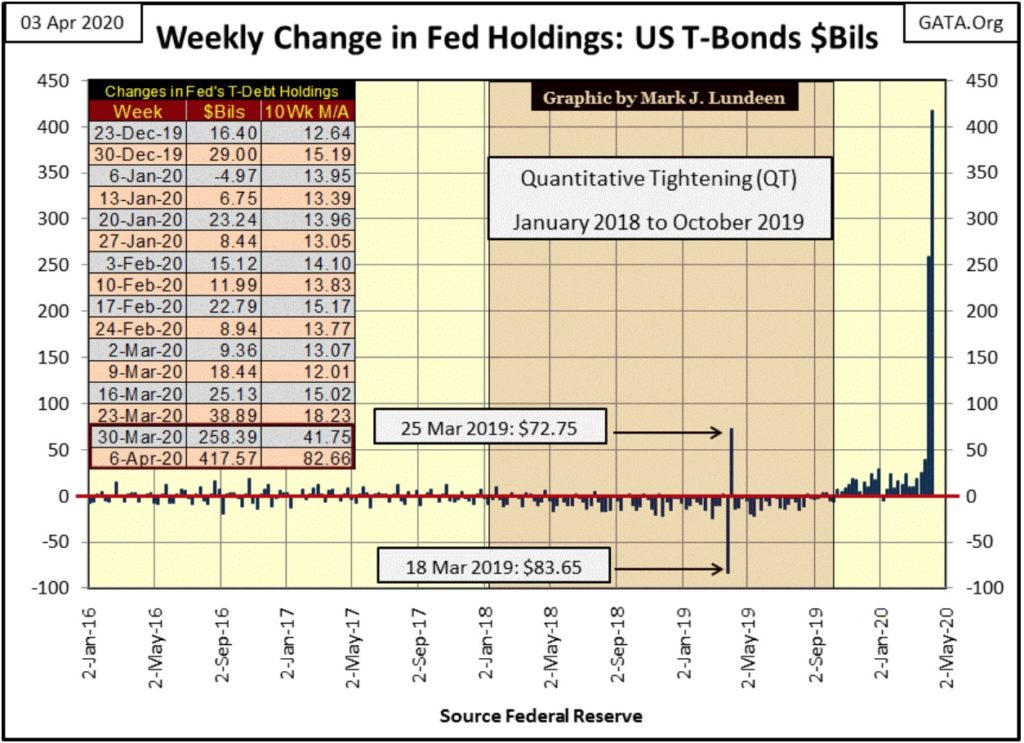
The effects of this current round of “policymaking” on the Federal Reserve’s balance sheet (chart below) is alarming. These past TWO WEEKS have seen more “liquidity injected” into the financial system by these monetary maniacs than the FOMC had in the entirety of its QE-1 during the crisis months of the sub-prime mortgage bear market.
Why are they doing this? Simple – the FOMC is papering over the rot in corporate America’s balance sheet, which includes its banking system. So, they’re panicking for absolutely good reason; Mr Bear is finally coming for them and they don’t know what else to do.
The blue T-Debt holdings plot below is a bit misleading as the red Total Fed Credit overlays it. As seen below, apparently only the Total Fed Credit plot is in record territory, but that is not so. If you look at the table in the chart, the Fed’s holding of T-debt closed the week at $4.604 trillion, also a new all-time high.
The problem with these plots conflicting is these huge-historic advances occurred during an incredibly brief, two week period. If next week we see more of the same, you can be sure a historic-market event that will be long remembered is close at hand.
By the time the mainstream financial media begins covering this panic in “policy”, it will be too late for their audience to do anything to protect themselves from it; like buying some gold and silver, assets with no counterparty risks.
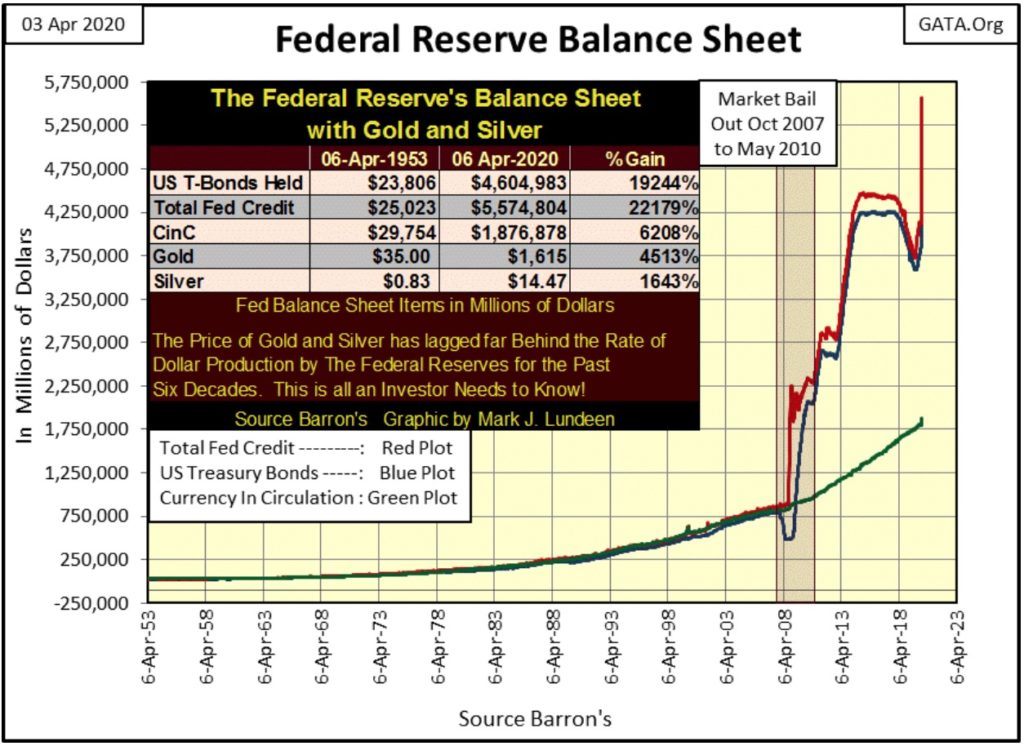
So, what’s the red Total Fed Credit plot? Total Fed Credit is:
- the Fed’s holdings of T-Debt;
- and everything else they’ve “monetized;”
such as mortgages, and most likely corporate and municipal bonds too. How else would corporate bond yields be so low, and bond prices so high? The Federal Reserve System is “stabilizing” the financial system by purchasing debt, as it inflates the dollars these bonds are payable into nothing.
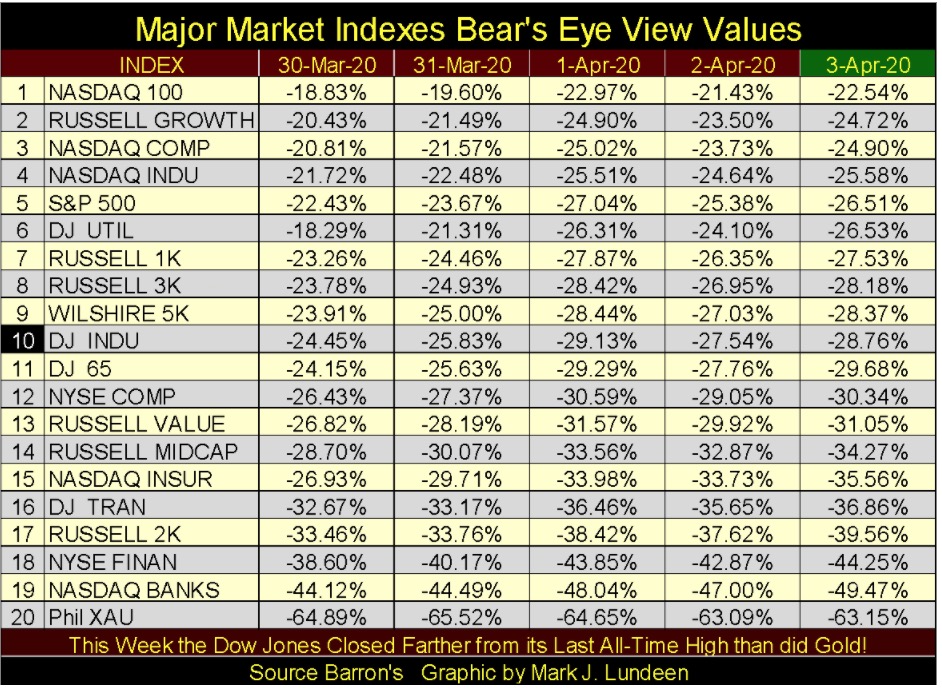
Let’s look at the Dow Jones’ BEV chart along with its 8 count below. The Dow Jones closed the week at a BEV value of -28.76%. However, had the FOMC not “injected” the ocean of “liquidity” it had these past two weeks, I wonder whether it would have closed this week above or below its BEV -40% line.
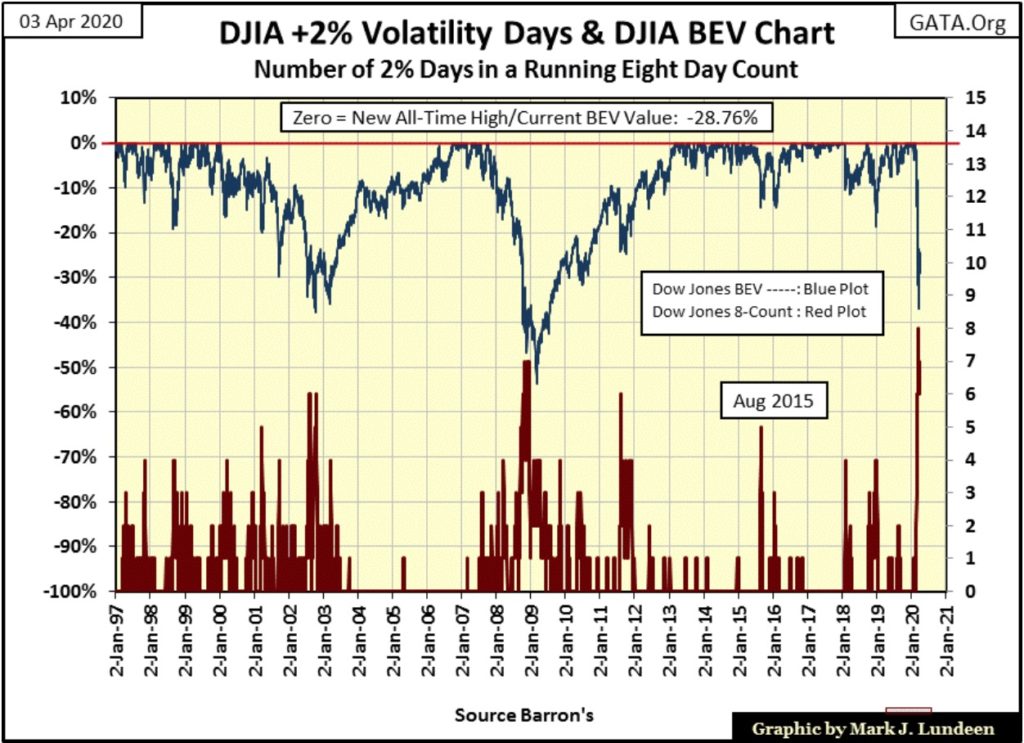
The Dow Jones’ 8 count closed the week at 6, and its 200 count at 28, as seen in Mr Bear’s Report Card below.
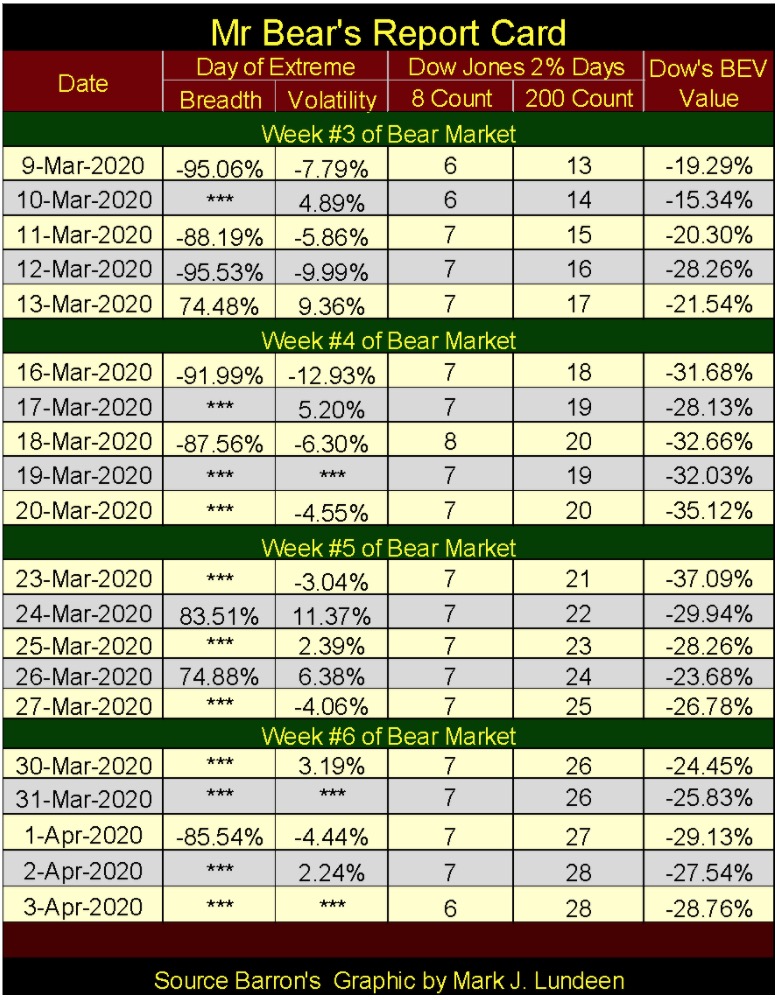
Looking at all the days of extreme market breadth and volatility in these past two weeks, it’s remarkable the Dow Jones closed below its BEV -35% line only once; on Monday, March 23rd. This market strength in the face of something we are not yet aware of (but the “policy-makers” wrestle with daily) is only temporary.
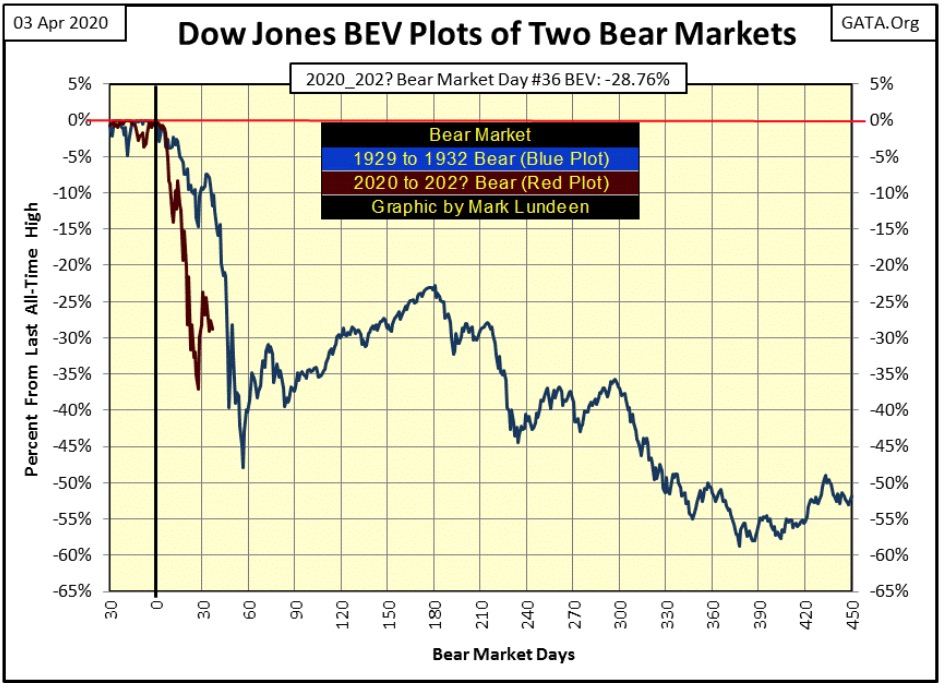
Before this bear market sees it ultimate bear-market bottom, I expect we’ll see the Dow Jones, along with the rest of the stock market well below their BEV -70% lines. During the Great Depression market crash, the Dow Jones didn’t deflate below its -70% BEV line until day 606 (19 Sept 1931), two years into the bear market.
Looking at how the FOMC has so far responded to this bear market, I don’t think we’ll have to wait two years before we see the Dow Jones decline by 70% from its last all-time high. I wouldn’t be surprised seeing that as Mr Bear’s 2020 Christmas present to the market – a Dow Jones’ Christmas Eve closing below its BEV -70% line. That’s not a prediction; only a fear I wrestle with nightly when all the lights go out.
Look at the BEV plot comparison between ours and the Great Depression’s bear market below – in 2020 Mr Bear is in a hurry. Day 36 of the Great Depression Bear Market (16 October 1929) the Dow Jones closed at a BEV of -11.82%. Our bear market closed at a BEV of -37.09% on day 27 (23 March 2020), and the dead-cat bounce I talked about these past few weeks has so far been pathetic.
Here are the daily BEV values for the major market indexes I follow.
I hate being so bearish. It’s much more fun being a bull, being optimistic of the future. But I fear I can’t do that with the stock market until we see all these indexes with BEV’s of -70% and much lower.
One market group I can recommend is the gold and silver mining companies in the XAU, as well as many other precious-metal mining companies not included in the XAU.
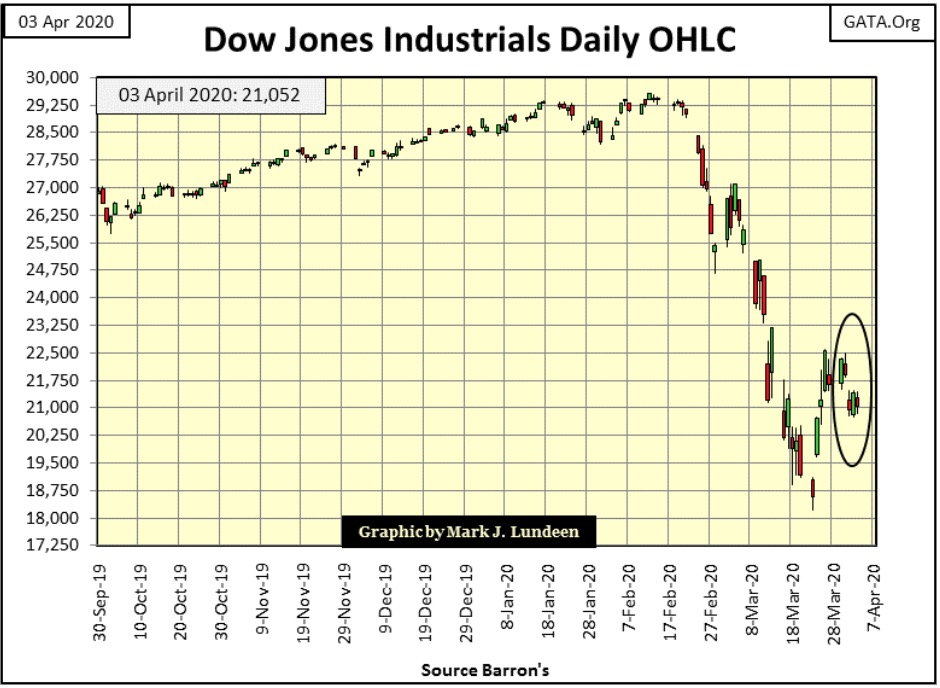
The Dow Jones in daily bars is next. What you are looking at here is historic.
Before February 21st we see normal bull market volatility; the daily ups and downs of a historic market advance in little steps. Then on February 24th stock market volatility went absolutely berserk, and that is never good for the bulls.
In fact, it’s not usually good for the bears either. Mr Bear shows no favoritism; be ye bull or bear, the big-furry fella is only happy when investors and speculators take losses. If you are going to take a stake in this market; be careful.
Writing about the stock market and looking at the criminality published weekly by the Federal Reserve and their diabolical “monetary policy” makes me sick. After sixteen pages of text and graphics of that BS, it’s time for me to move on to gold and silver to cheer up this week’s writings.
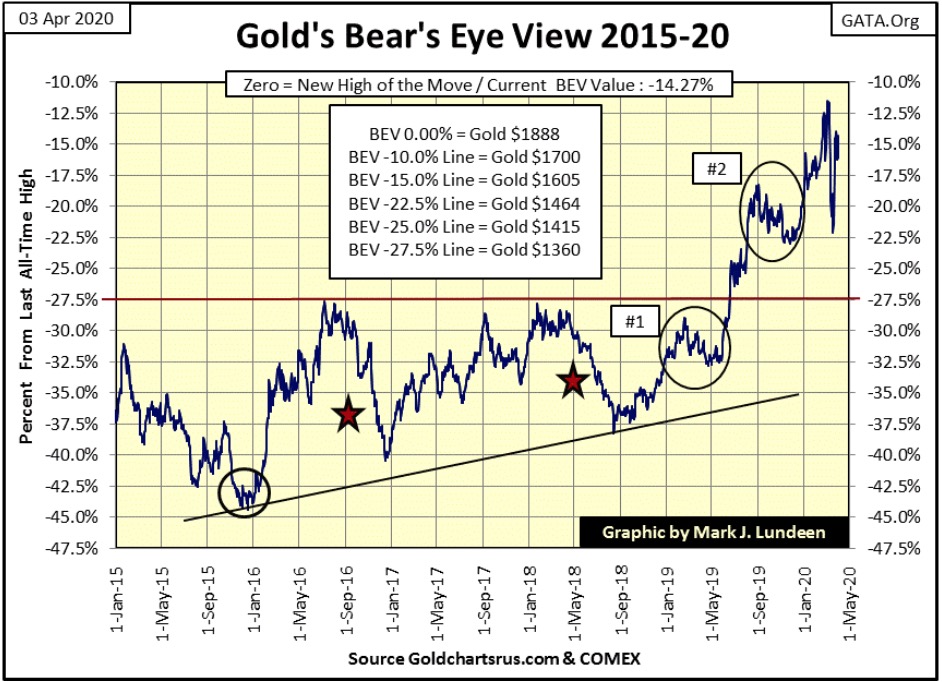
What joy! Gold closed the week only 14.27% from making a new all-time high, or $1619 in dollars. Of course, that’s the price of gold from the COMEX futures market, which isn’t much of a price at all for one of the old-monetary metals in a world where its “monetary-policy makers” can “inject” over a half a trillion digital-dollars into the financial system in only two weeks.
But gold remains far above where it was a year ago; below its Red BEV -27.5% line ($1360), where it was exiled by the gold cartel for six long years. But those were the bad old days. Things are getting better now for holders of gold and silver.
Do you know who is the biggest bull in the gold market? It’s Mr Bear!
He knows full well the dreadful consequences for the “policy-makers” should gold spike up to, say $5000 an ounce and silver trade for over $200; so we can depend upon that happening sometime in the future. Seeing how in March, April 2020 the FOMC is currently blowing out their balance sheet, multi-thousand dollar gold prices are quite possible before 2021 arrives.
That plus for decades the big banks have been selling the same ounce of gold in their inventory to 100 or more gullible investors, who then are charged by these same banks to hold their fictional bullion. The day is coming when these people will demand their gold, wanting to take it home with them, which for 99 of the 100 will be impossible.
It’s only a matter of time before this criminality is fully exposed to the world. And on that day, no gold or silver will be exchanged for paper money anywhere in a world where one either has, or doesn’t have any precious metals assets.
What happens then? The gold and silver miners will be appreciated by investors as never before. Yes, they will be settled in dollars when traded, but the advances in the miners should keep up, or possibly exceed the hyper-inflation to come.
No matter what is to come, people will still need dollars to pay their expenses, and I prefer to sell shares in a gold mine for dollars than actual gold at a time like that to fund my living expenses. So yes, I still like the gold and silver miners as investments in today’s markets.
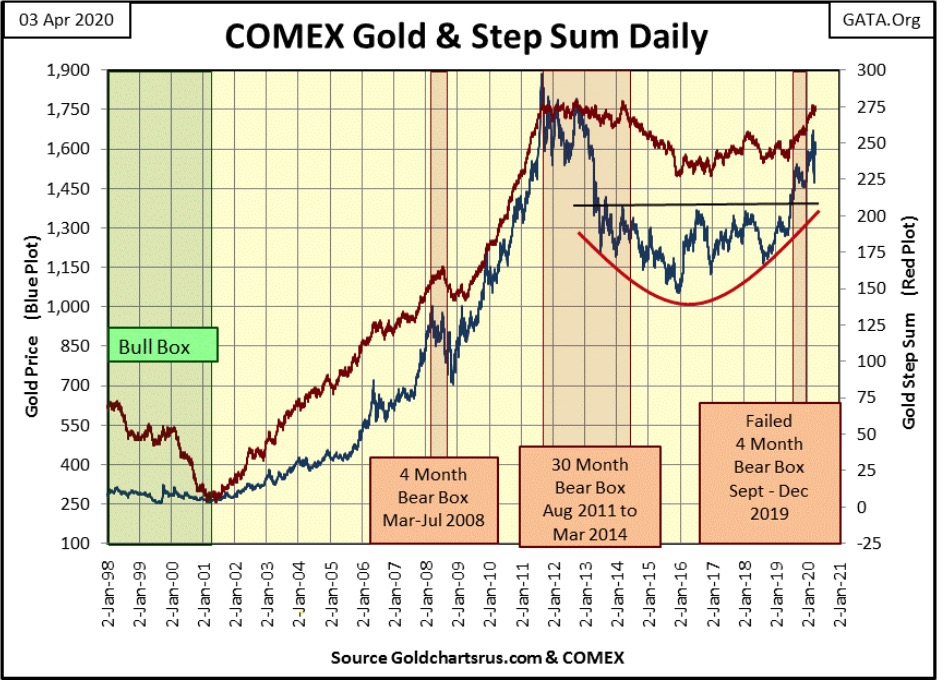
Here’s gold and its step sum chart. Like gold’s BEV chart above, its step sum chart is also something to be positive about. I don’t know when this tsunami of “liquidity” flowing from the Federal Reserve, seen in the first charts of this article, will strike into the gold and silver markets. But when it does, it will be historic.
I’ll enjoy watching the clueless financial-media channels explain to their viewers the five Ws of journalism: the Who, What, When, Where and Why gold is advancing several hundreds of dollars daily when for decades these financial commentators have ignored and censored anyone willing to tell the truth.
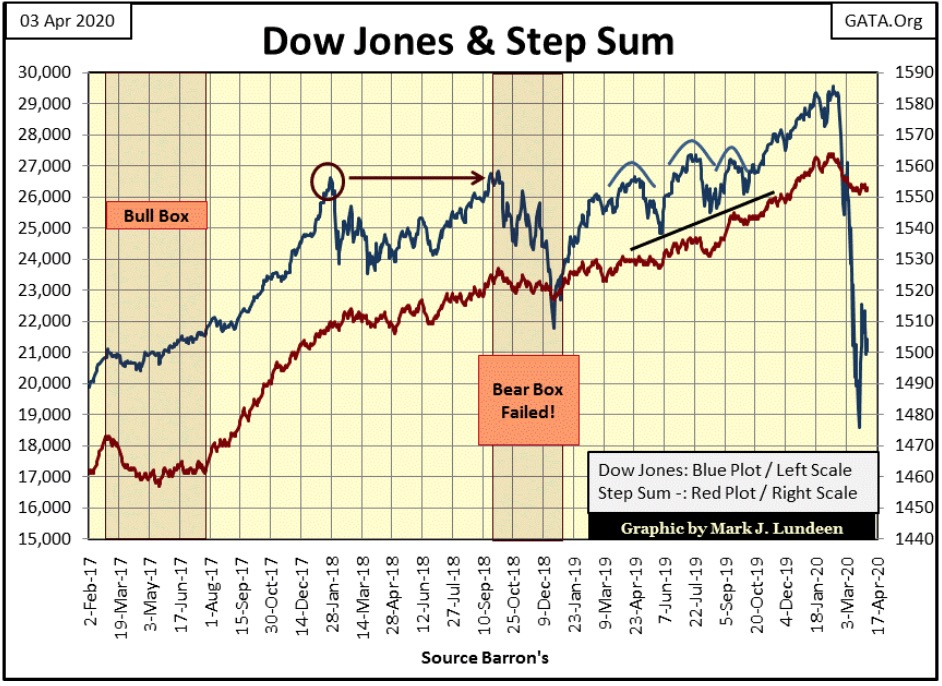
Here’s the Dow Jones and its step sum. This is so depressing, and to think I’ll have to continue covering the old bull market’s funeral proceedings for the next few years; uggh!
Gold, in its step sum table below, is bouncing back from a little correction it’s seen since March 18th when its 15 count fell to a -7. A 15 count can run from +15 down to a -15, but double-digit 15 counts are rare market events, as seen in the table below. Since December 1970 gold’s 15 count has closed at a double-digit (+ or -) in only forty-three daily closings, and none of those were a 15 count.
Gold closed with a 15 count of -7 in only 305 daily closings since December 1970, and that typically is as oversold as the gold market has gotten these past four decades.
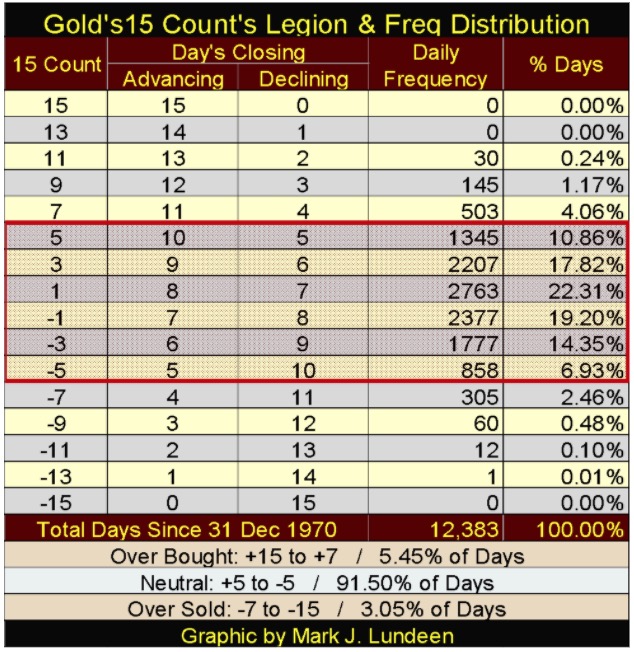
So I’m not surprised seeing the price of gold bounce off of this -7 15 count, rather than for it to go on to a -9 count on further declines in price. Since December 1970, how many days did gold’s 15 count close at a -9? Only sixty days, so seeing a -7 is pretty much a solid sign of a market turn around.
Volatility in the price of gold is rising, which is good for gold and silver, if not the Dow Jones. And it appears that gold’s step sum is now ready to once again advance above its current 275. As it rises it should take the price of gold along with it.
But, as it was once explained to me: the world is round; not for a day was it ever fair. So, if the “policy-makers” machinations in the COMEX gold and silver futures markets continue to be successful, maintain a positive attitude about it knowing that this too shall pass.
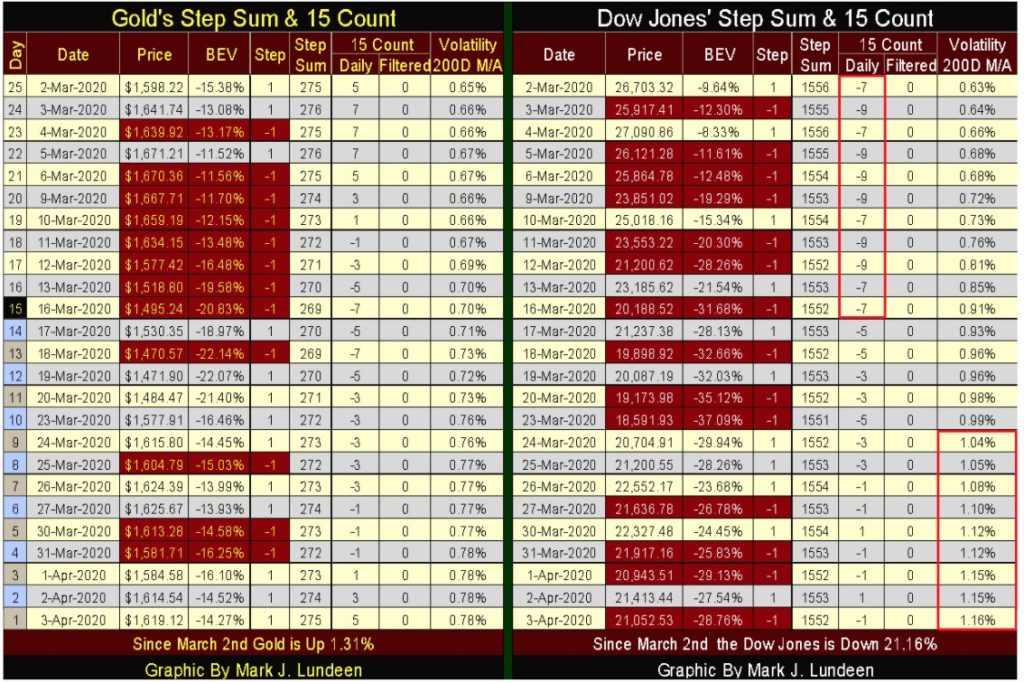
But the Dow Jones is another story; it’s currently in a once in a generation deflationary collapse, and how much longer it can maintain a BEV value in the -20%s is the question in my mind.
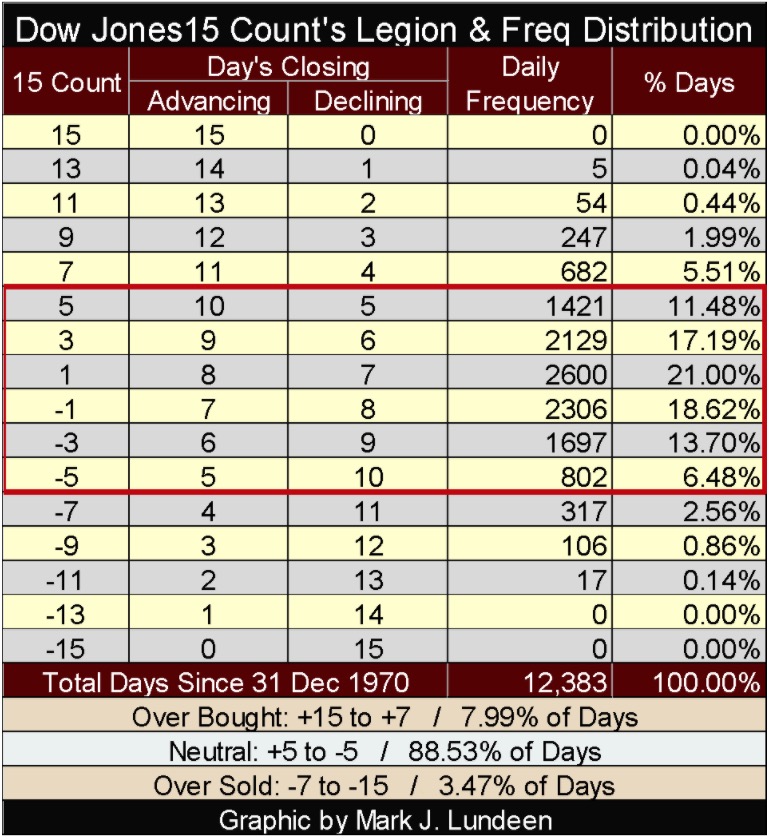
The Dow Jones 15 count has remained between +5 and -5 since March 17th, but as with gold, that’s usually true for the Dow Jones for the bulk of daily closings in any bull market advance or bear market decline. Until the 15 counts rise to a +/- 7, I consider these mid-range counts to be primarily market noise to be ignored.
But look at the multiple -9s 15 counts the Dow Jones saw in early March (table above). Such a low count has only happened 106 times since December 1970 (table below), so the stock market was extremely oversold just a few weeks ago. If we were in a bull market, the Dow Jones should have seen a nice bounce from such an oversold condition; but that hasn’t happened. So I continue thinking further bear-market deflation to come.
But what we can’t ignore in the Dow Jones step sum table above is how its daily volatility’s 200-day moving average closed the week at 1.16%, almost doubling in the twenty-five days seen in the table above. This is very bearish.
I wonder if my readers fully appreciate the unprecedented nature of our current markets? For the first time our “policy-makers” are quickly running out of options to maintain the decade-long fictions most people now confuse to be the financial markets.
Soon all will be exposed: that evil people have twisted America’s free markets into a historic scam on the public, and the government’s “market regulators” and mainstream-media outlets were complicit in the bamboozling of hundreds-of-millions of investors and citizens.
I don’t know how this will turn out, except I know it will end badly for most people. None of us will escape unscathed from Mr Bear’s coming mauling. All we can do is to trust in the Lord, and pray that justice is done and any hardship in the coming days to the victims be brief. After seeing how humanity’s best and brightest have treated those less gifted, I’ll trust in the Lord any day before I’d trust people in power controlling the government.
I do think I’ll make an exception of the above for President Trump. All the right people hate him with a passion. Should the Marine MPs ever go out to arrest people like the Clintons and take them down to Gitmo for a military tribunal, I’d support him 110%. The only issue I’d have would be why did it take so long?
—
(Featured image by Lorenzo Cafaro from Pixabay)
DISCLAIMER: This article was written by a third party contributor and does not reflect the opinion of Born2Invest, its management, staff or its associates. Please review our disclaimer for more information.
This article may include forward-looking statements. These forward-looking statements generally are identified by the words “believe,” “project,” “estimate,” “become,” “plan,” “will,” and similar expressions. These forward-looking statements involve known and unknown risks as well as uncertainties, including those discussed in the following cautionary statements and elsewhere in this article and on this site. Although the Company may believe that its expectations are based on reasonable assumptions, the actual results that the Company may achieve may differ materially from any forward-looking statements, which reflect the opinions of the management of the Company only as of the date hereof. Additionally, please make sure to read these important disclosures.

-

 Biotech7 days ago
Volatile Outlook for Enlivex Therapeutics as Investors Await Clinical Catalysts
-

 Impact Investing2 weeks ago
Inter IKEA Launches Electric Truck Fleet to Decarbonize Heavy-Duty Logistics in Italy
-

 Markets2 days ago
Weather-Driven Supply Outlook Lifts Coffee Markets in Brazil and Vietnam
-

 Markets1 week ago
Cotton Market Weakens Amid Demand Concerns and Bearish Trends


