Featured
Trading basics: What is the simple moving average?
Brush up on your trading strategy knowledge and find out what a simple moving average is, and how it works.
The simple moving average (SMA) is probably the most basic indicator that traders have, but it has a lot of uses. Partially because of this, it’s one of the most universal indicators, and as such becomes something of a self-fulfilling prophecy.
The market moves on consensus, so if there is something that everyone is following, then the mere fact that everyone is following that thing makes it predictive. For example, if everyone is using the SMA to figure out when the market will go up, then when the SMA shows a positive move in the market, the market will go up because there are enough people buying into it to push it higher.
These concentrations of traders at certain points evidently can have an otherwise unexpected impact on the markets, so even if you are doing fundamental analysis, it’s important to know some of the big indicators that traders use. Also, it’s quite useful to know how to trade with them, so you can understand what other traders are doing when they concentrate at a certain spot.
The levels
In forex, the most commonly followed SMA is on the daily chart, and it’s the 200 SMA. You will often find it discussed in the financial press because it is closely followed by most major trading firms. The daily 100 SMA is also used, though not as much—and in a similar fashion, so understanding the 200 SMA will explain the 100 SMA.
The logic is that a 200-day trend is pretty sold, and it takes a significant change to move the market off of it. And once the market has moved to the new trend, it will stick with it for quite a long time. This makes it a good time to reevaluate your position in the market, and even change strategy.
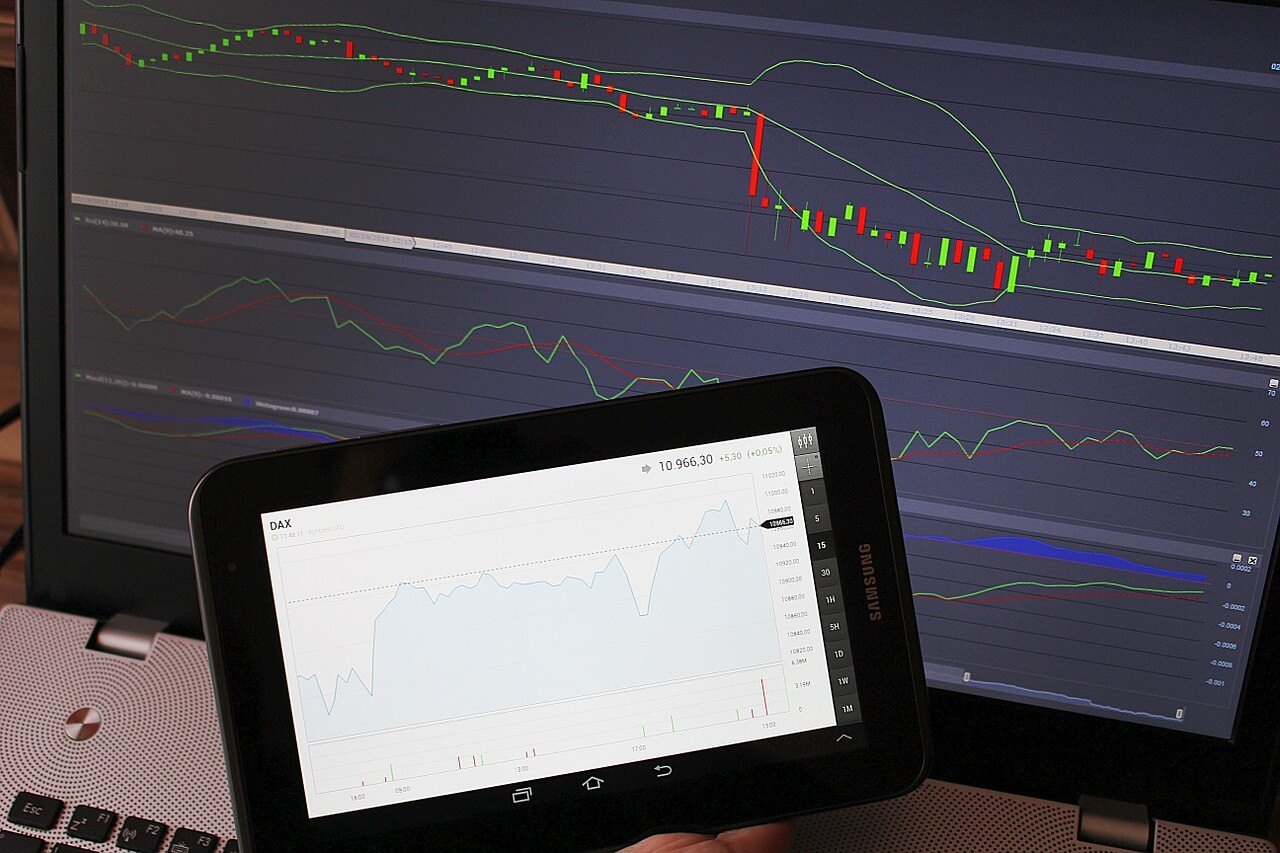
Forex traders often follow and use the 200 SMA daily chart. (Source)
Because of how the math works, it’s necessary for the market to cross through the SMA in order for it to change the trend; consequently, a cross of the daily 200 SMA is seen as a major market event. Typically, there is a lot of resistance/support around that level.
Order concentrations around the SMA
Many long-term traders will put their stop losses around the daily 200 SMA, following the logic described above—of course, adjusting them over time to keep with the trend. Also, there are day traders who are looking to profit from a likely bounce around the level. Even if no market reversal happens, you can still hit an increased amount of volatility around the level, as orders are triggered.
Because orders tend to congregate around the daily 200 SMA, this means that farther away from it, there are fewer orders, meaning the market can move quicker. When the market breaks the trend, most of the support/resistance has been exhausted—and there are going to be traders seeing it as a signal to get in on the expected market reversal. This can drive the market even when fundamentals or other technicals indicate otherwise.
Keeping an ear to the ground
Even if you aren’t planning on using the daily 200 SMA to trade on, you should keep it in mind when planning your trades. Have it somewhere present so you can be ready for when the market approaches the level.
—
DISCLAIMER: This article expresses my own ideas and opinions. Any information I have shared are from sources that I believe to be reliable and accurate. I did not receive any financial compensation for writing this post, nor do I own any shares in any company I’ve mentioned. I encourage any reader to do their own diligent research first before making any investment decisions.


The TopRanked.io Guide to 2026’s Biggest and Best Affiliate Opportunities
Want to earn affiliate commissions on literal billions of dollars worth of revenue? Then this week, we've got something special...


Eni Advances Energy Transition with Major Investment and Emissions Cuts
Eni showcased its “Just Transition” report in Rome, highlighting stakeholder collaboration and progress toward decarbonization goals. The company invested over...


The German Fintech Market Shows Resilience and Strong Investment Growth in 2026
Germany’s fintech sector remained resilient in 2026 despite economic crisis and rising insolvencies. Investments reached €14.2 billion, showing strong investor...


Cannabis Legalization in Germany: A Mixed Interim Assessment
Germany’s cannabis legalization has reduced criminal cases and eased pressure on the justice system, while the black market is slowly...


Sustainable Restoration of the Haus Hövener Garden in Brilon
The Brilon Construction Workers Association is restoring the Haus Hövener garden into a cultural community space, funded through a €10,000...
 |
|
 |  |
 |
|
-

 Crowdfunding7 days ago
Historic KiHa 2101 Railcar Restored in Japan Through Community Effort
-

 Fintech2 weeks ago
Barcelona Strengthens Its Position as a Southern European Fintech Hub
-

 Impact Investing4 days ago
EU Approves €23B Italian Renewable Energy Plan to Boost Climate Goals
-

 Biotech2 weeks ago
Early Use of Tirzepatide Shows Strong Results in Type 2 Diabetes Study
You must be logged in to post a comment Login