Featured
Stock market rises with cheers on employment rate; Bitcoin bounces back
Despite ongoing trade wars, the stock market goes up with considerable gains in employment. Bitcoin bounces back and trades strongly at $6,800.

“There is a crack, a crack in everything. That’s how the light gets in.” —Leonard Cohen, “Anthem,” 1992, from the album “The Future”
“Those who have knowledge, don’t predict. Those who predict, don’t have knowledge. ” —Lao Tzu, 6th century BC Chinese poet
“Prediction is very difficult, especially if it’s about the future.” —Nils Bohr, Nobel Laureate in Physics 1922
“I have seen the future and it is very much like the present, only longer.” —Kehlog Albran, “The Profit”
Forecasting is a mug’s game. Make a forecast, and then get mugged. But that doesn’t stop people from forecasting. It doesn’t matter who is making the forecast, from the weatherman to the economist. Forecasting is the process of making predictions about the future based on past and present data.
We have often looked at cycles. We have learned a lot about cycles by reading experts in the fields such as Ray Merriman, Martin Armstrong and Elliott Wave International. But even they were not the originators of the study of cycles. We have also read Samuel Benner (1832–1913), Charles H. Dow (1851–1902), R.N. Elliott (1871–1948), Nicolas Kondratieff (1892–1938), Edward Dewey (1895–1978), and, more recently, David McMinn (9/56 Year Cycle: Financial Crises) and Chris Carolan (The Spiral Calendar). There are many others as well, considered experts in their field. We are but mere followers.
Predicting the next recession, the next financial crash, or the next bear market can make you famous. But it is really no easy feat. For many, it seems random. Markets are based on fear and greed—emotions. There often appears to be no script. And what happens in one cycle does not necessarily predict what will happen in the next one. But there is a rhythm to markets. One of the best publications that look at stock market’s rhythms and cycles is the annual publication of Stock Trader’s Almanac put out each year by John Wiley & Sons and written by Jeffery & Yale Hirsch. Always fascinating, with new and up-to-date information.
One of the more fascinating cycle analysts we read about was Samuel Benner. Benner was born in Ohio in 1832 from parents who had emigrated to the U.S. from Alsace and Germany in 1803. Apparently, he was quite a prosperous farmer who was wiped out in the 1873 stock market panic, coinciding with a hog cholera epidemic. He set about trying to figure out causes and fluctuations in the economy and markets. Then, in 1877, he published his seminal book “Benner’s Prophecies of Future Ups and Downs in Prices” where he described cyclicality in markets. Many of his forecasts were uncanny and quite accurate but not all worked out.
His analysis discovered an 11-year cycle in corn and pig prices with peaks alternating every five or six years. As well, he determined that cotton prices also followed an 11-year cycle. More fascinating were his cycles in pig iron prices that followed an 11-, nine-, seven-year cycle of lows and peaks in the order of eight, nine and 10 years. This evolved into a 27-year cycle, or for the total cycle, it was 54 years. This 54-year cycle fits as well with Nicolas Kondratieff’s long wave of 54 years with a range of 45–60 years. As well, 55 is a part of the Fibonacci sequence. Many have since improved on these observations of cycles, including going back further in time. Martin Armstrong, for example, goes all the way back to Roman and Greek times to determine his cycles.
It would be impossible to go into everything involved in Brenner’s cycles, including subsequent studies. For our purposes, we will only look at two for illustrative purposes—peaks in the order of eight, nine and 10 years, and lows in the order of 11, nine and seven years. To start, here is the original Brenner chart as published in 1875–1877:
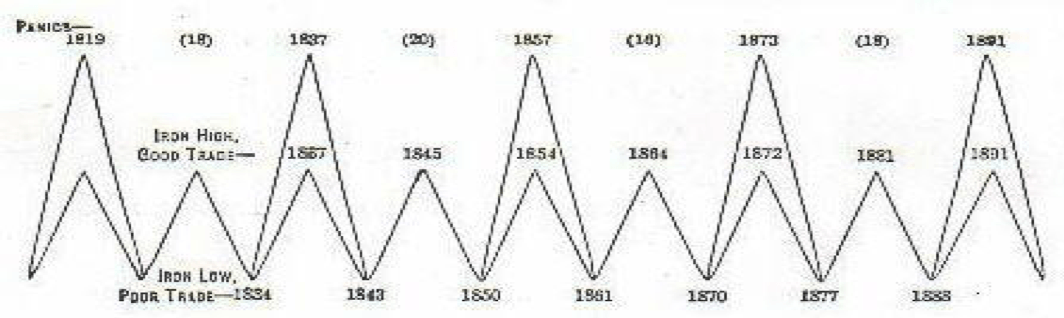
© David Chapman
As noted, Brenner’s peak years were a series of eight, nine and 10 years repeating every 27 years. High years were 1810, 1818, 1827, 1837, 1845, 1854, 1864, 1872, 1881 and 1891. That suggested that the next high would be 1899. A.J. Frost adjusted Brenner’s original high cycle and suggested the high would be 1902 for the stock market. Here is the series, as shown below, of subsequent highs for the Dow Jones Industrials (DJI) as adjusted by A.J. Frost.
We follow that with a table on 11-, 10-, seven-year cycles of lows. We have used an 11-, 10-, seven-year cycle rather than Brenner’s 11-, nine-, seven-year cycle as both Frost and McMinn failed to find a fit for the latter but did for the former. Remember that nothing turns out exactly as one hopes for. The expectation and hope, however, is that a high or a low would occur near the expected date, give or take a year or two. This is an exercise and demonstration of the cycle that appears to have some validity.
As can be seen from the chart of peaks below, there are a few misses: notably 1902, 1910, 1964, 1991 and 2010. The year 1964 was the worst, falling short by 14 months. The average miss is 6.6 months. Still to be determined is the January 2018 high, although so far it has come in right on Brenner’s cycle. The average drop following a peak was 35.3 percent with the worst one being the 1929–1932 drop of 89.2 percent. Some of the bear markets were broken up by a bear market rally followed by another bear decline. This occurred in the 1929–1932 and the 2000–2002 bear markets. We have passed the interim bear market rallies over and recorded only the entire bear market decline.
The bear market lows actually worked better, especially from 1893 to 1949. After that, these lows were more off the mark, as the 1960 low was late, not occurring until 1962. As well, nothing really happened in 2005 as there was no bear market low, at least not until 2009, or looking back, there was the 2002 low. All other lows came in quite well. We note that the Brenner’s forecasts of bear market lows missed completely 1974, 1982, 2002 and 2009, all of which were important bear market lows.
The 8-, 9-, 10-year cycles of DJI market highs 1900–2018
| Add # years | Year predicted adjusted by A.J. Frost | Actual DJI high | DJI bear market | Percentage (%) drop |
| 1902 | June 17, 1901
(7 months early) |
6/1/1901–11/9/1903 | 46.1% | |
| +8 | 1910 | November 19, 1909
(2 months early) |
11/19/1911–9/25/2011 | 24.1% |
| +9 | 1919 | November 3, 1919 | 11/3/1919–8/24/1921 | 46.6% |
| +10 | 1929 | September 3, 1929 | 9/3/1929–7/8/1932 | 89.2% |
| +8 | 1937 | March 10, 1937 | 3/10/1937–3/31/1938 | 49.1% |
| +9 | 1946 | May 29, 1946 | 5/29/1946–5/17/1947 | 23.2% |
| +10 | 1956 | April 6, 1956 | 4/6/1956–10/22/1957 | 19.4% |
| +8 | 1964 | February 9, 1966
(14 months late) |
2/9/1966–10/7/1966 | 25.2% |
| +9 | 1973 | January 11, 1973 | 1/11/1973–12/6/1974 | 45.1% |
| +10 | 1983 | November 29, 1983 | 11/29/1983–7/24/1984 | 15.6% |
| +8 | 1991 | July 16, 1990
(6 months early) |
7/16/1990–10/11/1990 | 21.2% |
| +9 | 2000 | January 16, 2000 | 1/16/2000–10/9/2002 | 38.0% |
| +10 | 2010 | April 29, 2011
(4 months late) |
4/29/2011 – 10/3/2011 | 16.8% |
| +8 | 2018 | January 26, 2018 (so far) | ???? | 8.5% (so far) |
| +9 | 2027 | ???? | ???? |
The 11-, 10-, 7-year cycles of DJI bear market lows 1893–2018
| Add # Years | Year predicted adjusted | What happened – event | DJI bear market low |
| 1893 | Panic of 1893 | July 1893 | |
| +11 | 1904 | Panic of 1901, Crisis of 1903–1904 | November 1903
(2 months early) |
| +10 | 1914 | Outbreak of WW1 | July 1914 |
| +7 | 1921 | Deflationary depression of 1920–1921 | June 1921 |
| +11 | 1932 | Crash of 1929, Great Depression | July 1932 |
| +10 | 1942 | U.S. entry into WW2 | April 1942 |
| +7 | 1949 | Post-war recession | June 1949 |
| +11 | 1960 | Kennedy Slide, Cuban Missile Crisis | June 1962
(18 months late) |
| +10 | 1970 | Tech Stock Crash of 1970, recession | June 1970 |
| +7 | 1977 | Selling Panic of 1977, secondary recession | February 1978
(2 months late) |
| +11 | 1988 | Crash of 1987 | December 1987
(1 month early) |
| +10 | 1998 | Russian and LTCM crisis | August 1998 |
| +7 | 2005 | No event; brief market pause | No bear market low |
| +11 | 2016 | End of QE (quantitative easing) | February 2016 |
| +10 | 2026 | ???? | ???? |
Brenner’s work was one of the first that examined whether cycles existed in markets. His cycles have proven to be a somewhat good predictor as to peaks and lows in markets. But quite possibly, his most valuable contribution was spurring others to examine the possibility of cycles in markets and the economy. We look at today and realize it has been nine years since the stock market low of March 2009 and an economic recession.
The odds of a new stock market bear market and an economic recession are increasing. The world faces three headwinds—rising interest rates in the U.S.; trade wars being initiated by the U.S. where the negative results have yet to be seen; and rising oil prices fueled by production cutbacks, primarily in Saudi Arabia and Russia, sanctions against major oil producers such as Iran and Venezuela, and ongoing wars in the Middle-East where 65 percent of the world’s proven oil reserves lie.
Banks, particularly Italian banks, remain a major concern. It is interesting to note that while Deutsche Bank passed ECB bank stress tests, they failed Fed stress tests. That helps fuel the speculation that Deutsche Bank could collapse.
We presented a brief look at Brenner’s work for illustrative purposes, but we are also impressed with its somewhat uncanny ability to predict potential highs and lows in stock markets. No, it doesn’t tell us exactly when markets will top or bottom. A year is a long time and there are a few misses—from a couple of months to even a year and a half, to even a complete miss. But it illustrates the power of cycles and how they shine a light into the future.
Bitcoin watch!
© David Chapman
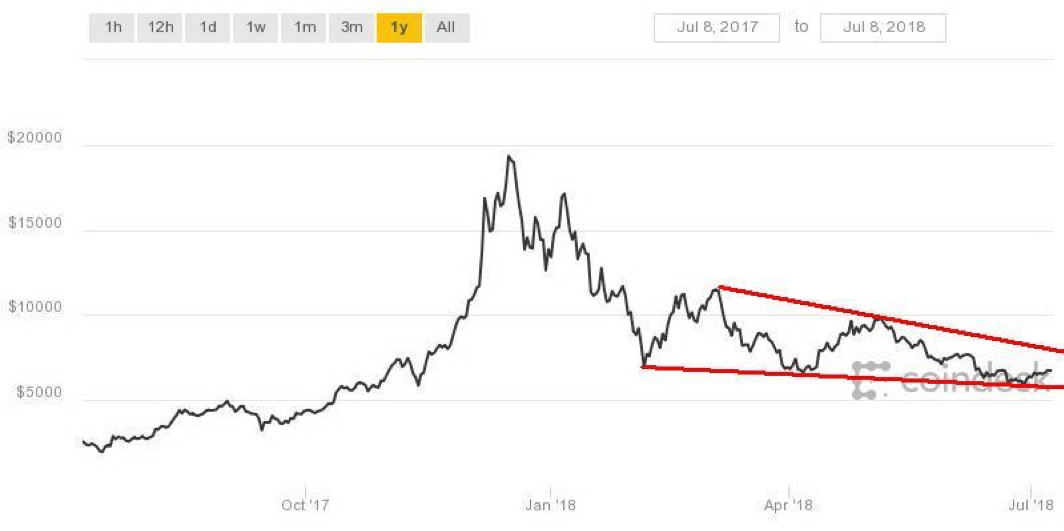
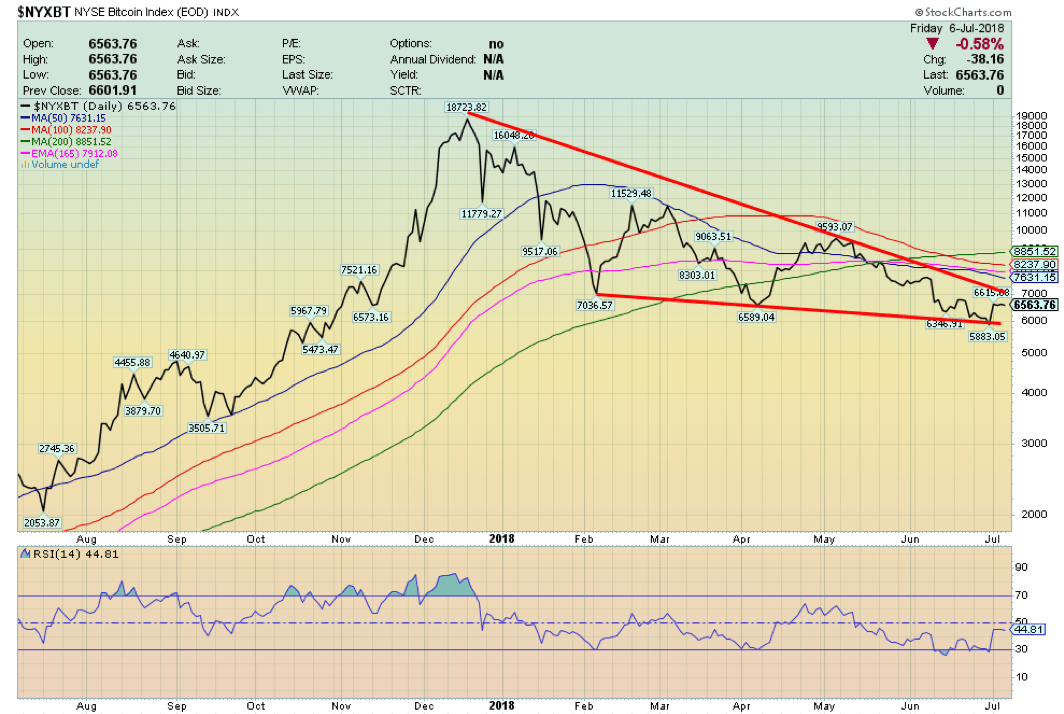
Is the bear market in cryptocurrencies over? Bitcoin and the other cryptos have bounced back. Bitcoin has been trading as high as almost $6,800 this past week after slumping under $6,000, trading down toward $5,800. But Bitcoin failed to sustain the breakdown and rallied back. We suspect it was a case of strong support coming in as those with a vested interest in the cryptocurrency world do not want to see a complete breakdown.
The rebound has brought out all the bulls saying the bear is over and Bitcoin is poised to break through $7,000 any time soon. We doubt it but until we return back under $6,000, the possibility remains open. Bitcoin was last over $7,000 just over a month ago. There is resistance between $6,800 and $7,000, and if it does break through $7,000, there would be further resistance at $7,600 and up to $8,000. So, we never say never.
Nothing really has changed much in the past couple of weeks. The regulators continue to hover, and scams and fraud still seem to pop up. Exchanges still run into problems. There remain far too many cryptos in the universe. We note that at Coin Market Cap, there are now 1,615 cryptos listed. That is up from 1,586 when we last reported this two weeks ago. Hard to believe it, but there it is. The overall market cap of the cryptos is at $267 billion, up $25 billion from two weeks ago. Bitcoin has gained just under 12 percent in the past week and most cryptos are reporting gains.
There are 18 cryptos with a market cap of over $1 billion. About 362 cryptos report a market cap of under $100,000 while Dead Coins reports 853 defunct/dead coins. Many were listed as complete scams with others just being defunct, hacked or dead parodies. Two weeks ago, we reported 817 dead coins. That’s a gain of 36 dead coins.
While the current bounce-back for bitcoin looks impressive, we believe it ultimately will fail. We are aware the banks and dealers are involved in the crypto market, and the last thing they want is competition to their operations from alternative currencies. Irrespective of this, the banks and dealers always find a way to game the market in their favor, and in a market such as cryptos where volumes are actually small, their sheer size and money could quickly dominate and manipulate the market to their advantage.
© David Chapman
Markets and trends
% Gains (Losses) Trends
| Close
Dec 31/17 |
Close
Jul 6/18 |
Week | YTD | Daily (Short Term) | Weekly (Intermediate) | Monthly (Long Term) | |
| Stock Market Indices | |||||||
| S&P 500 | 2,673.63 | 2,759.82 | 1.5% | 3.2% | up (weak) | up | up (topping) |
| Dow Jones Industrials | 24,719.22 | 24,456.58 | 0.8% | (1.1)%
|
down | neutral | up (topping) |
| Dow Jones Transports | 10,612.29 | 10,473.93 | 1.3% | (1.3)% | down | neutral | up (topping) |
| NASDAQ | 6,903.39 | 7,688.39 | 2.4% | 11.4% | up | up | up (topping) |
| S&P/TSX Composite | 16,209.13 | 16,371.78 | 0.6% | 1.0% | up | up | up (topping) |
| S&P/TSX Venture (CDNX) | 850.72 | 740.10 | flat | (13.0)% | down | down | neutral |
| Russell 2000 | 1,535.51 | 1,694.05 | 3.1% | 10.3% | up | up | up (topping) |
| MSCI World Index | 2,046.47 | 1,966.70 | 0.6% | (3.9)% | down | down | up (topping) |
| NYSE Bitcoin Index | 14,492.18 | 6,563.76 | 11.6% | (54.7)% | down | down | neutral |
| Gold Mining Stock Indices | |||||||
| Gold Bugs Index (HUI) | 192.31 | 179.22 | 2.7% | (6.8)% | up (weak) | down | neutral |
| TSX Gold Index (TGD) | 195.71 | 194.37 | 1.5% | (0.7)% | up | up (weak) | neutral |
| Fixed Income Yields/Spreads | |||||||
| U.S. 10-Year Treasury yield | 2.40 | 2.82 | (0.9)% | 17.7% | |||
| Cdn. 10-Year Bond yield | 2.04 | 2.13 | (1.8)% | 4.4% | |||
| Recession Watch Spreads | |||||||
| U.S. 2-year 10-year Treasury spread | 0.51 | 0.29 | (12.1)% | (43.1)% | |||
| Cdn 2-year 10-year CGB spread | 0.36 | 0.21 | (19.2)% | (41.7)% | |||
| Currencies | |||||||
| US$ Index | 91.99 | 93.77 | (0.6)% | 1.9% | up | up | down |
| Canadian $ | 0.7990 | 0.7640 | 0.3% | (4.4)% | down (weak) | down | down (weak) |
| Euro | 120.03 | 117.46 | 0.4% | (2.1)% | neutral | down | up |
| British Pound | 135.04 | 132.86 | 0.6% | (1.6)% | down (weak) | down | down (weak) |
| Japanese Yen | 88.76 | 90.56 | 0.5% | 2.0% | down (weak) | neutral | neutral |
| Precious Metals | |||||||
| Gold | 1,309.30 | 1,255.80 | 0.1% | (4.1)% | down | down | neutral |
| Silver | 17.15 | 16.07 | (0.8)% | (6.3)% | down | down | down |
| Platinum | 938.30 | 848.60 | (1.1)% | (9.6)% | down | down | down |
| Base Metals | |||||||
| Palladium | 1,061.00 | 947.60 | (0.4)% | (10.7)% | down | down | up |
| Copper | 3.30 | 2.82 | (4.8)% | (14.4)% | down | down | up |
| Energy | |||||||
| WTI Oil | 60.42 | 73.80 (new highs) | (0.5)% | 22.1% | up | up | up |
| Natural Gas | 2.95 | 2.86 | (2.1)% | (3.1)% | down | neutral | neutral |
*New highs/lows refer to new 52-week highs/lows. © David Chapman
© David Chapman
Trade wars—who cares. Rising interest rates—who cares. Rising oil prices—who cares. Markets seemed to shrug off any negative news this past week and instead, focused on the positive with Friday’s job numbers that came in higher than expected, despite the uptick in the unemployment rate. But, as we note in the U.S. jobs numbers report below, the market was also buoyed by the fact that 600,000 entrants came into the job market, helping to push up the labor force participation rate and in turn, sparking the stock market up.
The S&P 500 gained 1.5 percent on the week. However, the Dow Jones Industrials (DJI) lagged, gaining only 0.8 percent. The Dow Jones Transportations (DJT) was up 1.3 percent, but we note that both the DJI and the DJT are down on the year. The NASDAQ jumped 2.4 percent. Elsewhere, the TSX Composite gained 0.6 percent while the junior TSX Venture Exchange (CDNX) was flat on the week. In international markets, the London FTSE 100 fell 0.2 percent, the Paris CAC 40 jumped 1.0 percent, the German DAX was up 1.6 percent, but the Tokyo Nikkei Dow (TKN) fell 2.3 percent and the Chinese Shanghai Index (SSEC) continued its losing ways, falling 3.5 percent. The SSEC is now down 16.5 percent on the year.
As we noted, the markets shrugged off the potential for a growing trade war with China. The U.S. placed a 25 percent on $34 billion of Chinese goods while China hit $16 billion of U.S. goods, including halting soybean purchases. That’s something sure to hurt U.S. farmers. The markets seem to think this will blow over somehow—that surely, the U.S. (and Trump) are not that crazy as to keep raising the ante in this war. We wouldn’t hold our breath.
Watching Trump over the past year and a half we’d take him seriously that he will escalate this as he firmly believes that he will win this war. And his advisors all seem to agree with him, although we confess that we are scratching our heads on Larry Kudlow going along with him, given Kudlow’s belief in free trade. Or at least that is the what he did believe. The U.S. trade deficit actually narrowed a bit in May to $43.1 billion. But the gap between China and the U.S. grew by 9.9 percent over the past year.
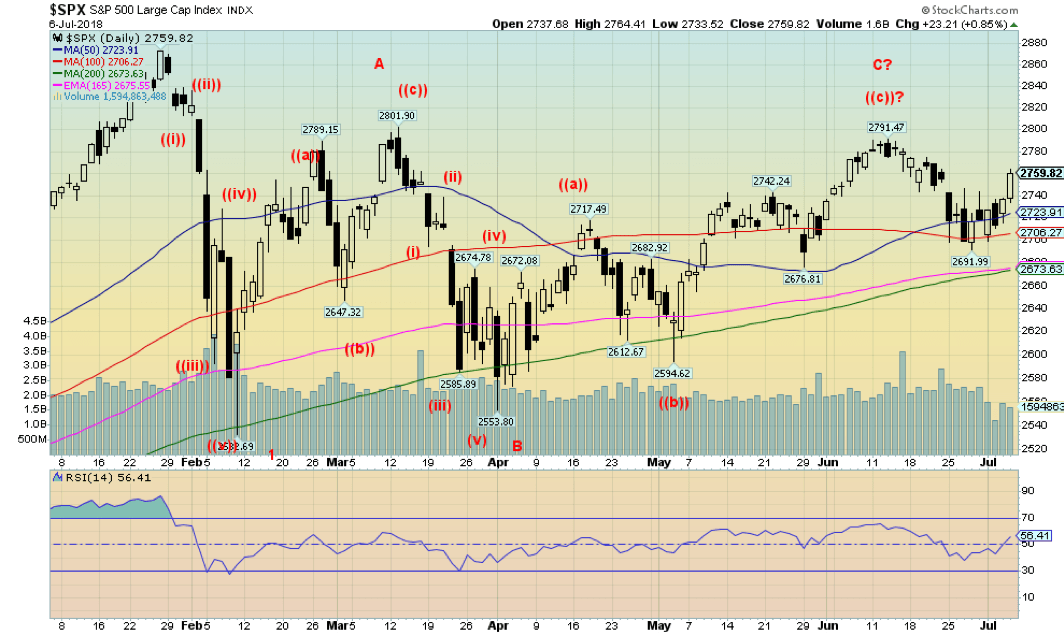
The S&P 500 has been somewhat stronger than the DJI. While the DJI is bouncing off the 200-day MA, the S&P 500 is bouncing off its 50-day MA. A breakdown under 2,700 would suggest a test of the 200-day MA currently near 2,670. The low thus far is 2,530 set back in February, so the S&P 500 is some ways away from a complete breakdown.
New highs above 2,800 would be quite positive and suggest the S&P 500 could challenge the all-time high at 2,870. Follow-through from Friday’s up day could suggest that the market has more legs. But there is a lot happening this week with Trump off to the U.K., then a NATO meeting, which is already threatening to turn into another G7 fiasco, then concluding with a meeting with Putin of Russia. Ought to be an interesting week with, as usual, Trump at the center.
© David Chapman
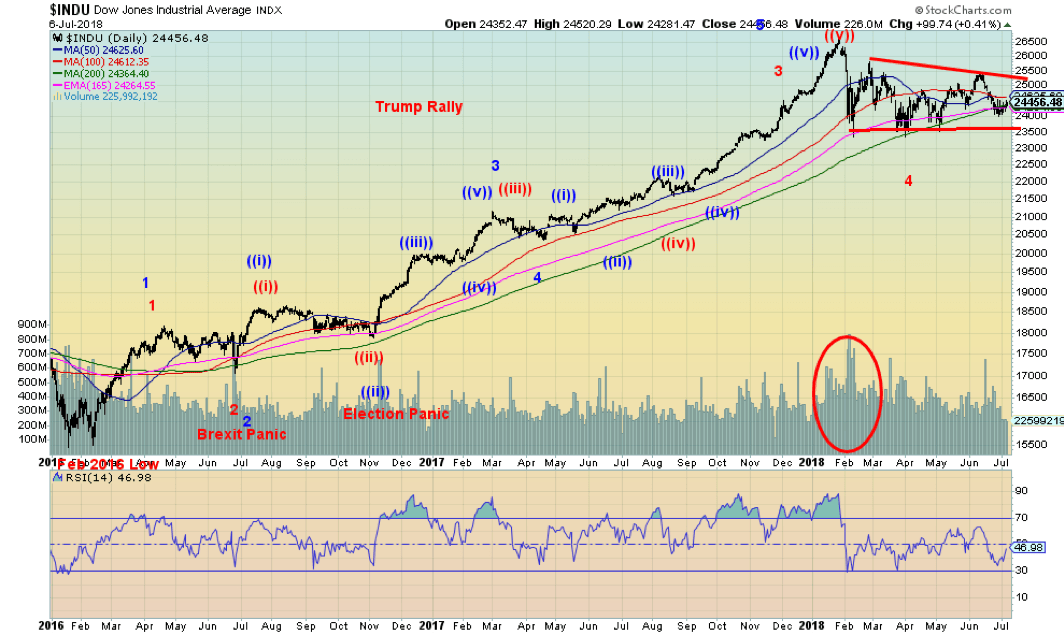
Here is the bigger picture with the DJI. We are now leaning heavily toward the blue Elliott Wave count rather than the red count. Why? Because the unfolding wave since the top in late January is taking on the look of a corrective following the initial drop in February. As well, the triangle that is forming could be a descending triangle, which is bearish. The 200-day MA keeps acting as support, but if one keeps pounding it, eventually it cracks.
The failure of the DJI to make new highs along with the NASDAQ is also a concern. The DJI is now down on the year as is the DJT. A breakdown under 23,500 would be the back-breaker. Before that, a breakdown, under 24,000 would suggest that 23,500 could fall next. A move back above 25,400 would be quite positive and a move above 25,800 would suggest new highs are possible.
© David Chapman
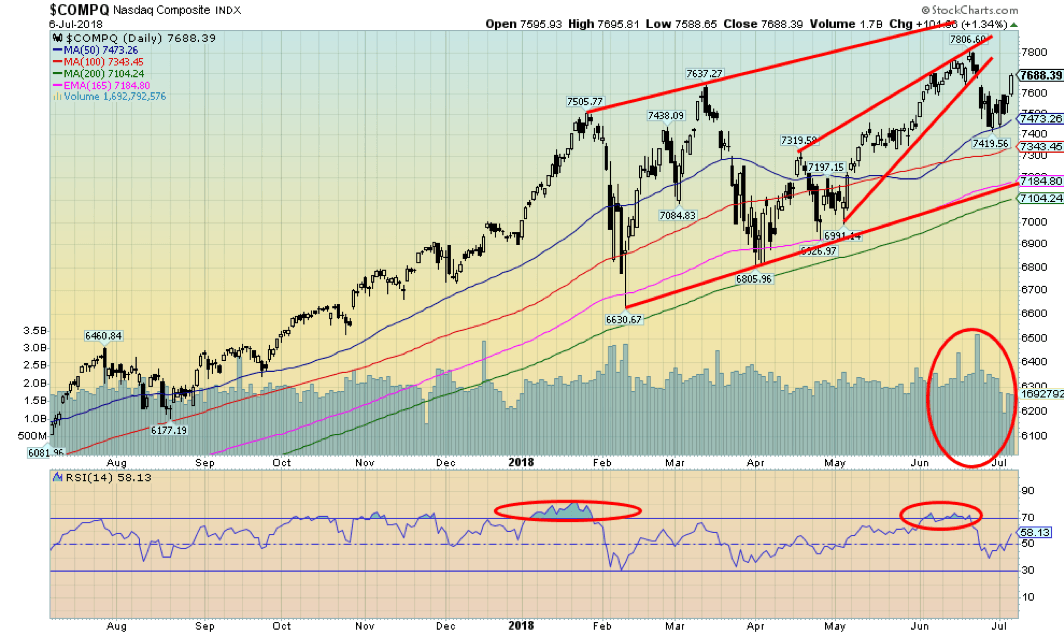
The NASDAQ appears to have broken below an ascending wedge triangle. If that is correct then a drop to around 7,000 could be in the works. Note the high volume on the recent decline. This is not a positive sign as it suggests the sellers are gaining control. The NASDAQ is tech-heavy; it has been the FAANGs that have led the market up, but it could also be the FAANGs that lead the market down.
Grant you, volume does dry up a bit around the July 4 holiday, but still, the higher volume on the decline does stand out. The NASDAQ remains up on the year with a gain of 11.4 percent, but it is off its highs. New highs would at least temporarily hold off any bear move. A reminder, however, that while the NASDAQ was making new highs, the other indices (DJI, DJT, and S&P 500) were not. These are the kind of divergences one often sees at major highs.
© David Chapman
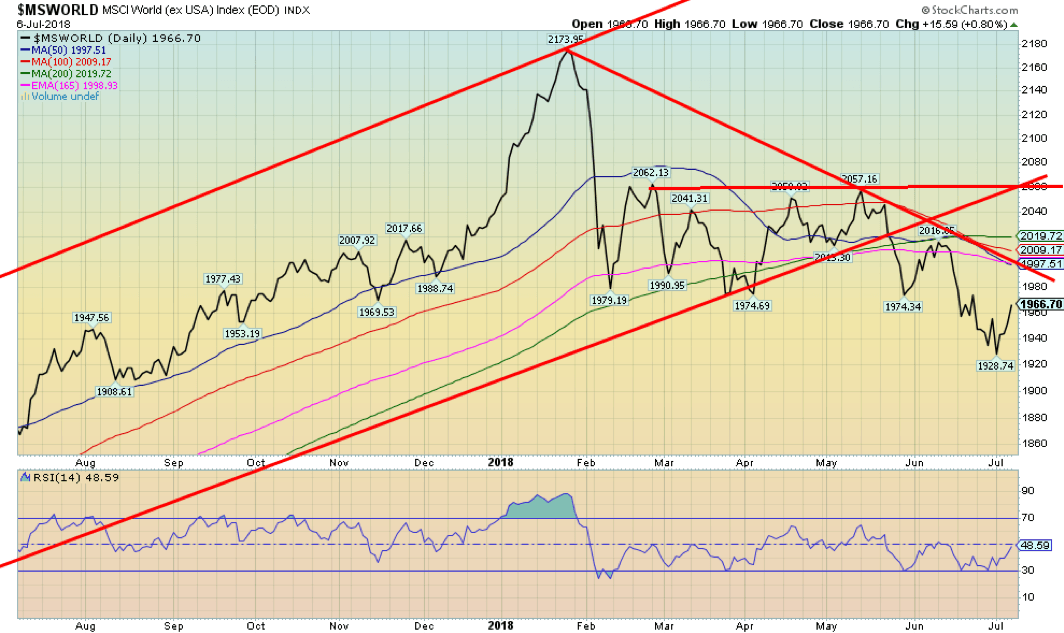
The MSCI World Index appears to be acting as a potential leading indicator as to the next move for the markets. The MSCI has fallen below its 200-day MA even as the index has bounced back this past week. There is considerable resistance up to around 2,000. Note the MSCI is now down 3.9 percent on the year and note as well the DJI and the DJT have both slipped into negative territory. We’re leaning towards the MSCI as the leader.
© David Chapman
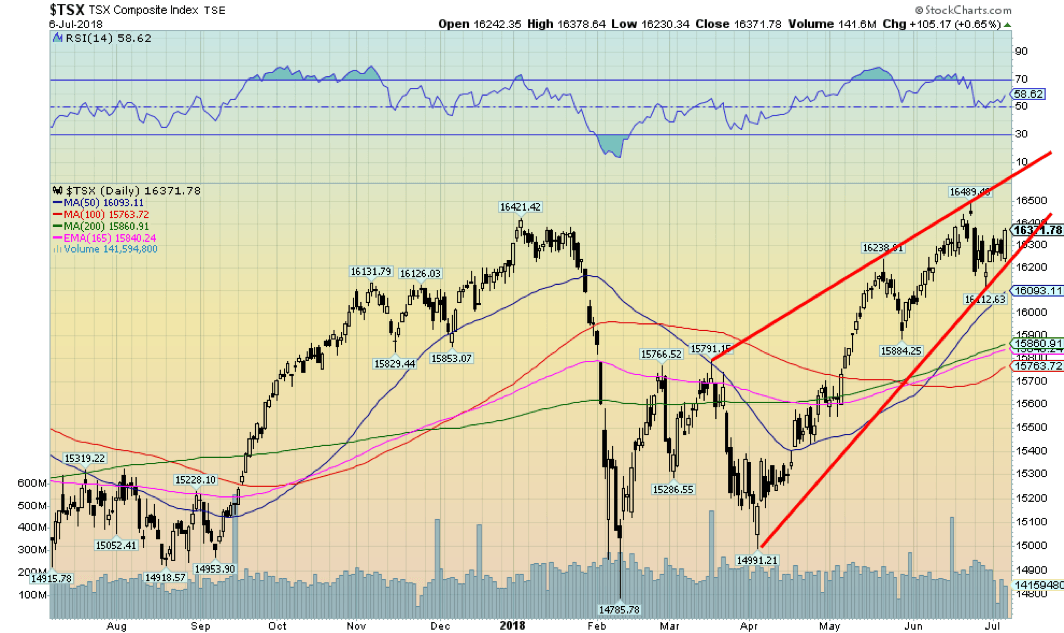
After making an all-time high back on June 22 at 16,489, the TSX Composite fell swiftly the next day, breaking what appeared to be a sharply rising wedge triangle. The TSX Composite quickly found its footings again and has now started to recover. But the TSX Composite appears now to be forming another ascending or rising wedge triangle.
The break is much closer this time and any break under 16,200 could spell trouble. The 50-day MA is down at 16,093, and below that level a drop to the converging 100- and 200-day MAs near 15,860 could happen. Ascending wedge triangles tend to return to where they started. If that is correct, then the TSX Composite could fall all the way back to 14,990. Only new highs might change this more bearish scenario.
© David Chapman
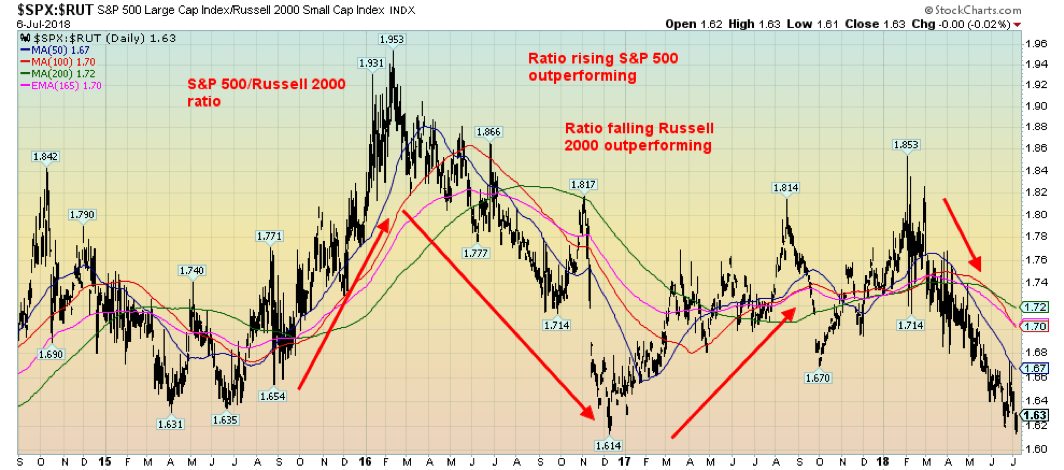
The outperformance of small-cap stocks vs. large-cap stocks continues. This is the S&P 500 Russell 2000 ratio. A falling ratio means that the small-cap stocks (Russell 2000) are outperforming the large-cap stocks (S&P 500). But could this soon be changing? The ratio is down near the lows seen in December 2017. So, this bears watching going forward. If the market breaks down as we expect, it could imply the small-cap stocks fall faster than the large-cap stocks.
© David Chapman
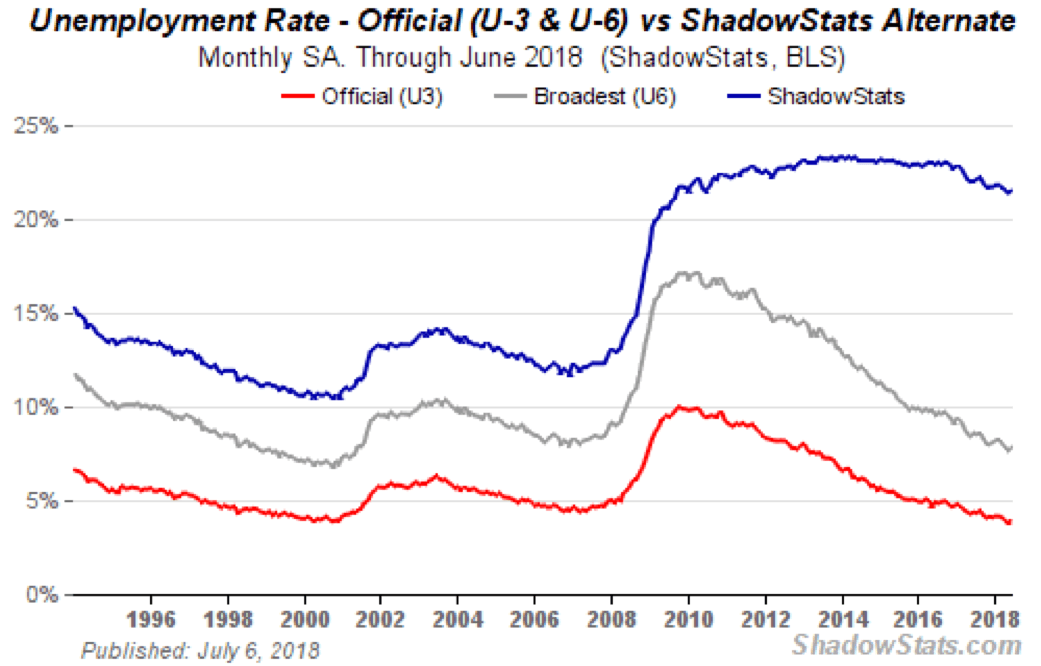
The U.S. released its jobs numbers on Friday. The nonfarm payrolls were up 213,000 in June, slightly above the expectation of 195,000 jobs. Offsetting that surprise, the unemployment rate (U3) rose to 4 percent from 3.8 percent in May. In actual fact, it rose from 3.75 percent to 4.05 percent. The U6 unemployment rate rose to 7.8 percent from 7.6 percent while the Shadow Stats unemployment rose to 21.5 percent from 21.4 percent. Helping push up the unemployment rate was a gain in the labor force participation rate from 62.7 percent to 62.9 percent. Some 600,000 workers poured into the labor force, helping push up the labor force participation rate and in turn pushing up the unemployment rate.
Despite the gain in nonfarm payrolls, the annual growth is only 1.6 percent, which is low, not keeping up with population growth. The household survey (which is different from the nonfarm payrolls) showed a decline of 89,000 full-time jobs but a gain of 145,000 part-time jobs. The number of employed persons rose to 128,657 thousand vs. 127,753 thousand in May. The number of unemployed persons rose as well to 6,564 thousand from 6,056 thousand in May.
The U.S. has officially started its trade war with the Chinese, placing a 25 percent tariff on $34 billion worth of goods. China is retaliating with a 25 percent tariff on $16 billion worth of goods. The Chinese are also shifting their purchase of soybeans from the U.S., hurting U.S. farmers. Studies show that an escalation in this tariff war could cost the U.S. $100 billion and at least 250,000 jobs. Markets seem hopeful it will not escalate, but given where this is going an escalation would not be a surprise. The US$ has taken a hit as a result of all the tariffs and the potential for a trade war.
© David Chapman
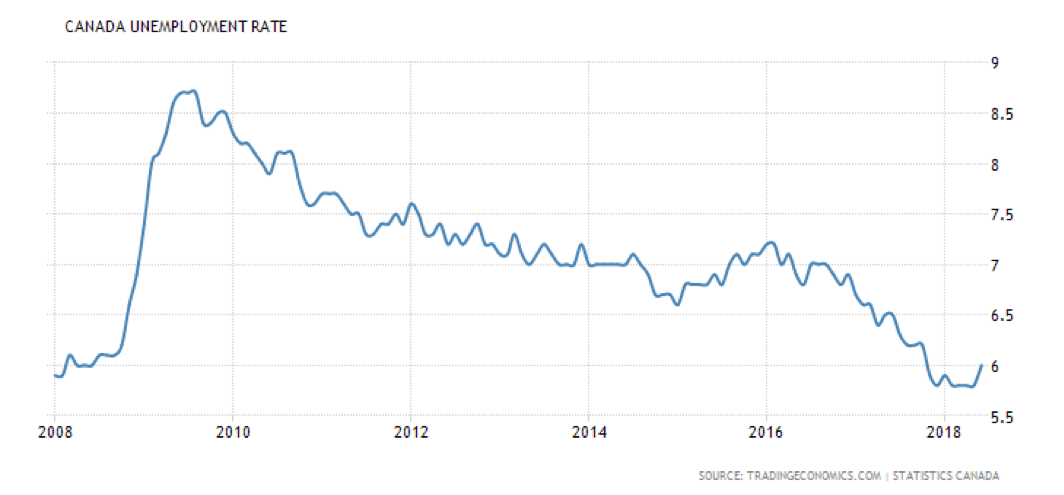
Canada also reported its employment numbers for June. Canada reported a gain of 31,800 jobs, broken down between 9,100 full-time jobs and 22,700 part-time jobs. The unemployment rate, however, ticked up to 6 percent from 5.8 percent as 75,000 people entered the labor force—a six-year high. The labor force participation rate ticked up to 65.5 from 65.3.
The number of employed persons rose to 18,628 thousand from 18,596 thousand the previous month. The number of unemployed persons also rose to 1,195.3 thousand vs. 1,151.5 thousand in May. Job vacancies also ticked higher to 469.8 thousand from 467.7 thousand in May. Average wages actually slipped by 30 bp but with a 3.6 percent gain year-over-year it remains near a decade high.
Despite all the underlying negatives (trade, oil prices), the outlook remains positive. As a result, the consensus seems to be that the BofC will hike rates by another 25 bp at the meeting this coming week July 11. That comes despite some weakness seen in the housing market and the threats to trade, especially the threat from Trump to put a 25 percent tariff on Autos. Studies show that Canada could lose at least 100,000 jobs as a result, given a retaliatory tariff would be placed on U.S. autos. It would hit Ontario especially hard.
© David Chapman
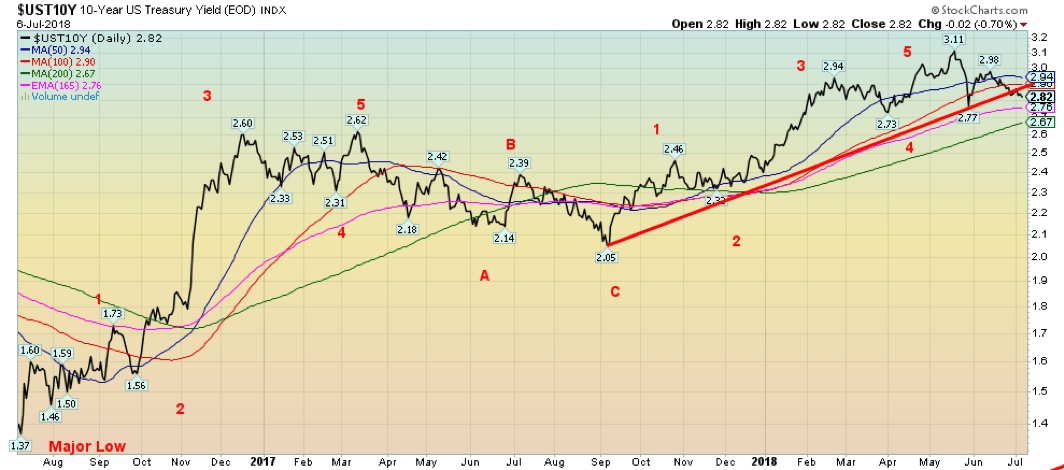
Despite the Fed continuing to hint at further interest rate hikes for the key Fed rate, bond yields have started to fall. The 10-year U.S. Treasury note has now broken below its uptrend line from the September low and is signaling that further declines are likely. We never hit our preferred target of 3.20 percent but we can say we were close with the high at 3.11 percent. The 10-year may have also completed a five-wave advance from the September 2017 low at 2.05 percent. Falling long-term yields—even as the economy continues to report decent numbers and consumer sentiment remains high—is, we believe, a warning that not all is well.
Speaking of the Fed, it appears things may be getting dicey between the Trump administration and the Fed. Trying to influence the Fed is a big no-no. There is, apparently, a tension between the White House and the Fed for the first time since the George H.W. Bush White House clashed with Alan Greenspan back in the early 1990s. Larry Kudlow, the director of the White House’s National Economic Council, was on TV (Fox, naturally) chortling that the Fed should effectively slow down its interest rate hikes. He apparently emphasized it with “My hope is they understand that, and they will move very slowly.”
Bottom line is you do not tell the Fed what to do. Recall that in the early 1990s a recession hit the U.S. following a long expansion. The Fed was hiking interest rates to cool the economy. Bush 1 did not like that and let his feelings be known to Greenspan. Naturally, Greenspan ignored him just as Powell should ignore Trump and Kudlow. And, interestingly enough, this is coming at a time when the Fed has been hiking interest rates and following a long period of expansion. The trouble is, Trump is not one to take no for an answer. A fight between the White House and the Fed would spook markets.
Add in that the Fed has been trying to normalize interest rates following a long period of zero percent interest rates and, as well, bring down the size of its balance sheet (quantitative tightening – QT), one has to realize that there is not much room for error here. And, unfortunately, the Fed has a history of starting to raise interest rates too late and keep hiking them too long. Add in QT and the odds of a mistake are high.
Recession watch spread
© David Chapman
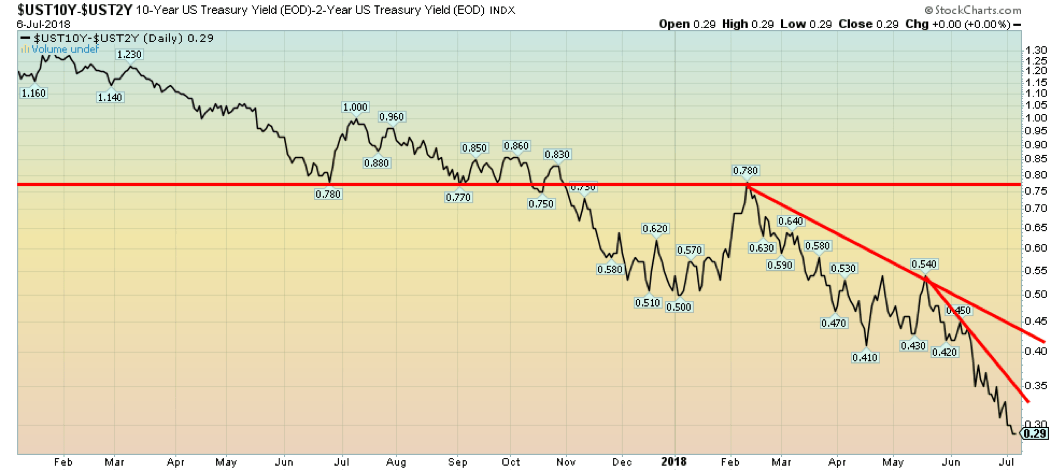
The 2–10 spread now appears to be falling precipitously. Since May, it has been cut almost in half, falling from 0.54 percent to Friday’s close at 0.29 percent. This is not a particularly positive sign. No, it is not negative so it is not yet signaling an imminent recession. But given its rapid fall, it may be only a matter of time even this year before the spread turns negative and starts to warn us of a coming recession. By then the stock market could already be down sharply. The 2–10 spread is a warning. We continue to forecast that we could be in a recession by mid-2019.
© David Chapman
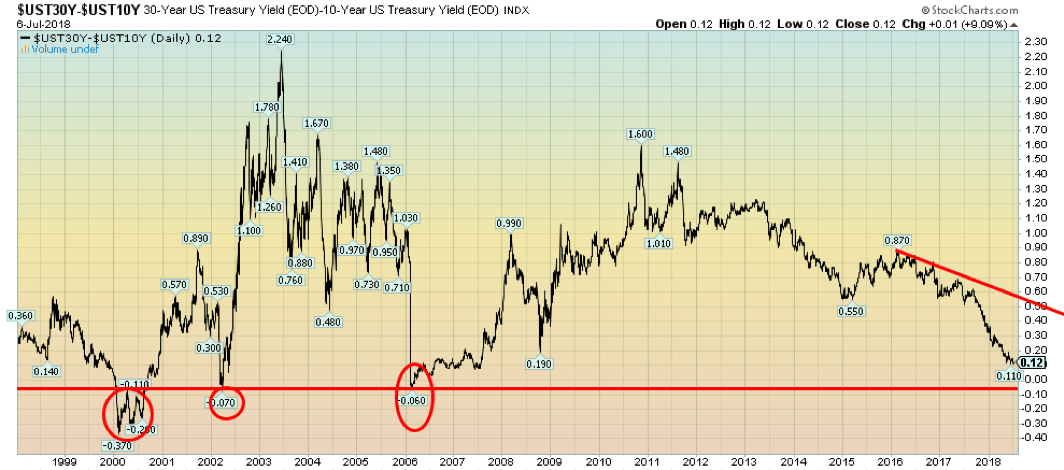
The 10-year to 30-year spread is rarely talked about. But, like our closely watched 2–10 spread, it has been falling. We note that the 10–30 spread went negative as we went into the 2000–2002 recession and briefly turned negative in 2006 before the 2007–2009 recession. The spread currently sits at 12 bp and has been as low as 11 bp. The question begs why anyone would want 30-year bonds over 10-year bonds. Well, insurance companies and others that need to match their cash outflows are major buyers of long bonds, especially of late when the yield on the 30-year went over 3 percent. Apparently, that level was attractive. Canada doesn’t have a 30-year bond, but its 20-year government of Canada bond hit a yield of 2.55 percent back in mid-May 2018. It has since fallen precipitously to 2.17 percent. Maybe it’s signaling something is amiss.
© David Chapman
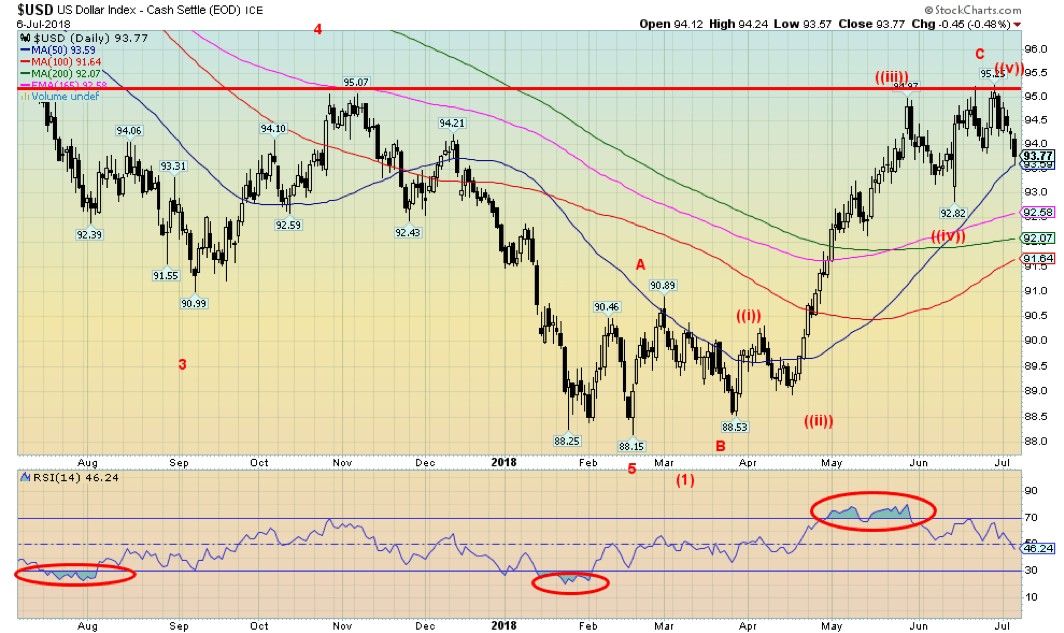
Has the US$ Index double-topped? On June 21 the US$ Index hit 95.21, pulled back, regrouped, and ran to another high at 95.25 on June 28. On June 29 the US$ Index pulled back sharply. It has now taken out the low at 93.83, closing on Friday, July 6 at 93.77. All of this is occurring as the trade war between the U.S. and China, U.S. and the EU, and the U.S. and Canada and Mexico are starting to heat up. There is a grave concern in Canada that Trump will hit Canada with auto tariffs, sparking a retaliation from Canada that could cost Canada over 100 thousand jobs and plunge the Canadian economy and especially Ontario’s economy into recession.
The US$ Index appears to have completed five waves up from the late March low at 88.53 and may have also completed an ABC correction to the down move that bottomed in February at 88.15. A falling US$ Index would be positive for gold and commodities priced in US$. Lying just below is the 50-day MA at 93.59 and the June low at 92.82. If those levels fall, then the odds favor that a significant decline could be underway. Only new highs above 95.25 might change this growing bearish scenario. By hitting the targets at 95.25 the US$ Index satisfied some minimum targets for the correction.
© David Chapman
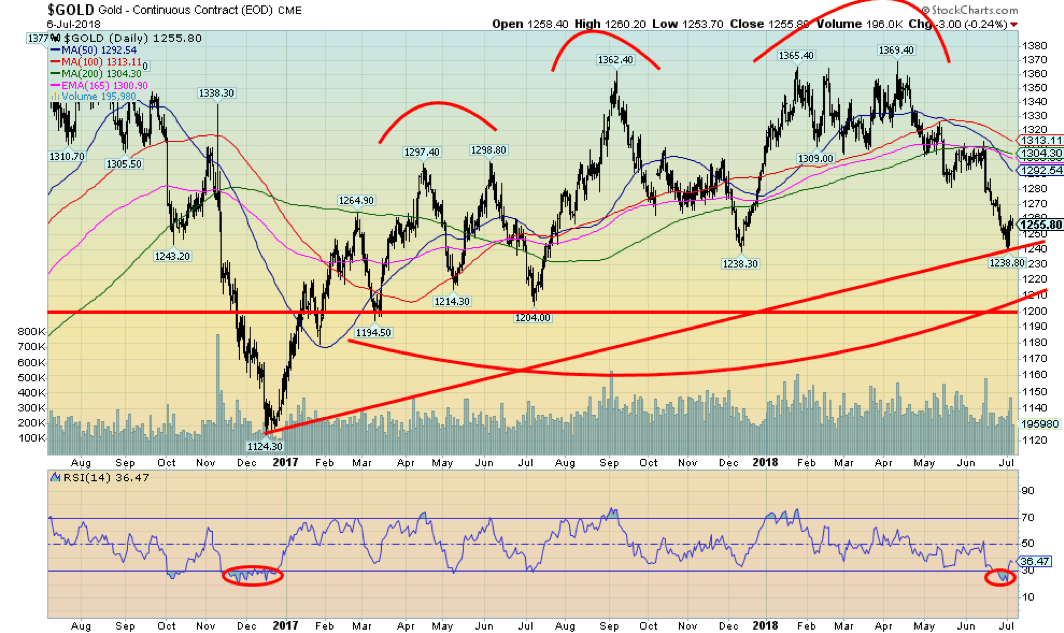
Gold prices fell to new lows this past week for the current move down, then reversed and managed to close up a small 0.1 percent. Silver, on the other hand, failed to get into positive territory, losing 0.8 percent. Platinum also fell on the week, losing 1.1 percent. Gold is now down 4.1 percent on the year while silver is off 6.3 percent. Gold rebounded from oversold territory with the RSI indicator under 30 and sentiment under 10 percent. We note as well that the commercial COT is at its best levels since last December 2017, just before gold put in a $125+ move to the upside.
Major resistance for gold remains up at $1,370. We believe that this should complete a C-wave of an ABC-type correction that got underway with the high September 2017 at $1,362. Gold is not responding to the ongoing trade war rhetoric, but with signs that a real trade war is getting underway that sentiment could change.
Instead, gold has been responding to the continuing strong economy and on Friday the nonfarm payrolls came in somewhat higher than expected and that continues the thought that the Fed will continue with their interest rate hike. Two more could occur this year, most likely in September and December. Russia and China continue to accumulate gold. It is interesting to note that in April Russia dumped half of its U.S. Treasuries and then in May purchased 600,000 ounces of gold.
We continue to note that both Russia and China are determined to conduct trade outside of the U.S. Dollar. Iran is demanding payment for its oil in other than US$. No wonder Trump wants to convince everyone not to buy Iran’s oil. As well with Iran, it is interesting to note the U.S. has held ongoing high talks with Iranian opposition, including Iranian groups that were at one time on the terrorist list. No more, it seems. The U.S. wants regime change in Iran and the switch away from the US$ may be behind it. It was odd that the tearing up of the nuclear deal came hard on the heels of Iran announcing the desire to sell its oil in other than US$.
© David Chapman
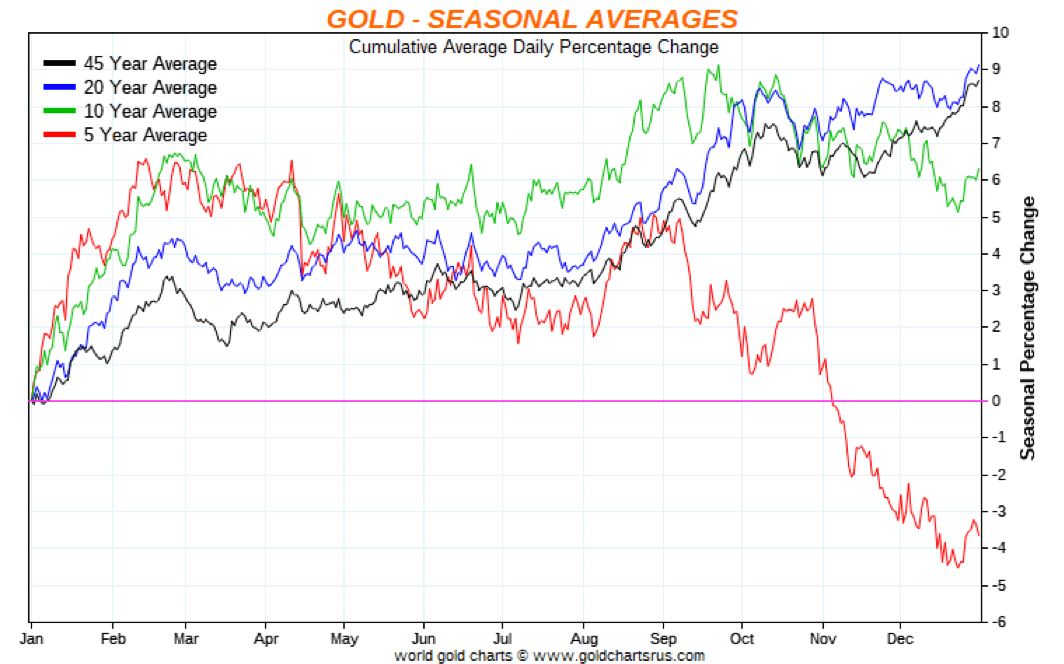
A reminder that one of gold’s best seasonals could be getting underway in July. No matter what time period we look 5-, 10-, 20-, or 45-year average gold has a tendency to take off in July for a rally that lasts into September or October. Even during the pitiful performance of gold over the past five years, a rally has occurred starting in July but no later than August. This next week could prove interesting as Trump is off for meetings with U.K. PM May, the Queen, NATO, and concluding with Putin of Russia.
As well, the trade wars between the U.S. and China now appear to be underway and while, so far, the stock market and gold seem to be ignoring them they may not much longer. With low sentiment, oversold indicators, a positive commercial COT, and seasonals turning, an up move for both gold and silver could soon be underway. We remain optimistic.
© David Chapman
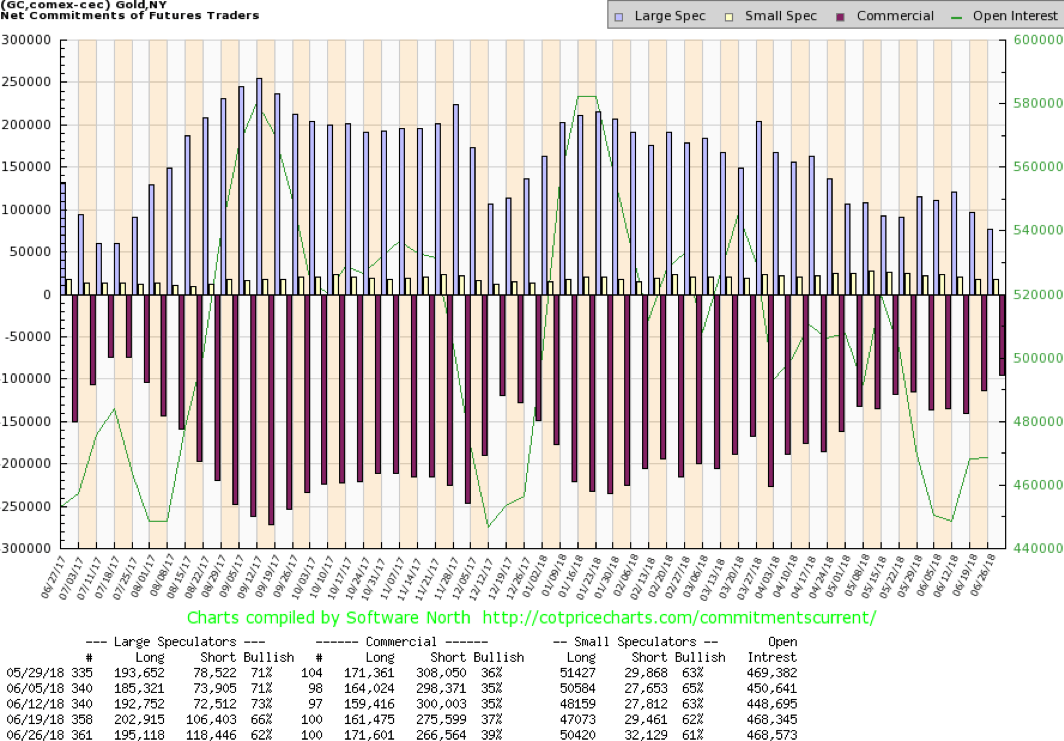
There was no COT on Friday due to the July 4 holiday. It is expected out on Monday, followed by another one next Friday. Worst case we await next Friday’s COT report. Last week the gold commercial COT jumped to 39% from 37% the previous week. No surprise that the large speculators’ COT (hedge funds, managed futures, etc.) fell to 62% from 66%. The gold commercial COT saw long open interest rise roughly 10,000 contracts and short open interest fall roughly 9,000 contracts. The commercial COT is the most bullish since last December 2017 when gold made a low and rose from $1,238 to $1,365.
© David Chapman
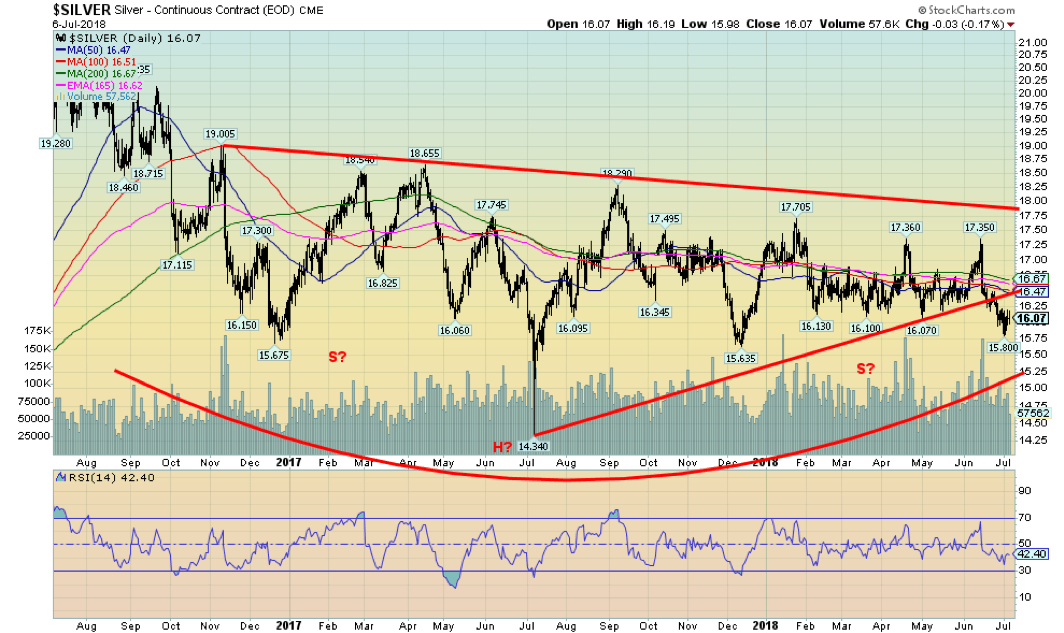
Silver prices did fall to new lows this past week (although not new 52-week lows). Silver prices thus confirmed gold prices that had earlier fallen to new lows for the move down. The divergence, if any, comes with the gold stocks that, as we note, continued to hold and even rise as both gold and silver fell. Silver appears to have broken the uptrend line from the July 2017 low at $14.34. But it also failed to break down under the December 2017 low of 15.64.
So, the overall feeling is kind of mixed here. We could argue silver formed a descending triangle over the past several months. Targets are, in theory, down to $14.45 although we are hard pressed to believe that is possible. Minimum potential targets were seen at $15.68 and, so far, we haven’t seen that level either. After making the low at $15.80, silver prices reversed closing back over $16. Nonetheless, there is considerable resistance between $16.45 and $16.70 to “chew” through before we can say silver is “out of the woods.”
Key, of course, is that $15.80 does turn out to be the low, but even if it wasn’t, as long as $15.65/$15.70 holds. Volume rose sharply on the breakdown but has petered off considerably as prices moved lower. Sentiment remains exceptionally low. The gold/silver ratio is currently at 78 and that too is not far off its recent highs. The gold/silver ratio chart appears to poised to fall in favor of silver. A breakdown for the ratio under 70 would be quite positive. Despite the delusion out there with regard to the precious metals, positive seasonals, low sentiment, and a positive commercial COT all appear to be telling us that a rally could soon get underway.
© David Chapman
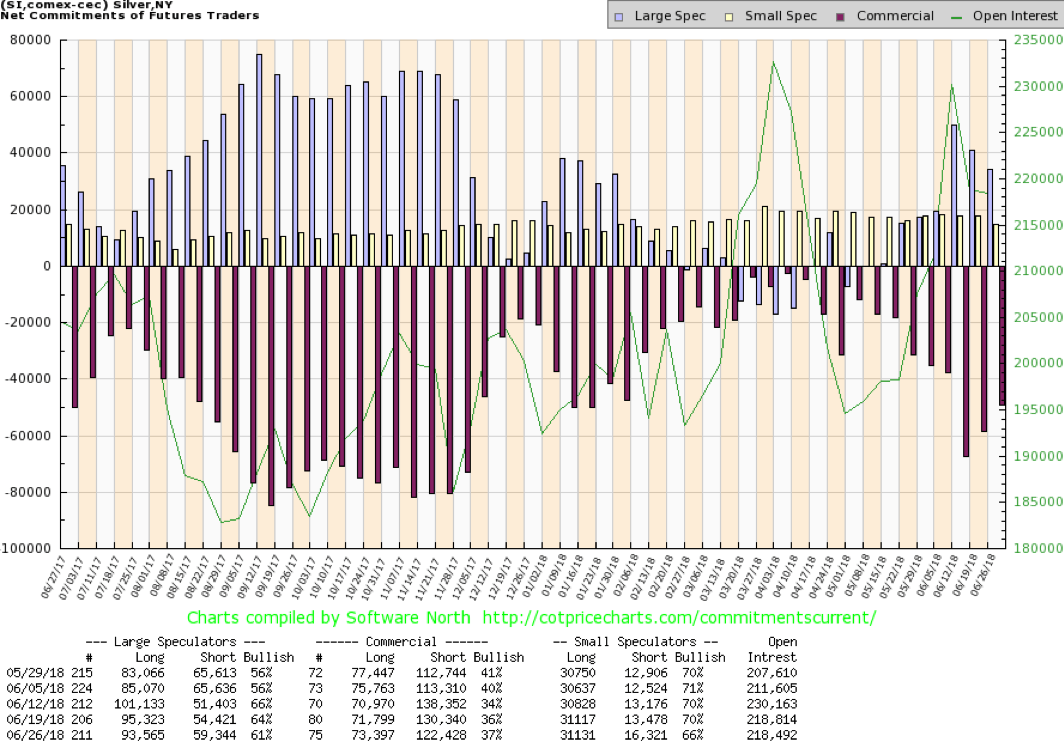
As with the gold COT, there was no release of the silver COT this past week as it was delayed by the July 4 holiday. The previous week’s commercial COT improved to 37% from 36%. It is noted that long open interest rose just under 2,000 contracts while short open interest fell roughly 8,000 contracts. The large speculators’ COT fell to 61% from 64%. We continue to view the silver commercial COT as bullish for silver prices going forward. The latest COT could be out on Monday and we still get a new COT next Friday.
© David Chapman
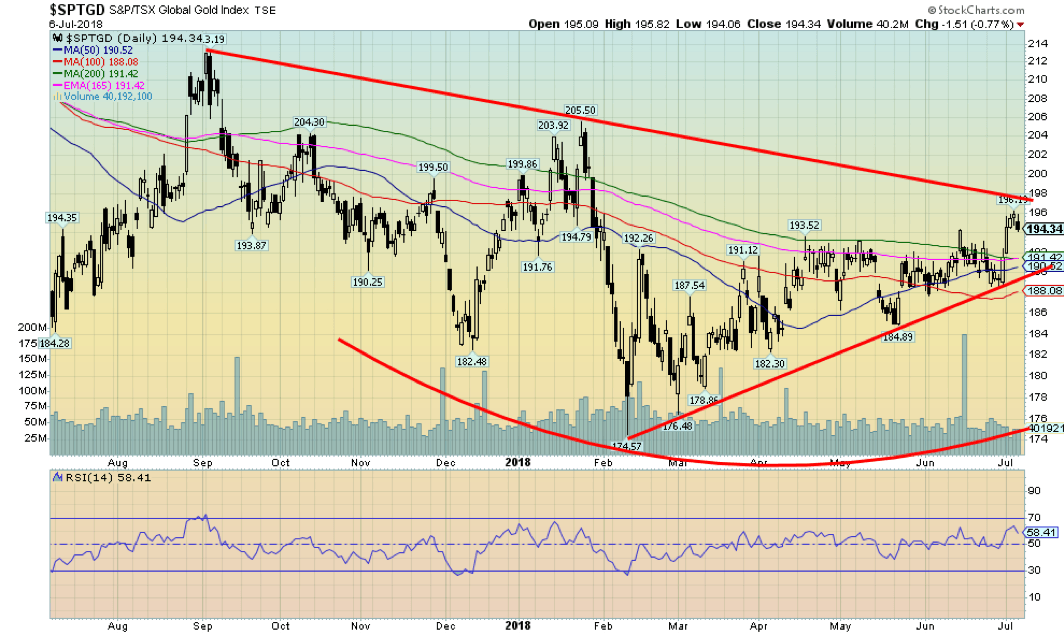
Despite ongoing weakness in both gold and silver the gold stocks as represented here by the TSX Gold Index (TGD) continue to outperform. Even as gold and silver made new lows for their recent moves the TGD refused to budge and instead rose in an irregular manner. The TGD gained 1.5% this past week hitting a high of 196 before pulling back. For the longest while, the TGD struggled to break out over 193 but now it has and appears poised to soon take out the major downtrend line near 198. The U.S.-based Gold Bugs Index (HUI) has also been rising and was up 2.7% this past week.
Sentiment towards the gold stocks remains at best mediocre so there is considerable room for them to move higher. Once the TGD breaks out over 198 and 200 the next significant resistance zones would be seen at 205 and 212. The TGD is now once again over the 200-day MA. After putting in a major low in late 2015/early 2016 the TGD soared to 284 by July 2016. That’s been it since as it fell once again hitting a low of 172 in July 2017.
It is significant that since then it has failed to break down under that low. The high of the past two years is at 232 and it is the trendline down from that level that the TGD appears poised to break. Targets could be up to at least 260. The all-time high was seen in 2011 at 455. Since topping in July 2016, the action has appeared as a correction to that first rise following the late 2015 bottom. A breakout could signify that the third wave up or C wave up could soon be underway. It should, if past events hold true, eventually take out the July 2016 high of 284.
© David Chapman
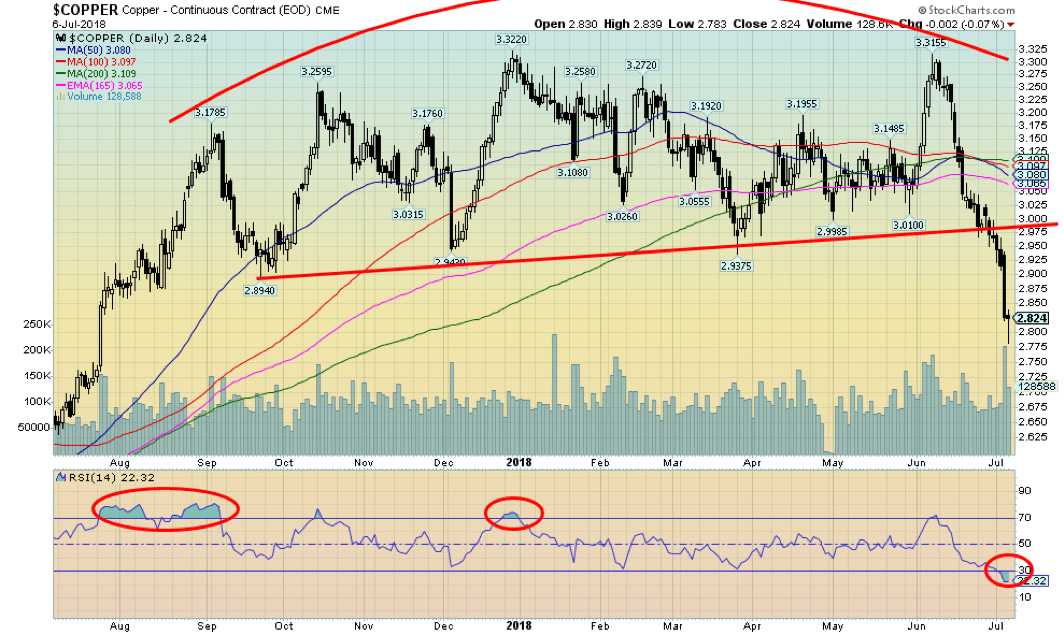
We couldn’t help but notice (and pushed a little by our colleague Michael Ballanger with his observations) that copper prices have broken down from what appears as a large topping pattern. Copper is currently overextended so a rebound of some magnitude might soon get underway. Copper isn’t the only base metal that has broken down recently; zinc and lead have too, amongst others. Base metal indices are off recent highs.
Copper is considered a leading indicator of the economy so a breakdown in copper prices does not bode well for the economy going forward. It is as if copper is anticipating an economic slowdown even as falling copper prices are not always a harbinger of an economic slowdown and a fall in the stock market. Copper could also be reacting negatively to all the talk of trade wars as the fear is that copper demand will fall. Still, it is interesting to note copper supplies are also falling which in turn could fuel the rebound.
© David Chapman
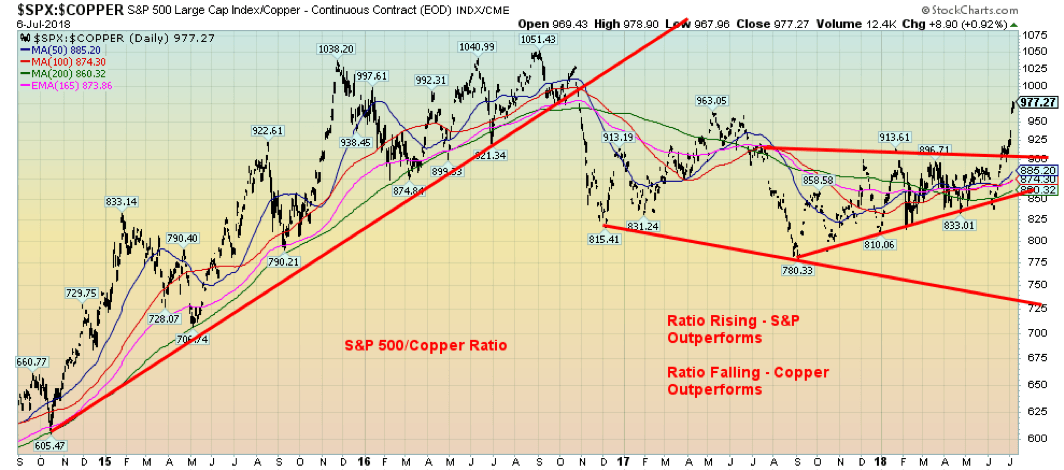
Here is the S&P 500/copper ratio. When the ratio is rising, the S&P 500 is outperforming copper. When the ratio is falling, copper is outperforming the S&P 500. Recently the ratio has been rising, although it remains well short of levels seen in 2016. Intermarket ratio charts like this are useful to futures traders who can access both S&P 500 futures and copper futures.
It is interesting that, for the most part since 2017, copper had generally outperformed, but since roughly August 2017 the trend shifted and the S&P 500 has outperformed but in a very choppy manner. The rising triangle that formed proved prescient as the ratio broke out to the upside. Targets appear to be up around 1,050 and the old highs based on the ascending triangle.
© David Chapman
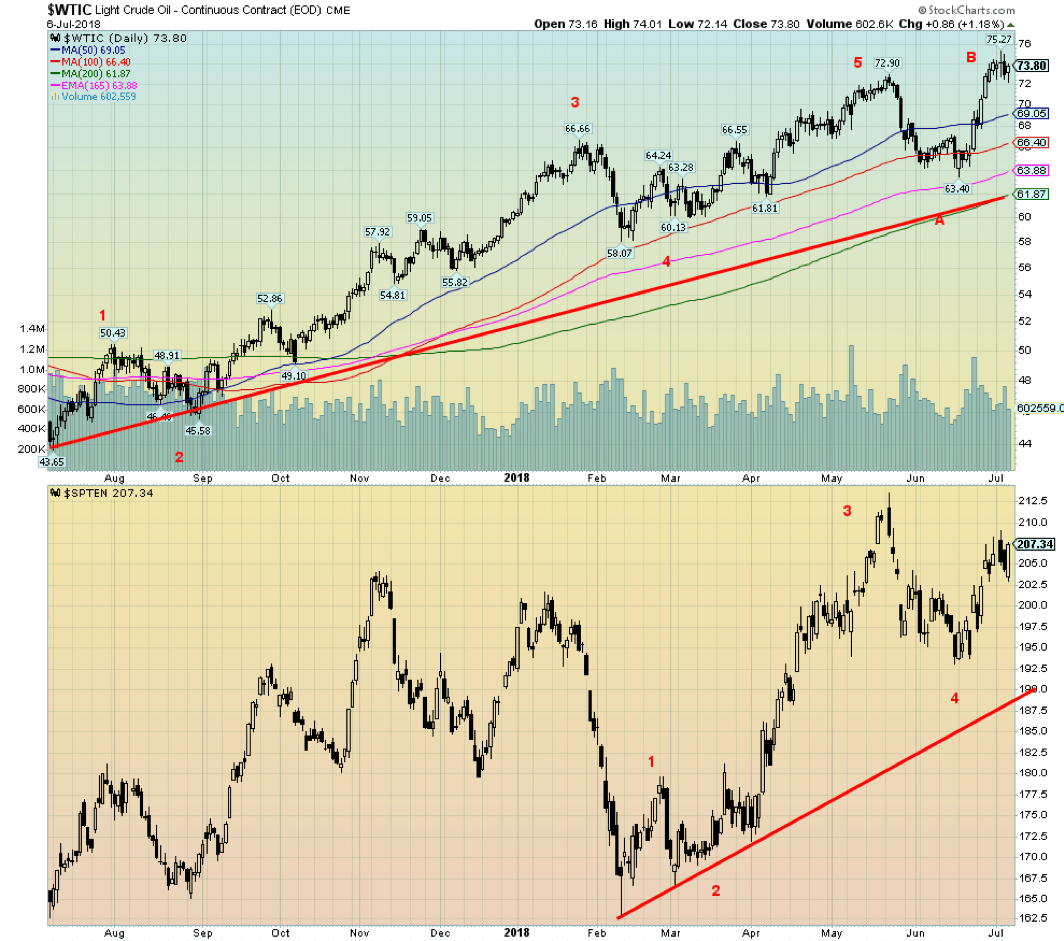
WTI oil prices surged to new highs this past week over $75. Prices subsequently pulled back and even closed off a little on the week down 0.5%. The recent rise in oil prices is largely because of the shouting war between Trump and Iran where Trump has threatened to cajole everybody to stop buying Iranian oil. As if China, a major buyer of Iranian oil, is going to listen to U.S. WTI oil hit a new high over $75, but retreated largely because the U.S. stockpiles were reported as a 1.2 million barrel increase rather than the expected 3.5-million-barrel decline.
That would do it. And add in Trump demanding that Saudi Arabia, who does have some capacity to increase production, to actually increase their production by 2 million barrels/day to make up for the loss of Iranian oil. Iran then threatened to block the Straits of Hormuz. The Straits of Hormuz, strategically situated between the Persian Gulf and the Gulf of Oman, are where at least one-third of the world’s oil passes through every day.
While the straits are 21 miles wide at their narrowest point, ships are limited to a 2-mile-wide range in either direction. The crude from Saudi Arabia, Iran, Kuwait, UAE, and Iraq passes through the straits. The U.S. 5th fleet stationed in Bahrain is the policeman protecting ships in the region. In a nutshell, it is the world’s most important oil chokepoint. Successful blocking of the straits would, by some estimates, send oil prices soaring to over $200.
We continue to believe that WTI oil is going through a corrective phase following the long run-up from the low $40s over a year ago. That we made a new high on what might be the B wave is not uncommon. It might signal that the C wave down might fall short of the earlier low at $63.40 a classic ABC flat. We note that while WTI oil made new highs the energy stocks, as represented by the TSX Energy Index (TEN), did not. Nor did the S&P Energy Index.
So that might be a warning sign that the correction is not yet over. Some easing in the tensions with Iran would also likely ease oil prices. We note Venezuela is another hot spot where, because of sanctions, oil production has been impacted. Sanctions are in place against both Iran and Venezuela and the U.S. at least would like to encourage regime change in both countries. Venezuela has the world’s largest oil reserves and Iran the 4th largest oil reserves. Iran has the world’s 2nd largest reserves of natural gas behind Russia.
Chart of the week
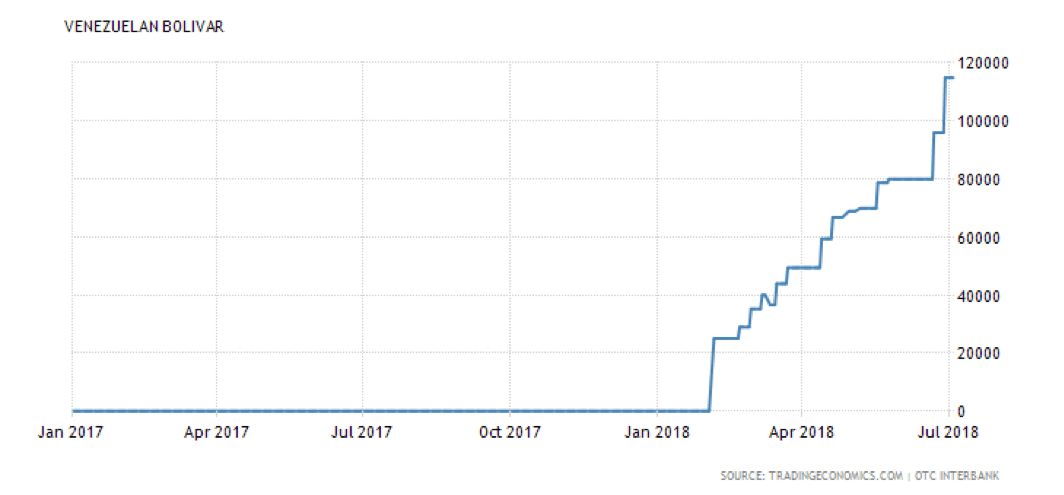
© David Chapman
This is the Venezuelan Bolivar. It’s not doing well. The Bolivar was trading at US$1 = 10 Bolivars at the beginning of the year. Now, as of July 4, 2018, US$1 will buy you 114,856.30 Bolivars. This is what currency collapse looks like.
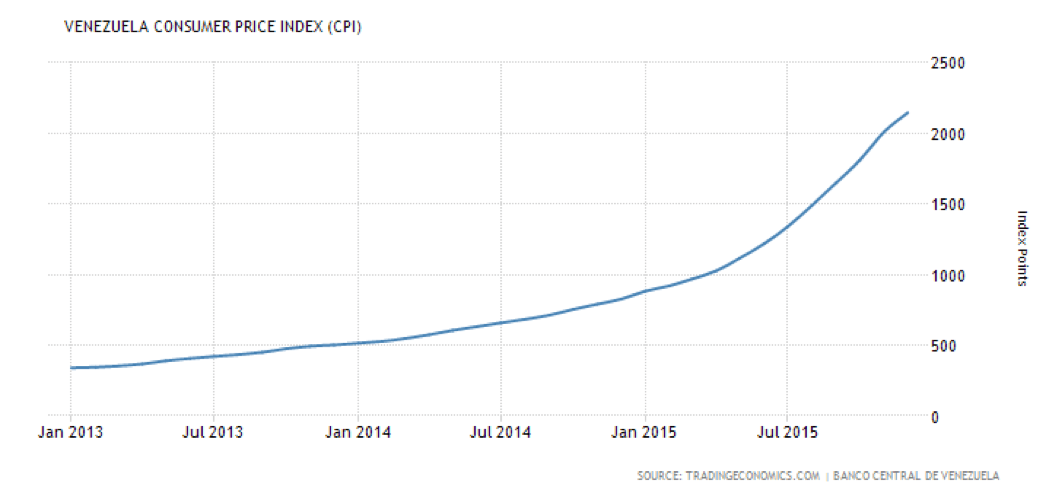
© David Chapman
This is what hyperinflation looks like. The current inflation rate in Venezuela is 24,571%, or at least that was what it was in May 2018. Month over month the rate is 110%. We suppose the good news is the core inflation rate is rising by only 60% while food inflation is at 315%. Nonetheless, in a nutshell, inflation is rampant.
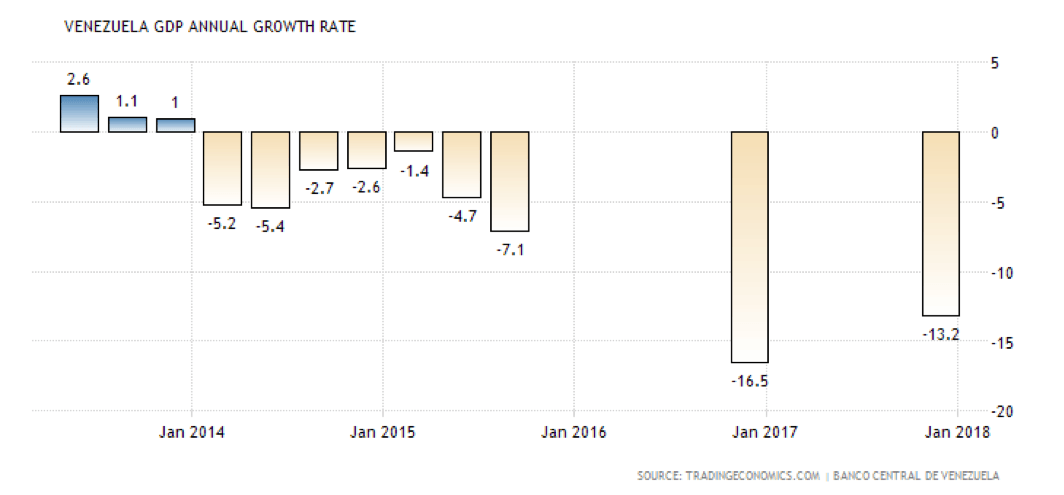
© David Chapman
This is Venezuela’s GDP. In 2017, it was negative 13.2%. A collapsing GDP seems to go hand-in-hand with a collapsing currency and rampant inflation.
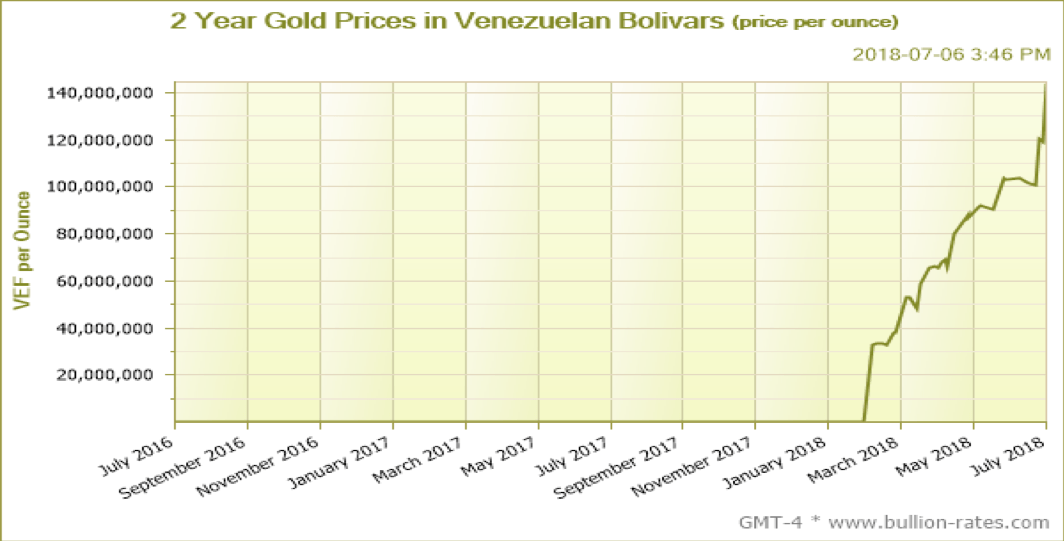
© David Chapman
No surprise that if you held gold you made out okay. As of July 5, 2018, gold in Bolivars is 144,326,252.50/ounce. It gives true meaning to gold protecting you in the event of a currency meltdown.
It was probably no surprise to learn that Donald Trump had asked top foreign policy advisers a year ago about the possibility of invading Venezuela. Sanctions were placed on several Venezuelans including President Maduro. Fortunately, Trump was talked out of it as they argued it could seriously backfire. Venezuela has the world’s largest oil reserves with over 300 million barrels. Canada is third with just over half that amount. Venezuelan oil, like Canada, tends to be heavy oil. Venezuela is an OPEC member. Despite the huge reserves Venezuela is only the 12th highest oil producer. Sanctions have hurt its production.
Adding to Trump’s policy advisers in talking him out of any invasion was that other Latin American countries would not look favorably on such action and were opposed. Nonetheless, Venezuela upped their watch through the armed forces who, for the most part, remain loyal to Maduro. In an earlier time, there was a U.S.-backed attempt at overthrowing Maduro’s predecessor Hugo Chavez which failed. Many U.S. advisers dismissed Trump’s thinking of an invasion as Trump thinking out loud.
Nonetheless, the hyperinflation and currency collapse are real. Venezuelans have been resorting to the barter system to survive. Unless, of course, you have gold. Then you would be fine.
—
DISCLAIMER: David Chapman is not a registered advisory service and is not an exempt market dealer (EMD). We do not and cannot give individualized market advice. The information in this article is intended only for informational and educational purposes. It should not be considered a solicitation of an offer or sale of any security. The reader assumes all risk when trading in securities and David Chapman advises consulting a licensed professional financial advisor before proceeding with any trade or idea presented in this article. We share our ideas and opinions for informational and educational purposes only and expect the reader to perform due diligence before considering a position in any security. That includes consulting with your own licensed professional financial advisor.


Bitcoin Stalls Near $60K as Strategy Moves, ETFs Outflow, and EU MiCA Rules Take Effect
Bitcoin hovers near $60,000 with ETF outflows, while Strategy boosts reserves, sells BTC, and raises dividends to reassure investors. Ethereum...


Cannabis Dominates Global Drug Use: Trends, Risks, and Shifting Markets
Cannabis remains the world’s most widely used illicit drug, with 256 million users in 2024, surpassing all others combined. Growth...


Italy Approves First Hydrogen-Powered Train for National Rail Network
ANSFISA has approved Italy’s first hydrogen-powered train, the Alstom HMU214, for use on the Brescia–Iseo–Edolo line. Capable of 140 km/h,...


Cotton Market Weakness Persists Despite Brief Rebound
Cotton prices fell to new lows last week before a modest rebound. USDA data shows crop conditions remain worse than...


Eli Lilly Hits $1 Trillion Valuation Amid Strong Bullish Momentum
Eli Lilly stock hit a record high, surpassing $1 trillion market value after strong product demand. Shares surged over 7%,...
 |
|
 |  |
 |
|
-

 Crowdfunding7 days ago
Ithaca: Climate Road Trip RPG on Climate Resistance
-

 Fintech2 weeks ago
Fintech and AI: Adoption Grows, but Profits Favor Agile Innovators
-

 Fintech5 days ago
PayPal’s Slowdown: From Fintech Leader to Low-Growth Dividend Stock
-

 Impact Investing1 week ago
Edison Accelerates Renewable Growth and ESG Impact in 2025
You must be logged in to post a comment Login