Featured
Stock markets leap but gold suffer
Are the stock markets safe? The latest positive results could just be temporary as this is thanks to the trade truce between China and the United States. As a result, the stock market celebrated with the Dow Jones Industrials, leaping over 300 points. Still, not everything is fine, as gold and resource stocks have suffered from the trade truce putting them into negative territory for the year.

Well, the stock market can thank President Trump for this one. Is it just another tactic for him? Trump suspended pending tariff hikes on $250 billion of Chinese goods and China agreed to buy $40 to $50 billion of U.S. farm products as part of what appears as a temporary trade truce between the two combatants.
Stock markets celebrate
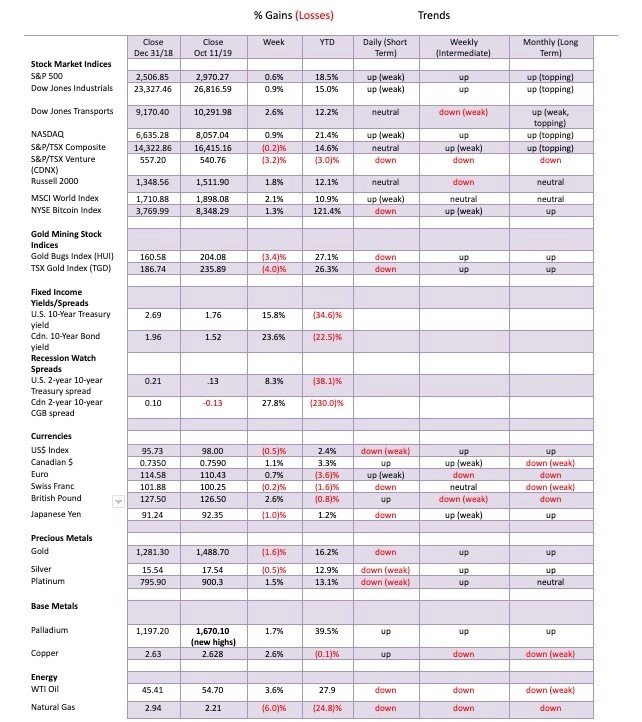
The stock market celebrated with the Dow Jones Industrials (DJI) leaping over 300 points. At one point the DJI was up over 400 points. The big leap at the end of the week helped the indices close in the black with the DJI gaining 0.9% this past week, the S&P 500 up 0.6%, the Dow Jones Transportations (DJT) up 2.6%, and the NASDAQ jumping 0.9%. The Russell 2000 was up 1.8%. Elsewhere, the MSCI World Index was up 2.1% this past week, the London FTSE 100 was up 0.8%, the Paris CAC 40 gained 2.9%, and the German DAX leaped 3.7%.
The Chinese Shanghai Index (SSEC) was up 2.6% and the Tokyo Nikkei Dow (TKN) gained 1.8%. Happiness all around? Not quite—gold and resource stocks suffered with the trade truce. The result saw the TSX Composite lose a small 0.2% this past week, while the heavy resource based TSX Venture Exchange (CDNX) lost 3.2%, putting it into negative territory for the year.
Some stock market internals were positive this past week. The NYSE advance-decline line is once again just shy of a record high. But the McClellan Summation Index (ratio-adjusted), known as the RASI, slipped below 500 and stayed there.
Not bullish, but not bearish either. The TRIN index closed at +0.84 in what we call the fear zone. The NYSE TICK Index closed in positive territory at +186. That’s well short of a +1,000 reading that would trigger potential sell signals. The advance on Friday was quite robust with some 84% of NYSE stocks advancing. Volume was also high.
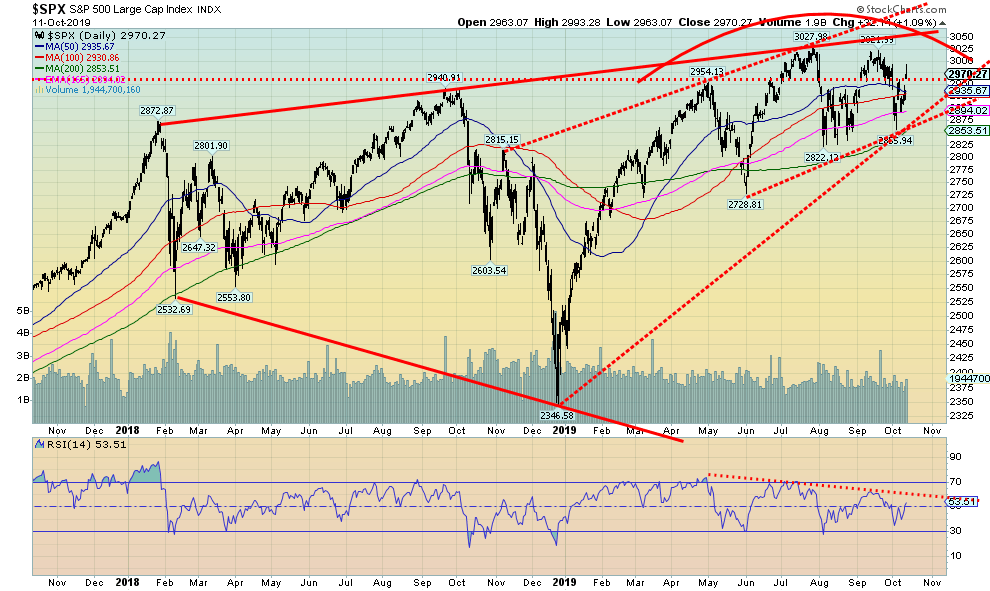
Technically, the broadening channel remains intact despite the sharp jump at the end of the week. Technical internals such as momentum, RSI, MACD, CCI, etc. are all deteriorating and exhibiting negative divergences. A breakdown of the S&P 500 below 2,950 would suggest a decline to at least 2,650. Under 2,800 could signal a bear market.
The comparable numbers for the DJI are a break under 25,570 targeting 23,000 to 23,050. A breakdown under 26,000 could signal the onset of a bear market. The DJT remains well below its all-time highs and continues to diverge negatively with the DJI. The TSX Composite breaks down under 16,000, potentially targeting down to 15,300 or lower.
From the low seen on October 3, 2019 the stock market has advanced on what appears an ABC corrective pattern. Is it complete? Hard to say. A break under 2,900 would confirm a top. Could we be moving to new all-time highs? This we do not deny, especially given robust volume, advancing stocks, and very positive AD lines.
But to convince us that we are going to make new highs, a move over 3,000 S&P 500 is essential. As well, the gap opening on Friday must hold. Further advances this coming week are essential for the bulls. Failure here would be potentially more negative. The week could start out positive but fail later in the week. The trade wars remain volatile and President Trump could, once again, change on a dime.
We remain within the boundaries of the broadening channel and within the boundaries of a potential ascending wedge triangle. While we remain bearish, we also wouldn’t fight a move over 3,000 S&P 500. A move over that level could suggest new all-time highs. But then the top of the broadening channel is currently near 3,060, so it’s wise to keep that in mind.
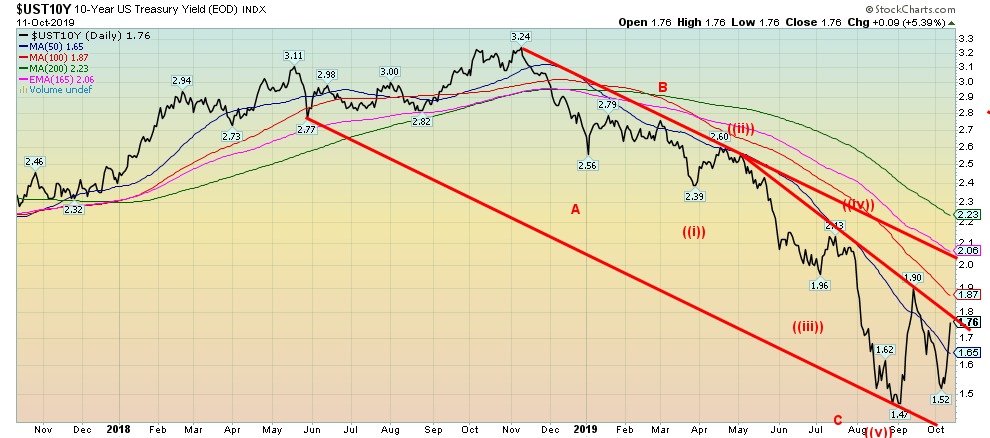
We haven’t changed our thoughts that interest rates may have bottomed. This past week the U.S. 10-year Treasury note leaped to 1.76% from 1.52% the previous week. A double bottom at 1.47% and 1.52% may be in place. In Canada, the 10-year Canadian Government bond (CGB) jumped to 1.52% from 1.23%.
The 10-year German bund rose to negative 0.44% from negative 0.59%. Rising interest rates in the eurozone with $17 trillion of negative yield bonds could prove to be problematic for many bond funds. Historically, blow-ups in the debt markets usually translate into blow-ups in the stock markets. Negatives for the bond markets would be the U.S. and China finding a way out of their trade wars. We have noted that, given other problems for President Trump (impeachment?), peace on the trade war side could be his saviour.
Similarly, a way out of the Brexit impasse could also trigger peace in the eurozone; that too would be positive for stocks (at least in the near term) but negative for the debt markets. October 31 is fast approaching. So, we might soon know. Also, as we have noted that while the spreads can go negative, we only become concerned about a recession when after a period of negative spreads, the spreads turn positive once again. The closely watched 2–10 spread improved to 13 bp from 12 bp while the comparable Canadian spread improved to negative 13 bp from negative 18 bp. The other closely watched spread 3-month—10-year improved to +8 bp this past week from negative 19 bp the previous week.
What to watch for? Watch for improved economic numbers. The Michigan Consumer Sentiment Index improved this month to 96.0 when the market only expected a reading of 92.0. Retail sales have remained relatively robust. An improved trade picture could help consumer sentiment further. There are manufacturing numbers out this coming week to watch and a number of Fed officials are speaking.
Also, we don’t know the impact of the Fed’s bond-buying program which we called QE4. It was scheduled to end this week. If it is finished, that would be negative for bond yields.
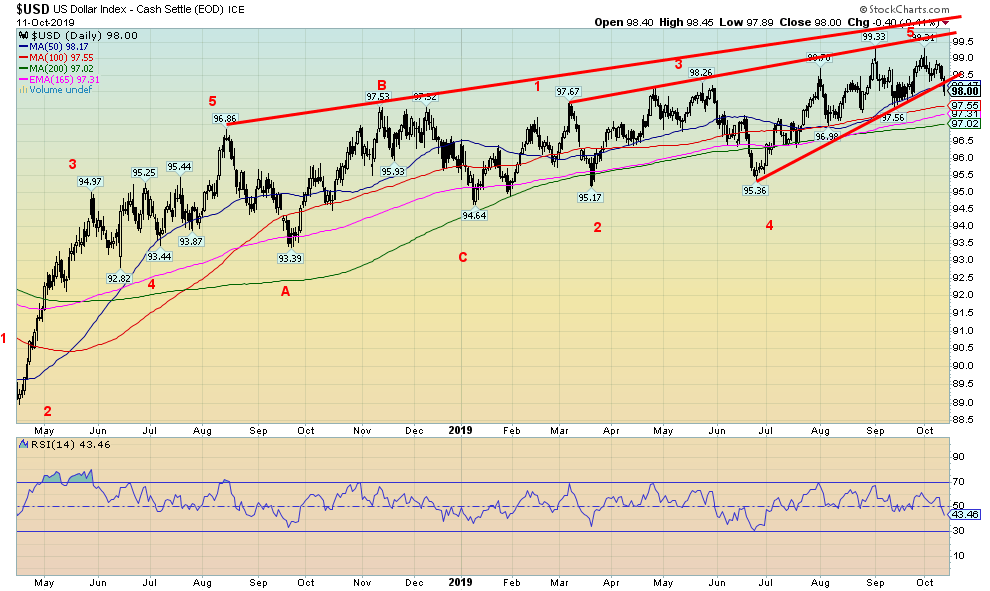
Is the US$ Index preparing to break down? The US$ Index fell this past week to 98 from 98.49 the previous week. We appear to have broken under an up trendline from lows back in June 2019. There is considerable support down to 97. The key breakdown zone remains at 96. We are now under the 50-day MA so we can’t rule out a test of the 100-day MA near 97.55 and the 200-day MA near 97.00.
An improved trade deal with China should be positive for the U.S. dollar. We expect the Chinese yuan could slide further on an improved trade deal. Currencies were mixed this past week. The euro was up 0.7%, but the Swiss franc was off 0.2% and the Japanese yen fell 1.0%. The Canadian dollar rose 1.1% to its best level in weeks. The pound sterling leaped on potentially positive Brexit news, gaining 2.6%.
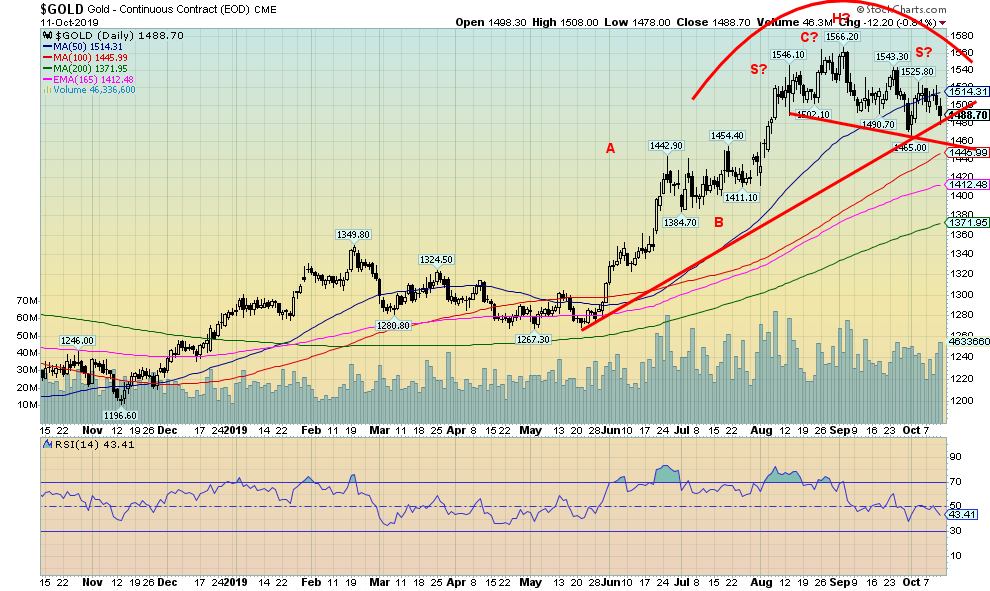
Gold, we believe, is preparing for its next downward draft. A potential awkward-looking head and shoulders pattern has formed. We believe we have completed what to ourselves appears as an ABC pattern to the recent high at $1,566 to complete a potential A wave of a higher degree. A breakdown of $1,460 could potentially target down to $1,360. We note the 200-day MA is currently at $1,371.
A test of the 200-day MA is not unusual. The announcement of at least a temporary truce in the China-U.S. trade wars helped push gold and silver and especially the gold stocks lower on Friday. As well, the potential for a Brexit deal added to gold’s woes this past week. As the stock market roared on Friday, gold and the gold stocks took a hit. An easing of what we term as QE4 could also be negative for gold. If the Fed fails to cut interest rates at the October 28–29 FOMC, meetings that would also be negative for gold. Supportive of gold is the impeachment crisis along with geo-political tensions in the Mid-East.
Gold fell 1.6% this past week, but silver managed to do better, falling only 0.5%. We view that as a small positive as silver normally leads both up and down. The gold stocks took it on the chin as the Gold Bugs Index (HUI) fell 3.4% and the TSX Gold Index dropped 4.0%. Both appear poised to make new lows for the current move down. Platinum managed a gain of 1.5% and palladium continued its record run to new all-time highs gaining 1.7%. Copper benefitted from the trade war truce with a gain of 2.6% on the week.
While peace on the trade front is negative for gold, the ongoing geopolitical conflicts, particularly the outbreak of hostilities between Turkey and the Kurds, is something that could be supportive of gold. Syria could quickly become involved and the conflict would turn into a regional one.
The commercial COTs this past week continue to be a negative for gold and silver. The gold commercial COT came in at 26%, unchanged on the week, and the silver commercial COT was also unchanged at 33%. Gold’s long open interest rose roughly 4,700 contracts, but short open interest also jumped roughly 12,000 contracts. The same happened with silver as long open interest jumped a small 300 contracts but short open interest leaped roughly 3,400 contracts. It’s surprising then that the overall COT remained unchanged at 33%. Nonetheless, the COTs remain a negative for both gold and silver.
Gold has an interesting cycle of roughly 11 months and our expectations are that this could see gold bottom in November. We’d be watching for a low in gold roughly around mid-November. As noted, gold breaks down under $1,460. Silver breaks down under $17 but especially under $16.75. Major support for silver is down around $15.90 but technical targets are as low as $13.25.
We doubt we would fall that low but we are aware. Gold becomes more positive above $1,550, silver above $18. However, we are in a seasonally weak period for gold and silver and our expectations are lower prices, not higher at the moment. Ultimately, we are still supporting a potential run to over $1,700 once this corrective period is over.
We believe gold is making a potential large ABC-type pattern to the upside and we may have completed the A wave. The B wave would be next followed a huge C wave to the upside. Could we be wrong? Yes, but our breakdown levels at this point are way below $1,250 and silver under $14.60.
Right now, we are more concerned about the gold stocks as the TGD is potentially targeting down to 175–185 once it breaks under 230. The TGD closed just under 236 on Friday. Major support is seen between 210 to 220, but a dip under that level would not be a surprise.
We remain optimistic that once a low is found, hopefully in November, a major rally could get underway. If the low doesn’t come in November it would in December and probably early December.
Stock markets and trends
—
(Featured Image by Pexels)
DISCLAIMER: David Chapman is not a registered advisory service and is not an exempt market dealer (EMD). We do not and cannot give individualized market advice. The information in this article is intended only for informational and educational purposes. It should not be considered a solicitation of an offer or sale of any security. The reader assumes all risk when trading in securities and David Chapman advises consulting a licensed professional financial advisor before proceeding with any trade or idea presented in this article. We share our ideas and opinions for informational and educational purposes only and expect the reader to perform due diligence before considering a position in any security. That includes consulting with your own licensed professional financial advisor.


The TopRanked.io Guide to 2026’s Biggest and Best Affiliate Opportunities
Want to earn affiliate commissions on literal billions of dollars worth of revenue? Then this week, we've got something special...


Eni Advances Energy Transition with Major Investment and Emissions Cuts
Eni showcased its “Just Transition” report in Rome, highlighting stakeholder collaboration and progress toward decarbonization goals. The company invested over...


The German Fintech Market Shows Resilience and Strong Investment Growth in 2026
Germany’s fintech sector remained resilient in 2026 despite economic crisis and rising insolvencies. Investments reached €14.2 billion, showing strong investor...


Cannabis Legalization in Germany: A Mixed Interim Assessment
Germany’s cannabis legalization has reduced criminal cases and eased pressure on the justice system, while the black market is slowly...


Sustainable Restoration of the Haus Hövener Garden in Brilon
The Brilon Construction Workers Association is restoring the Haus Hövener garden into a cultural community space, funded through a €10,000...
 |
|
 |  |
 |
|
-

 Cannabis2 weeks ago
CBD Vending Machines Face Ban Under New French Restrictions
-
 Crowdfunding2 days ago
Sustainable Restoration of the Haus Hövener Garden in Brilon
-

 Crowdfunding1 week ago
Impact Food Launches Crowdfunding to Expand Plant-Based Fast Food Concept
-

 Markets5 days ago
Sugar Markets Rise Slightly Amid War, Oil Price Pressure, and Strong Global Supply