Featured
Stocks Rallied But It Wasn’t Enough to Turn Them Positive For the Week
While the jobs report was largely as expected in the U.S. and well above expectations in Canada, markets turned on the jets after the release. Investor’s it appears were triggered by a record negative spreads between bonds and short rates. The 2-10 spread hit negative 50. The market pounced on it as a signal of an impending deep recession.
The major events of the week were the Fed’s rate hike 75 bp and Friday’s job numbers. The rate hike was as expected but after an initial positive reaction to the hike, the markets turned south on fear of more rate hikes.
Dow Jones Industrials (DJI), Gold 15-minute chart, November 2, 2022
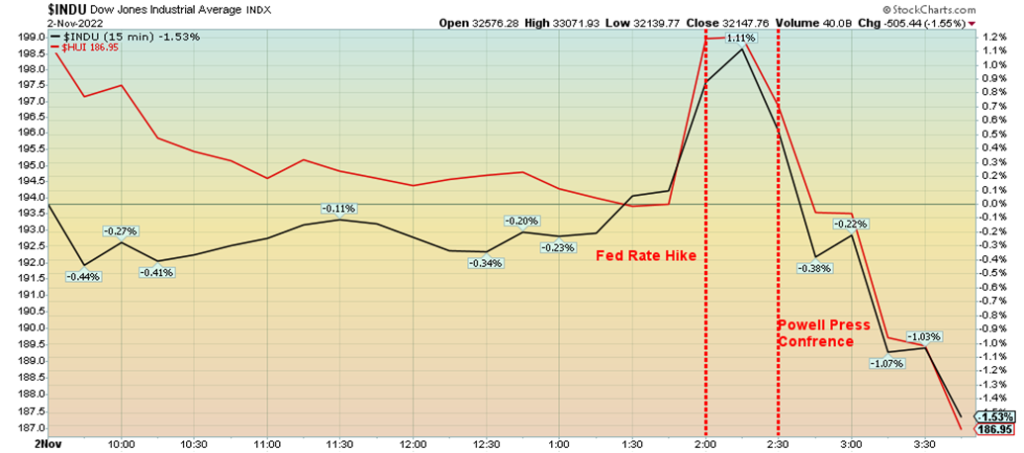
Steady as it goes 9:30 am–2:00 pm. Fed rate hike as expected, might consider policy changes. Market reaction—buy, market moves higher at 2:00 pm. Then, Powell speaks of inflation being problematic: “The ultimate level of interest rates will be higher than previously expected.” Sell – markets tank, 2:30 pm.
We call those “round-trip days”, meaning steady in the AM and, until shortly before the Fed announcement, stock markets are down somewhat. Then comes the Fed announcement and markets take off and up. Then Fed Chair Jerome Powell throws cold water on everything and markets tank. And by everything we mean stocks, bonds, and gold. The US$ Index rose sharply.
U.S. Inflation Rate vs. Canada Inflation Rate 2018–2022
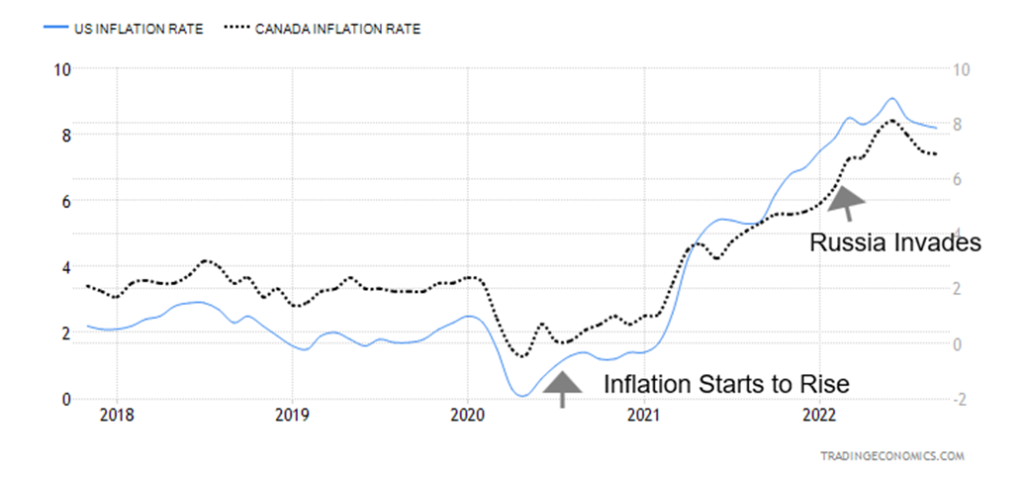
Inflation is the big bugaboo. But, as this chart shows, inflation started rising long before Russia invaded Ukraine, causing oil prices to spike. So, what caused it? Supply chain disruptions as result of the pandemic? Supply chain problems were showing up before the rise in inflation. Or was it the huge amounts of money poured into the financial system by central banks and governments to combat the pandemic? No doubt that played a role, but the real impact would come later when people spent the funds and pushed demand higher. Combine that with supply disruptions and shortages and suddenly you have rising prices.
It is noteworthy that oil prices plunged to negative levels at the height of the pandemic in 2020. OPEC cut production to try and deal with the sudden collapse of the price. They never really replaced the production cuts. Oil prices jumped quickly back to levels before the pandemic struck. Then demand started to perk up in 2021, pushing oil prices even higher over $60, due to growing disruptions in supply. The final nail in the coffin was the build-up towards an invasion that helped push prices even higher towards $100. By the time the invasion happened we were actually approaching the top. The rise in oil prices had all sorts of knock-on effects on the rest of the economy. But the reality is the EU was in a quandary as supplies were cut.
Fed Balance Sheet vs. CPI, 10-year Treasury, Fed Funds Rate 2018–2022
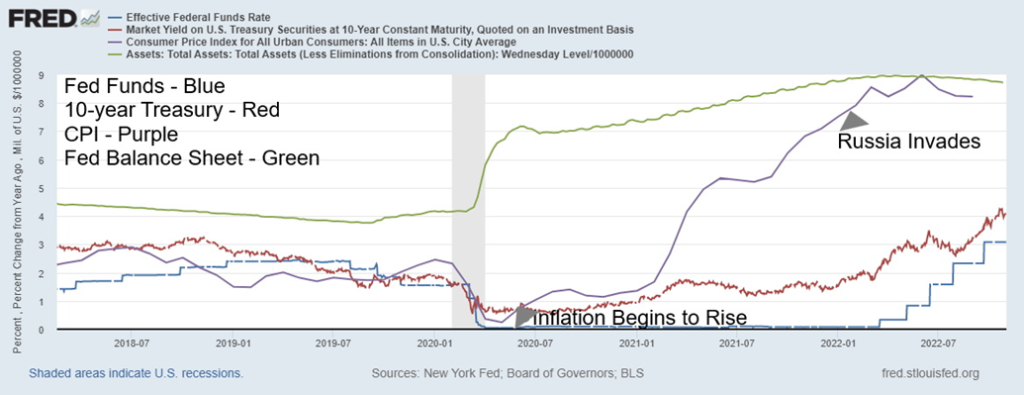
Interest rates, as measured by the U.S. 10-year treasury note rose, slowly as inflation rose. But it wasn’t until 2022 that the 10-year really started to heat up and the Fed and other central banks belatedly reacted to the sharply-rising inflation by raising interest rates. Yes, the central banks and governments pumped billions into the economy to combat the effects of the pandemic and prevent an economic collapse, but that doesn’t appear to be the prime reason inflation rose. In 2021, demand started to reappear. Combine that with supply disruptions and OPEC oil cuts, and inflation started to rise. Inflation is already starting to moderate and, as one can see, the central banks have moved from quantitative easing (QE) to quantitative tightening (QT). That in turn would tighten the financial system further.
Canada Bank Rate vs. Canada Money Supply (M1) 2018–2022
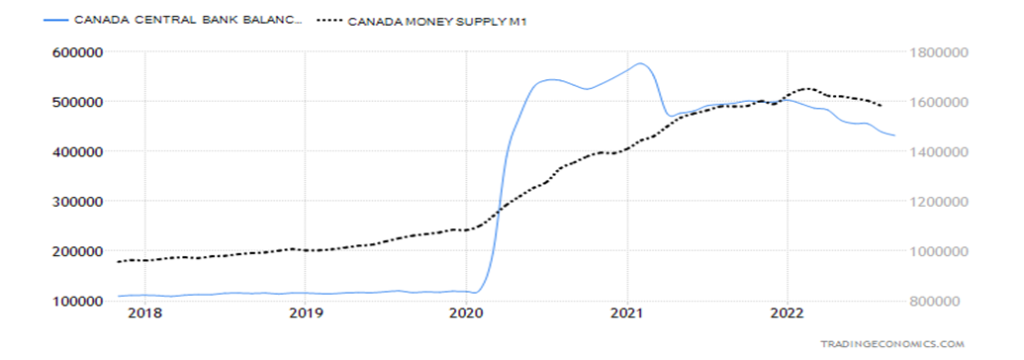
It is no surprise that, as the governments pumped funds into the system and the central banks embarked on QE, money supply rose. Above is the situation in Canada, but it was the same everywhere—U.S., U.K., EU.
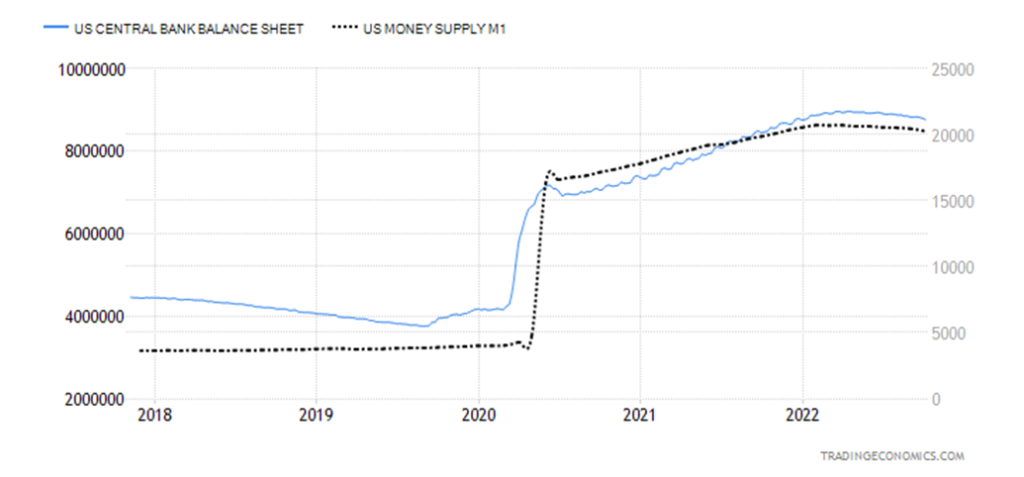
U.S. Fed Balance Sheet vs. U.S. Money Supply (M1) 2018–2022
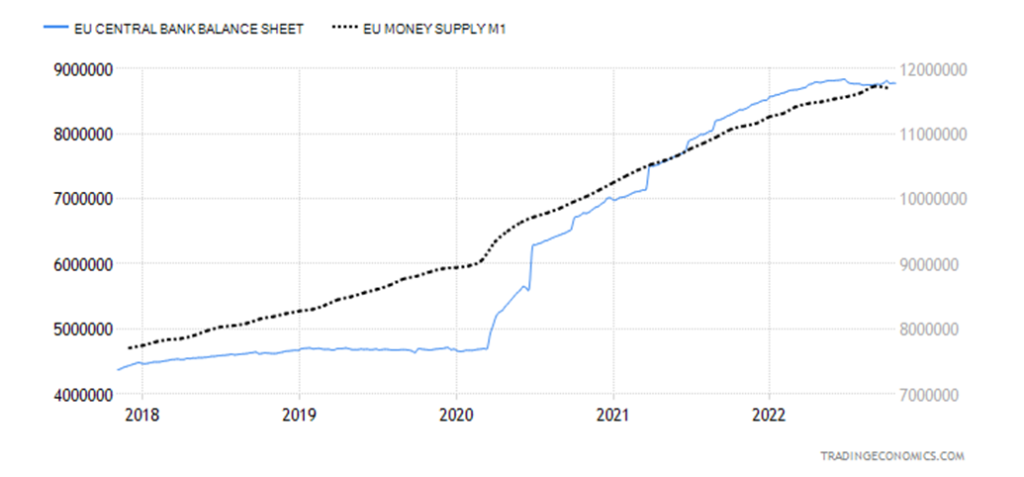
ECB Balance Sheet vs. EU Money Supply (M1) 2018–2022
Bank of Canada Rate vs. 10-year Government Bond (CGB) 2018–2022
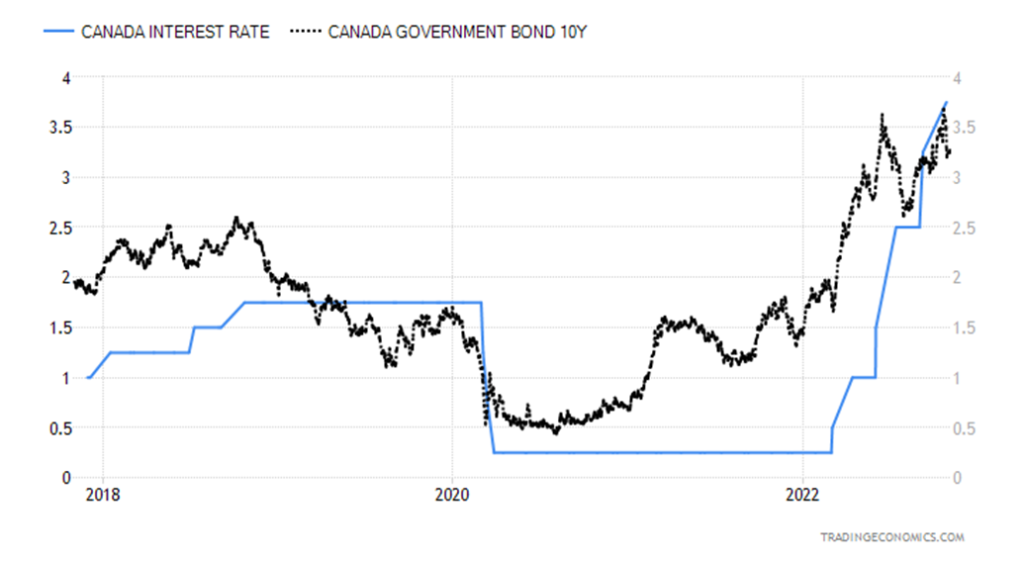
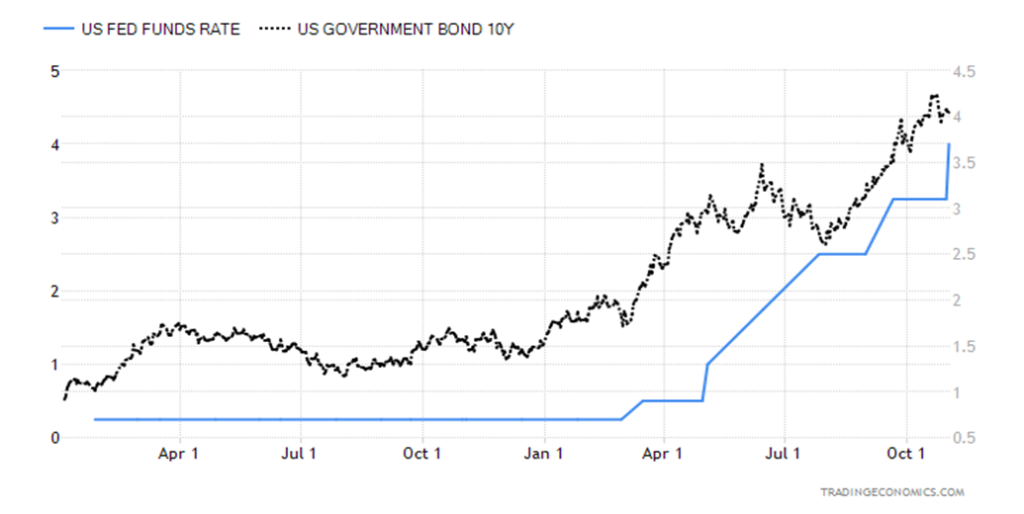
As the two previous charts show, interest rates never really started to rise sharply until the central banks belatedly started hiking rates. Bond yields may not have topped yet. But rising interest rates feed into everything else and interest rates on mortgages, HELOCs, car loans, LOCs, and more rose as bond yields rose and central banks hiked rates.
Unemployment Rate vs. CPI 1990–2022
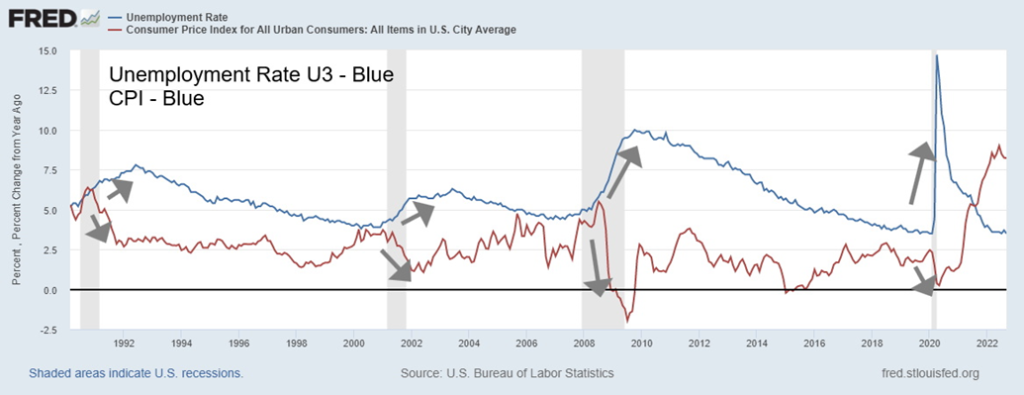
Rising unemployment is a lagging indicator, as this chart shows. Inflation starts to come down as unemployment rises and the economy slows. Rising mortgage rates put downward pressure on house prices and we are already seeing the impact of that. The central banks are hoping for a soft landing. But the reality is the economy’s fragility will be severely tested and a hard landing is more likely. Too many excesses were built up before this, particularly excesses in the stock market, housing market. and numerous other asset classes. Price inflation didn’t dominate like it does today as inflation remained low within the Fed’s and the BofC’s guidelines from 2008–2021. Instead, it was asset inflation during this period spurred on by endless rounds of QE, record-low interest rates, and government fiscal largesse trying to prevent a collapse as unemployment rose first from the financial crisis of 2008 and then the pandemic of 2020–2021.
Now the piper has to be paid and we can’t tell how steep that price will be. So far, there has been no major bond collapse or a large corporation or bank collapsing. Credit Suisse has been mentioned and there are vulnerabilities in the banking system, but today’s banks are in a much better position to weather a storm than they were in 2008. This is because regulations were put in place as a result of the financial crisis of 2008 and the banks over the past dozen or so years raised billions in new capital. Still, none of this is stopping the stock markets from revaluing downwards and housing prices doing the same. There will, no doubt, be a lot of individual bankruptcies (this is already happening) and even a large corporation going under. The biggest vulnerabilities in the banking system are in the EU and a collapse there could spark global contagion. We’ve already seen what happened in the U.K. when governments stepped in and did the wrong thing, sparking a
financial crisis, the resignation of a prime minister, and massive intervention from the central bank (BOE) to prevent a gilt and pound sterling collapse.
There are few ways to wrestle inflation to the ground. Letting it run its course could spark an even worse bout of inflation. Western countries have largely been immune from the high inflation that plagues many countries like Turkey’s 85%, Argentina’s 83%, and Venezuela’s 114%. Notably, there is also considerable social unrest in these countries as well. There are few tools to combat it except to raise interest rates and slow the economy to help moderate the rate. However, neither central banks nor governments can control wars, climate change, or pandemics. Sanctions and trade wars are being led and initiated by the U.S. Inflation, rising interest rates, and threat of recession spill over into stock and housing markets. That could lead to social unrest as workers struggle to keep up with inflation while corporations and governments try to knock them down. Stock markets are down upwards of 20% or more from their highs and housing markets are also tumbling down 10% to 20% in Canada and the U.S. Have they bottomed? Probably not.
One of the early drivers of inflation, as we noted, was OPEC’s production cuts following the collapse in energy prices during the pandemic. Notably those cuts have never been reversed. OPEC has added more cuts recently. Add in the ongoing war between Russia/Ukraine and you have a perfect storm for high energy prices. Energy prices are global, so it is not just a case of, for example, raising production levels in North America to bring prices down. Then there are supply disruptions as a result of the pandemic, trade wars, particularly between the U.S. and China, and sanctions against numerous countries, such as Russia, North Korea, Venezuela, and Iran. As we witnessed in the 1930s, trade wars and sanctions have consequences.
One shouldn’t underestimate the role of climate change in inflation, particularly as it relates to food prices. Droughts are prominent in food-growing regions of North America, South America, Africa, Europe, and Asia. Droughts are global. If it’s not droughts, it’s severe weather sparking major flooding as we’ve seen in China, and, along with the impact of wars, you have the perfect storm for food prices globally. None of these issues noted will be resolved overnight as they threaten to drag on for years.
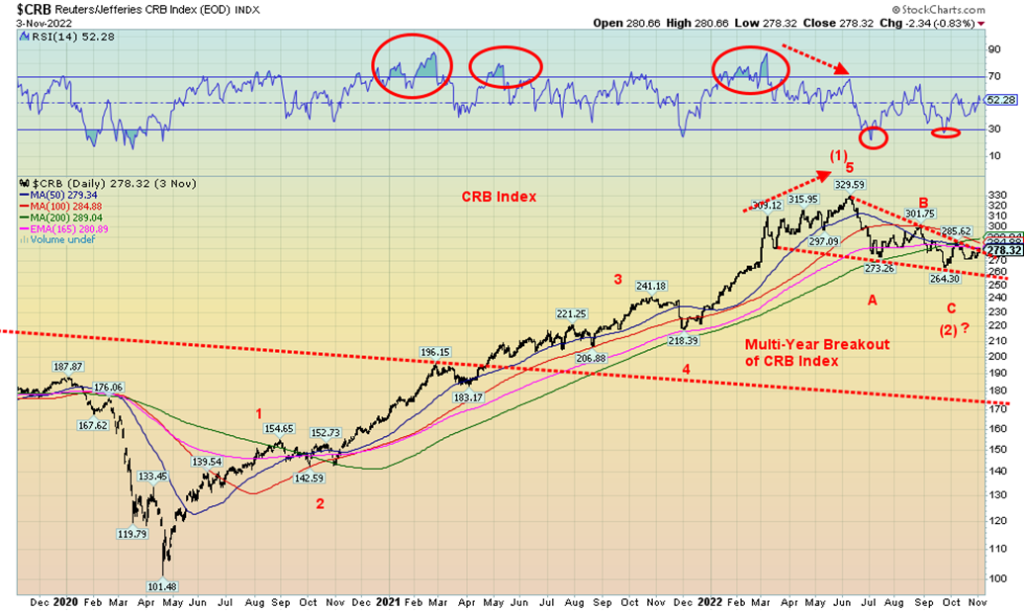
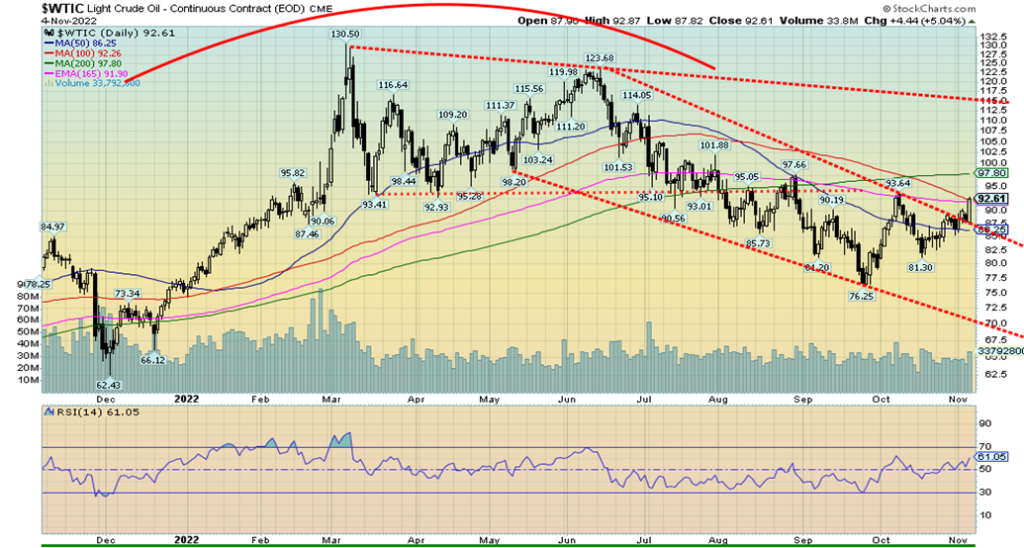
Below is a chart of the CRB Commodity Index. The CRB Index is an index measuring a basket of 19 commodities with 39% allocated to energy (crude oil, heating oil, natural gas, gasoline), 7% precious metals (gold, silver), 13% industrial metals (aluminum, copper, nickel), and 41% agriculture (cocoa, coffee, corn, cotton, lean hogs, live cattle, orange juice, soybeans, sugar, wheat). The CRB Index made a major multi-year bottom in 2020. Since then, it has embarked on a major upswing. We believe the index made five waves up from the April 2020 low, topping in June 2022 with a gain of 225%. Since then, the CRB Index has been correcting thus far in an ABC pattern. So far, the index has pulled back by 20%, a fairly normal correction. The index has possibly more to correct in terms of price and time. However, ultimately it should break out to the upside for what could be an intermediate wave three to the upside. A move over 290 would confirm the breakout.
As we have previously noted, we are currently in the summer of the Kondratiev Wave. Stock and bond markets perform poorly while commodity markets outperform. We are already seeing evidence of that. There is more to come. Oil, gold, and agriculture products should all continue to do well, regardless of where things are today.
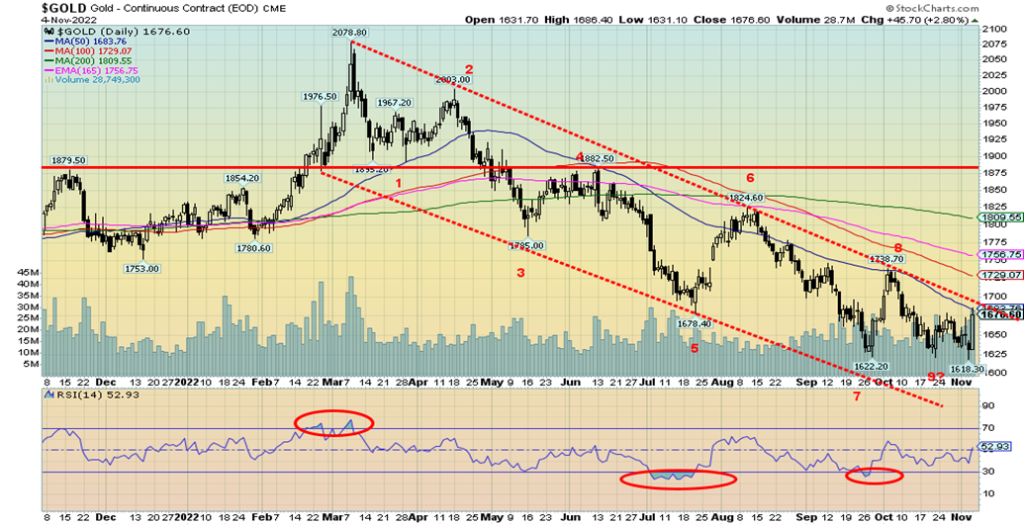
We saw some sudden effects on commodities at the end of the week when, unexpectedly on Friday, gold, oil, silver, and natural gas leaped following the job numbers. Gold made fresh 52-week lows on Thursday, then reversed and on Friday closed through our first resistance level of $1,675, putting in an outside reversal week. Gold rose $50 in a single day an almost unheard-of event. A bullish sign. Oil jumped over $90, silver approached $21 gaining 8.5% on the week, and natural gas (NG) leaped 12.7% on the week, the second consecutive strong up week. Gold stocks joined the party with 10% gains in the day not unusual. This should set gold on course for our next important breakout points at $1,700/$1,725 and oil towards $100. The CRB Index gained 5.4% on the week vs. stocks and bonds both down on the week, lending credence to our belief that commodities should outperform during the summer of the Kondratiev wave.
We leave with our chart on gold and oil below. As noted, $1,700/$1,725 is our next point to be taken out to confirm that a low is in place. Oil over $90 confirms a low in a place. The ARCA Oil & Gas Index (XOI) made fresh 52-week highs.
Job Numbers
U.S. Unemployment
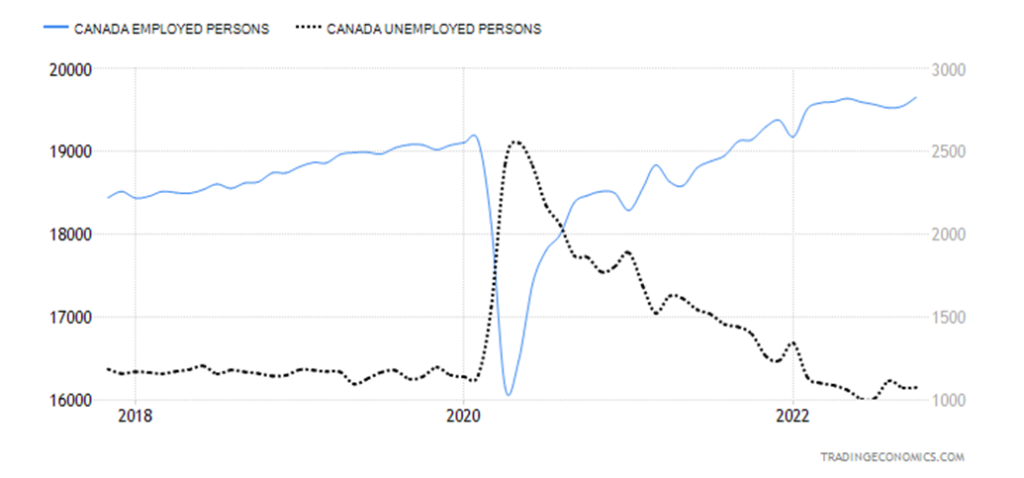
Both Canada and the U.S. reported higher-than-expected job numbers in October. What that is showing is both economies so far are able to continue to weather the storm of inflation and rising interest rates. Canada was a big winner, reporting a completely unexpected gain of 108,300 jobs when only about 10,000 jobs were expected. The unemployment rate was steady at 5.2% vs. the expected rise to 5.4%. Jobs were full-time as well as they gained 119,300 while part-time employment fell 11,000. The labour force participation rate rose to 64.9% from 64.7%. The total labor force expanded to 20,729.6 thousand from 20,619.5 thousand as new entrants came into the market. This is against a background of a rising labor force population defined as all those 15 years of age and over, as that was up 51,600 in October as well. With the big gains in full-time employment, industries benefitting were manufacturing, construction, accommodation, and food services. Numbers were down in wholesale and retail trade and natural resources. More people were finding work, especially immigrants. Most provinces benefitted, especially Ontario and Quebec. The R8 unemployment rate, which is the highest level reported by Statistics Canada that includes discouraged workers and involuntary part-timers fell to 6.2% from 6.3%. Overall, these numbers were great and unexpected. The Canadian dollar strengthened by 1.9% on Friday, a big jump, although helped by the big jump in oil prices as well. It was the biggest jump in 12 years.
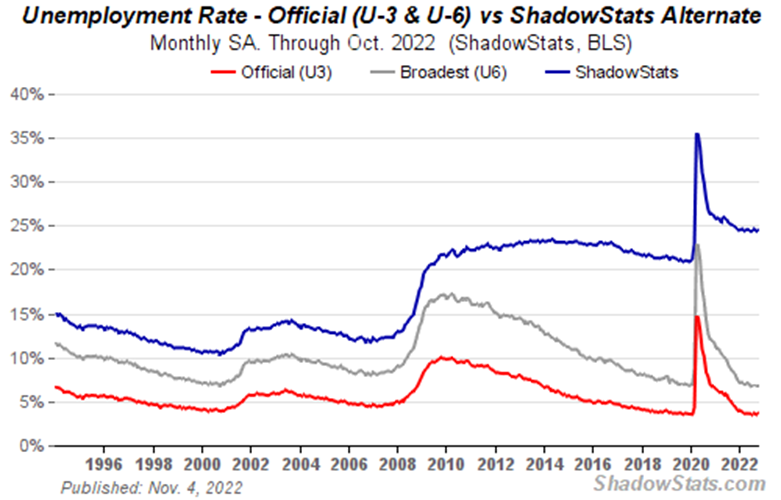
Despite the unexpected jump of 261,000 nonfarm payroll jobs in October vs. the expected 240,000 and 315,000 in September, the unemployment rate (U3) rose to 3.7% from 3.5%, the U6 unemployment rate (U3 plus short-term unemployed discouraged workers and marginally attached workers seeking full-time employment) rose to 6.75% from 6.73%. The Shadow Stats (www.shadowstats.com) unemployment number, which is U6 plus long-term unemployed over one year and those defined out of the work force with a change in 1994, rose to 24.5% from 24.4%. The labour force participation rate slipped to 62.2% from 62.3% while the employment population ratio also slipped to 60.0% from 60.1%. Despite the jump in nonfarm, the civilian labour force shrunk by 125,000 in October, even as the total population of those 15 years of age and over rose by 179,000. So, we have jobs up, labour force down, and those considered the broader population of the employable up. Those not in the labour force rose by 201,000.
U.S. jobs have barely recovered where they were in February 2020. Yes, they are up by 804,000, but then the total population of those eligible to be working is up 4,907 thousand. Put all these together and if the U.S. economy was functioning at the full level that it should be at, there should be 5 million more jobs today than in February 2020. This is as reported by Shadow Stats. What all this tells us is, while the Canadian economy is performing quite well vs. where it was before the pandemic, the U.S. economy is grossly underperforming despite the increase in employment.
It’s no surprise then that the U.S. dollar fell sharply following the release of the employment numbers and sparking a $50 leap in gold prices. The consensus is still that the Fed will need to moderate its rate of hiking interest rates going forward. That also helped the stock market that saw the Dow Jones Industrials (DJI) jump over 400 points although the DJI closed down on the week. The DJI continues to struggle at the 200-day MA, while the S&P 500 is well short of that mark. So far, another 50 bp appears to be on the table for December.
Markets & Trends
| % Gains (Losses) Trends | ||||||||
| Close Dec 31/21 | Close Nov 4/22 | Week | YTD | Daily (Short Term) | Weekly (Intermediate) | Monthly (Long Term) | ||
| Stock Market Indices | ||||||||
| `S&P 500 | 4,766.18 | 3,770.55 | (3.4)% | (20.9)% | neutral | down | neutral | |
| Dow Jones Industrials | 36,333.30 | 32,403.22 | (1.4)% | (10.8)% | up | neutral | neutral | |
| Dow Jones Transport | 16,478.26 | 13,474.08 | (0.7)% | (18.2)% | up | down | neutral | |
| NASDAQ | 15,644.97 | 10,475.22 | (5.7)% | (33.0)% | down | down | down (weak) | |
| S&P/TSX Composite | 21,222.84 | 19,449.81 | (0.1)% | (8.4)% | up | down | neutral | |
| S&P/TSX Venture (CDNX) | 939.18 | 593.70 | (0.5)% | (36.8)% | down (weak) | down | down | |
| S&P 600 | 1,401.71 | 1,171.36 | (2.1)% | (16.4)% | up | down (weak) | neutral | |
| MSCI World Index | 2,354.17 | 1,769.39 | (1.8)% | (24.8)% | neutral | down | down | |
| Bitcoin | 47,907.71 | 20,978.91 | 2.2% | (56.2)% | up | down | down | |
| Gold Mining Stock Indices | ||||||||
| Gold Bugs Index (HUI) | 258.87 | 199.02 | flat | (23.1)% | up | down | down | |
| TSX Gold Index (TGD) | 292.16 | 238.70 | (1.5)% | (18.3)% | neutral | down | down | |
| % | ||||||||
| U.S. 10-Year Treasury Bond yield | 1.52% | 4.17% | 3.7% | 174.3% | ||||
| Cdn. 10-Year Bond CGB yield | 1.43% | 3.51% | 8.3% | 145.5% | ||||
| Recession Watch Spreads | ||||||||
| U.S. 2-year 10-year Treasury spread | 0.79% | (0.49)% | (25.6)% | (162.0)% | ||||
| Cdn 2-year 10-year CGB spread | 0.48% | (0.63)% | (3.3)% | (231.3)% | ||||
| Currencies | ||||||||
| US$ Index | 95.59 | 110.77 | 0.1% | 15.8% | neutral | up | up | |
| Canadian $ | .7905 | 0.7423 | 1.0% | (6.1)% | neutral | down | down | |
| Euro | 113.74 | 99.61 | flat | (12.4)% | up (weak) | down | down | |
| Swiss Franc | 109.77 | 100.63 | 0.3% | (8.3)% | down | down | down | |
| British Pound | 135.45 | 113.79 | (2.0)% | (16.0)% | neutral | down | down | |
| Japanese Yen | 86.85 | 68.23 | 0.6% | (21.4)% | down (weak) | down | down | |
| Precious Metals | ||||||||
| Gold | 1,828.60 | 1,676.60 (new lows) | 1.9% | (8.3)% | down (weak) | down | down (weak) | |
| Silver | 23.35 | 20.78 | 8.5% | (11.0)% | up | down | down | |
| Platinum | 966.20 | 960.50 | 1.2% | (0.6)% | up | neutral | down (weak) | |
| Base Metals | ||||||||
| Palladium | 1,912.10 | 1,839.50 | (3.0)% | (3.8)% | down | down | neutral | |
| Copper | 4.46 | 3.69 | 7.6% | (17.3)% | up | down | neutral | |
| Energy | ||||||||
| WTI Oil | 75.21 | 92.61 | 5.4% | 23.1% | up | down | up | |
| Nat Gas | 3.73 | 6.40 | 12.7% | 63.2% | down (weak) | down (weak) | up | |
Copyright David Chapman, 2022
__
(Featured image by sergeitokmakov via Pixabay)
This article may include forward-looking statements. These forward-looking statements generally are identified by the words “believe,” “project,” “estimate,” “become,” “plan,” “will,” and similar expressions. These forward-looking statements involve known and unknown risks as well as uncertainties, including those discussed in the following cautionary statements and elsewhere in this article and on this site. Although the Company may believe that its expectations are based on reasonable assumptions, the actual results that the Company may achieve may differ materially from any forward-looking statements, which reflect the opinions of the management of the Company only as of the date hereof. Additionally, please make sure to read these important disclosures.
David Chapman is not a registered advisory service and is not an exempt market dealer (EMD) nor a licensed financial advisor. He does not and cannot give individualised market advice. David Chapman has worked in the financial industry for over 40 years including large financial corporations, banks, and investment dealers. The information in this newsletter is intended only for informational and educational purposes. It should not be construed as an offer, a solicitation of an offer or sale of any security. Every effort is made to provide accurate and complete information. However, we cannot guarantee that there will be no errors. We make no claims, promises or guarantees about the accuracy, completeness, or adequacy of the contents of this commentary and expressly disclaim liability for errors and omissions in the contents of this commentary. David Chapman will always use his best efforts to ensure the accuracy and timeliness of all information. The reader assumes all risk when trading in securities and David Chapman advises consulting a licensed professional financial advisor or portfolio manager such as Enriched Investing Incorporated before proceeding with any trade or idea presented in this newsletter. David Chapman may own shares in companies mentioned in this newsletter. Before making an investment, prospective investors should review each security’s offering documents which summarize the objectives, fees, expenses and associated risks. David Chapman shares his ideas and opinions for informational and educational purposes only and expects the reader to perform due diligence before considering a position in any security. That includes consulting with your own licensed professional financial advisor such as Enriched Investing Incorporated. Performance is not guaranteed, values change frequently, and past performance may not be repeated.


Switzerland’s Medical Cannabis Reform Advances Access, But Barriers Remain
Switzerland’s 2022 medical cannabis reform improved patient access by removing federal approval requirements, but challenges remain. MEDCAN highlights barriers including...


Swisscanto Launches Catastrophe Bond Fund for Portfolio Diversification
Swisscanto launches a Luxembourg UCITS catastrophe bond fund, giving qualified investors access to insurance-linked securities tied to extreme natural events....


AI Agents Transform Payments as Visa, Mastercard, and Qonto Tackle Trust, Liability, and Regulation
Visa and Mastercard are advancing AI-driven autonomous payments, shifting focus to trust, liability, and regulation when agents act without real-time...

Bitcoin ETFs Lead as German Stock Exchange Debuts Mining ETF
Bitcoin and Ethereum remain largely flat, with BTC near 66,600 and ETH around 1,920, while ETFs see steady inflows. A...


Ali G Makes Surprise Wimbledon Appearance with Cannabis-Themed Satire
Sacha Baron Cohen revived his iconic Ali G character at Wimbledon’s men’s final, blending satire with British high society. Dressed...
 |
|
 |  |
 |
|
-

 Markets2 weeks ago
Dow Jones Pauses Near Record Highs as Precious Metals Lead
-
 Impact Investing16 hours ago
Swisscanto Launches Catastrophe Bond Fund for Portfolio Diversification
-

 Fintech1 week ago
Advanced Blockchain Under Pressure Amid Crypto Market Shifts
-

 Impact Investing2 weeks ago
ICSC Raises €500M Social Bond, Expanding Sustainable Investment Reach