Business
The rare earth element “basket price” deception
Anyone familiar with the rare earth element (REE) space will have undoubtedly heard the term ‘REE basket price’. It is a common and highly promoted deposit metric, and one that is most often associated with disclosure of heavy REE (HREE) enriched deposits.

| Rare Earth Elements #9 | March 11, 2015 |
| The “REE Basket Price“ Deception and the Clarity of OPEX |
| By Stephan Bogner (Dipl. Kfm., FH) |
 |
|
The “REE Basket Price” Deception and the Clarity of OPEXAnyone familiar with the rare earth element (REE) space will have undoubtedly heard the term ‘REE basket price’. It is a common and highly promoted You may (or may not) be surprised to find out that there is no standard set of prices for the REEs! This leaves public companies to their own devices as to Unfortunately, the REE basket price is too often derived with strong bias, and applied incorrectly and/or inappropriately by companies in a misguided fashion, intentional or otherwise, to convey an REE project’s potential merit to the market. This article will endeavor to bring clarity to the concept of an REE basket price through discussion of how this term is derived, what it illustrates, the numerous limitations/assumptions associated, and the proper context this metric should be applied within. I will also take the discussion a step DEFINITION With respect to REEs, a deposit’s “basket price” (expressed in $US/kg) is defined as the value ($) of one unit mass (1 kg) of separated rare earth oxides (SREOs), in which those SREOs are in the same proportion (i.e. distribution) as the deposit. Note, the term REO is often used instead of REE as this is the form that the final products are priced and sold in the global market, whether or not the specific companies’ business plan is to produce separated oxides. (More on this later). The following table breaks down an example basket price calculation which is for the Ashram Rare Earth Deposit of Commerce Resources Corp., my top pick The price deck applied below attributes a zero $ value for the five HREEs with limited, niche markets that result in poorly constrained trading and pricing information (Ho, Er, Tm, Yb, and Lu). Further, the markets for Ho, Er, Tm, and Yb are typically in over-supply, whereas a colleague recently mused that the main use of Lu was to study Lu. Suffice it to say, there are several niche applications for Lu that have developed in recent years; however these still only provide for limited market demand. 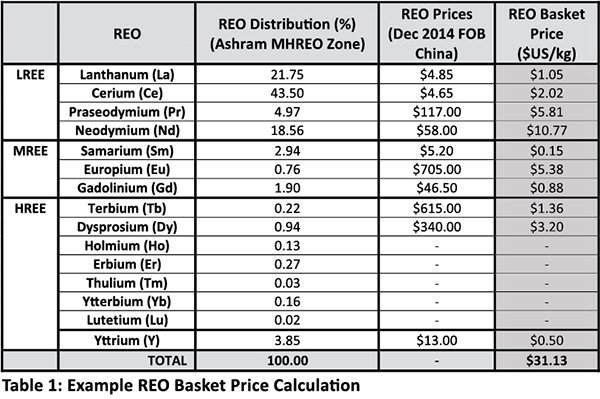 |
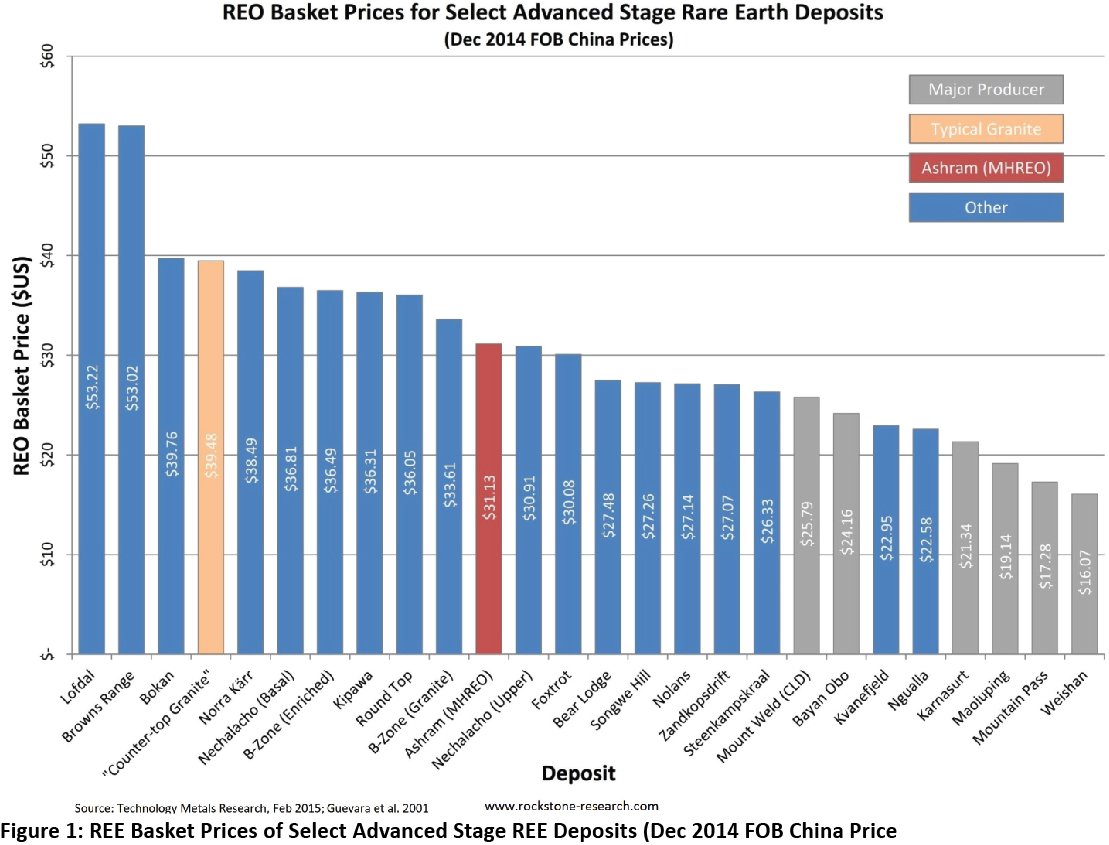
Therefore, it is standard industry practice to assign a zero $ value to these elements for any project economic calculations. It is generally accepted that any cash flow obtained from these elements is viewed as a bonus to the overall economics of the project. An exception to this practice may be if an off-take agreement was in place ensuring sale at a specified price; yet this is a very uncommon event.Notwithstanding this logic and standard practice, it appears that some companies (mainly HREE focused) have been trying to re-define this standard recently in an effort to bolster their project’s basket price.Recent REO basket prices for select advanced stage deposits (economic study completed), as well as the 6 major global hard rock producers, are noted in Figure 1.THE REO PRICE DECK CONUNDRUMThere are two forms or price decks that are applied to create the REE basket price. The first uses current market prices, and the second uses prices set by the company, in collaboration with a third party, for use in an economic study. For cross project comparison, it is essential that the same price deck is used, regardless if current market prices or company denoted prices are used (i.e. an apple to apple comparison).There are three sets of REE market prices.They are Freight on Board China (FOB China), Cost+Insurance+Freight Europe (CIF Europe), and domestic China. It is standard in the industry to use the FOB China prices for any project outside of China, when a current market price deck is used. However,
 the company derived price decks are highly variable with little consensus among the group, and they are always higher than the three aforementioned current market price decks (FOB China, CIF Europe, domestic China). Public REE companies will derive decks based on spot prices, short-term trailing averages, and market studies with general consensus forecasts at the time of production, or a combination thereof. Although the latter is arguably most appropriate for the space, there is no set standard of the REE price deck that will be used as the basis of a project’s economic study. This is a result of poor market transparency and/or poor market understanding, thereby allowing for the opportunity to impart bias into a price deck, irrespective of third party collaboration. Therefore, the REE market dynamics are not as straightforward as gold or copper, where the markets are far more transparent with widely agreed upon pricing model inputs for economic studies. The REE investor must simply trust that logic will guide company management; however, often the allure of making an uneconomic to marginal project appear robust is hard to avoid for some management teams. For example, it was clear during the run-up in pricing in 2011 that the prices were unsustainable, and the term “bubble” was in common use at the time. Yes, some companies chose to use unrealistic spot prices or short-term trailing averages to derive their price decks for their economic studies, creating the appearance of robustness. Alternatively, some companies were cognizant of this notion and used reputable market studies to best define their study’s price deck. The January 2012 Preliminary Economic Assessment (PEA) for the Kipawa Deposit of Matamec Explorations Inc. is widely viewed as the most practical price deck used during the period as it involved end-user input from its joint venture partner Toyota Tsusho. Therefore, it is very important to note the price deck of a project’s economic study in comparison to the current price environment. Companies that are more conservative with their price deck, when compared to market prices at the time, are likely to have best represented the economics of their project, and further, have demonstrated a clearer understanding of the market. Moreover, the companies with conservative price decks will simply suffer less of a correction in terms of today’s prices, than the others who have essentially “shot themselves in the foot” by using prices that were widely viewed to be unsustainable. To further illustrate, the following table 2 highlights some economic study price decks applied by management for four well-known REE companies, and the corresponding market price decks for the periods the studies were released. As the junior REE space matures, a clearer division of the strong projects vs the weak projects has become evident (ability to raise money, market value, project’s technical merit, etc.). The number of quality projects has been winnowed down to only a few; however, several remain that are applying the same promotional price deck tactics in today’s market with current studies. 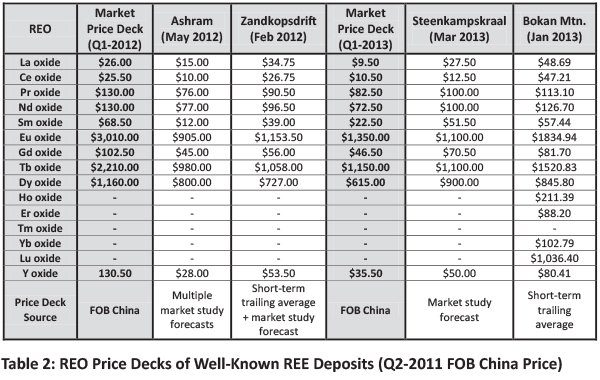 For example, a company released a Prefeasibility Study (PFS) in Q1-2015 with using a Dy oxide price of $575/kg, while the market price at the time was $340-375/kg. This project is strongly HREE enriched, with Dy being the dominant contributor to revenue, yet they used a price for Dy of more than 50% higher than the market price at the time. It is true, the Dy price may continue to improve over time; but a 50% long-term premium is a substantial increase. Although it is a sound project in many regards, if the appropriate market price of Dy is used, I think it is questionable if the project is economic in the current pricing environment. Another company with primarily a Dy deposit released a Feasibility Study (FS) in early March 2015 using a Dy oxide price of $684/kg, without discounting, although their final saleable product is a mixed REC concentrate. A discount to the price deck is required when not proceeding to separated oxides since the price deck is always based on separated REOs. The typical discount ranges between 20% and 40%, meaning the company is attributing nearly $1,000/kg for Dy oxide in a market where it is trading below $400/kg. Further, this company does not disclose its full price deck, only the Dy oxide price, which gives much pause for concern. Again, reading between the lines, it is clear to me that this project is not economic in today’s market and would require a substantially higher long-term Dy oxide price to be economic. To put these two companies into better perspective, it would be comparable to a gold company using a gold price of $2,400 per ounce while the current market price is $1,200 per ounce! The bottom-line is that there is no real way to normalize the economics of REE projects for the typical investor. Some third parties will attempt to normalize by applying the same price deck for their internal discounted cash flow models; however, there is still little consensus on the price decks to apply. This leaves one logical method for the typical investor to relay upon; that being, the most conservative price decks will lead to the most realistic project economics. THE PURPOSE OF A PRICE DECK ‘DISCOUNT’ In many economic studies, as mentioned, a percentage discount is applied to the project’s price deck; this reflects the intent of final sale to be a mixed concentrate product (REO, REC, RECl) as opposed to separated REOs, for which a price deck reflects. This is essential in order to apply a more appropriate pricing to the product of sale. Companies that will not pursue separated oxides, yet fail to apply this discount to their price decks used in their economics studies, will end up with a deeply flawed and misleading document. An alternative that appears to becoming more common is for companies to add a tolling price ($/kg REO) to their OPEX (mining through to mixed concentrate in $/kg REO) and then market SREO as their final products. Both the discount and tolling methods are valid; however, both rely on a solid understanding of the market and the costs required for separation in order to apply appropriately. For more advanced studies, an agreement with a tolling processor would be required before the inclusion of tolling in any economics. THE PRICE DECK LIMITATIONS & ASSUMPTIONS There are many inherent, and somewhat obvious, limitations to the REE basket price metric. To be specific, the basket price does not account for:
To best illustrate these limitations/assumptions, I would like to use the classic “counter-top granite” example (Figure 1): Granite is a common rock type found at Earth’s surface and is well recognized in everyday life, being used as floor tiles, paving stone, building stone, cemetery headstones, and of course counter-tops. However, most do not realize that the typical granite is actually HREE enriched with a relatively high REE basket price. Looking at this metric alone, the “counter-top granite” looks like an excellent deposit to advance and promote, doesn’t it? The typical granite, however, is far from an REE deposit. It has a negligible grade, at ~200-400 ppm total REO, and would be incredibly difficult to upgrade to a mineral concentrate. Immediately, this rock is removed from any deposit contention after failing just one of the numerous metrics that the basket case ignores (point #1 above). To extend this thought a step further, the waste rock of most REE deposits will have a higher basket price than the mineralized ore, but will be of negligible grade. Therefore, grade is a very important factor not to be ignored. There exist several deposits in the REE space that are being actively promoted yet are basically variations of the ‘counter-top granite’. Further, it is well-known that deposits with higher basket prices also have among the lowest grades in the space. Simply put, lower grade deposits must mine more material to achieve the same amount of REO produced when compared to higher grade deposits. This may significantly increase the OPEX-CAPEX and thus make the final economics of the project less attractive. Alternatively, grade may be coupled with the basket price to give the $ value per tonne of ore in the ground (in-situ), also referred to as Gross Metal Value (GMV) expressed in $/t. The in-situ value per tonne for select HREE deposits is noted in Figure 2 “In-Situ REO Value of Select Advanced Stage REE Deposits” (see next page). There is a general inverse relationship with the higher basket price deposits having a lower in-situ value per tonne of ore and is due to the lower grade of those deposits. This in-situ value per tonne metric adds grade to the equation, but has its own limitations including all those associated with the basket price. For example, tonnage of the ore deposit is not accounted for, which is a severe issue for many REE deposits being promoted as we speak. It is also quite evident that a high basket price is not required for production. This is clearly illustrated in Figure 1 through the six major global hard-rock producers that have basket prices between ~$16 and $26 in the current market. Clearly, the project’s economics must be taken into account, including the REE mineralogy, the grade, and the difficulty of processing that may exist. These are metrics that the basket price does not incorporate. The basket price is also a dynamic metric that fluctuates as the individual oxide prices change in the market. This makes it that much harder to place a basket price into context with other metrics. At best, it is a limited measure of a snapshot in time that may, at times, be entirely unrealistic. As evidenced back in 2011, at the height of the rare earth pricing bubble, the sky-high REE prices dramatically inflated all project basket prices (see Figure 3 on next page: REE Basket Prices of Select Advanced Stage REE Deposits; Q2-2011 FOB China Price). The basket price term, when used on ore, also assumes a 100% REO recovery from ore to final product for each individual REO. However, this is not possible as losses will inevitably occur during processing, and further, these losses will vary from one REO to another, resulting in an REE distribution that is different from the mined material (i.e. ore) for which the basket price is calculated. In other words, the REE basket price distribution applied to ore, will never reflect the actual distribution of the final saleable product(s). Another poorly understood aspect of the REE industry is the number and variability in saleable product forms and specifications that the REEs may be marketed in. The prices for each of these products may vary widely based on form and purity, and therefore vary in price, making comparison very difficult. For a project to project comparison of basket price, the most appropriate method is to apply it to the mixed concentrate (e.g. REC, REO, RECl), as all REE projects will need to produce this as an intermediate product feed to the separation facility. Through the separation process, the recovery, and thus, distribution, will not likely change materially. Unfortunately, very few companies report this distribution in their disclosure, making a project comparison impossible. Finally, the industry has coined the terms critical REO (CREO), magnet feed REO (MFREO), and most recently Jack Lifton has thrown in market critical rare earths 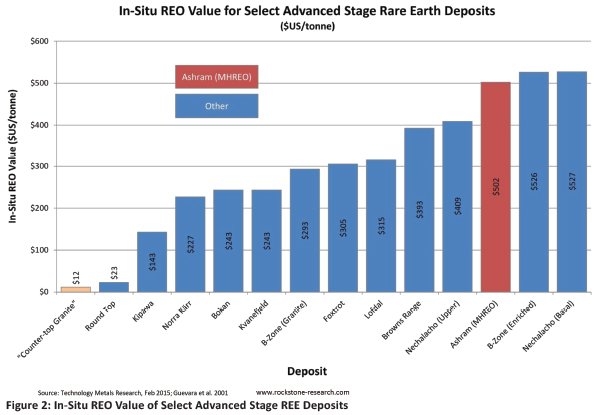 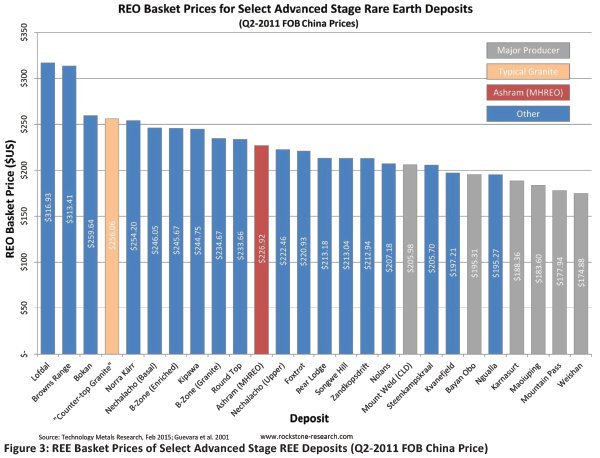 (MCRE). One may debate the merits of each; however, all are subject to the same limitations as the total REO basket price noted above. The point I am attempting to drive home, is that the REE basket price is just one tool of several at ones disposal, where none on its own may be definitive for evaluating a deposit in the proper context. If a company is promoting the REE basket price above all else without putting it into proper context, then this would suggest a very misleading discussion, and should be viewed as a large red flag of the project’s merits. There is far more to a project’s value than its REE distribution. I humbly direct readers to my April 2014 article entitled “Rare Earth Deposits: A Simple Means of Comparative Evaluation”, where 6 primary base criteria required for a proper evaluation are discussed in detail while comparing well-known development projects on a global scale: http://www.rockstone-research.de/research/RockstoneREEupdate3english.pdf A PROPER USE To quote the oftentimes flamboyant Jack Lifton, the REE Basket Price is an ‘absurd term’. This is perhaps a bit overly negative, as the term, when used in the proper context, does provide for a unique insight. As alluded to earlier, the ideal manner in which to apply the basket price is to the REE distribution over the final products produced and the associated product pricing specific to each product. The problem is, in the REE space the products vary widely (forms and specifications), the product prices vary widely, For this reason, the REE basket price used in the junior space, is, and forever will be, an approximation of the actual basket price applied to the final products. It is essential that this concept is understood or the basket price will mislead you going forward and almost certainly direct you to a poor investment. Based on this understanding, I would like to apply the basket price in the manner it is fundamentally meant to be applied; that being, as an approximation of the project’s final product(s) value. To cross-compare projects, we must assume all projects will produce the same product suite. Since most REE projects have a poor knowledge of what those final projects may be until very late in their development, this is a logical and sound assumption for us to make. As noted earlier, it is quite evident from Figure 1 that a high basket price is not a requirement for production. Considering that six major global hard rock producers occupy eight of the lowest basket price spots, it is clear that something else besides a high basket price is the determining factor for economic production. That determining factor, in my humble opinion, is the “cost of production”. Simply put, low cost production is the fundamental means to a profitable production. Therefore, I suggest we use a fundamental metric that does not rely on price decks, that being operating expenditures (OPEX) to produce a kg of REO. By this I infer that the lowest OPEX projects are the ones best suited to survive the constant fluctuations that are the nature of REE prices (i.e. basket price). The OPEX may be predictable and controllable to a material extent; however, the basket price is not, and is rather at best an approximation of the final product(s) value. Therefore, the best control of an operating margin, for REEs and any commodity for that matter, is the ability to operate at a low OPEX. One needs to look no further than the gold sector and why some companies are surviving the current gold price environment better than others. Simply put, a basket price is a floating line in which the OPEX must remain under for profitability. This is really the only proper way to use the basket price metric if one were to exist, as the operating margin (i.e. profitability) is really all that matters for a producer. Figure 4 below lists select advanced stage REE deposits that have completed an economic study along with their OPEX in $/kg REO produced. The REE basket price for each deposit is also plotted using December 2014 FOB China prices, and discounted/adjusted where applicable based on the production of a mixed concentrate (30%), partial separation (20%), or full separation of the REOs (0%). Although only an approximation, it is evident that the higher operating margins are not from those deposits with the higher basket prices, but rather those that have the lower OPEX. This notion is bolstered by the six major hardrock producers that all have relatively low basket prices (see Figure 1). Figure 5 (see next page) highlights the approximated projected operating margin (REE basket price minus the OPEX). It is clear those companies that have the lowest OPEX will have the greater flexibility during prolonged depression of prices. Some companies may appear profitable today; however, as an investor, I am most interested in those projects that will be profitable in a depressed market (i.e. the current market). It is important to note that high basket price projects are typically Dy-Y deposits (left half of Figures 4 and 5), with the dominant value associated with Dy. Therefore, Dy has the largest influence on the REE basket price, and essentially the operating margins. This poses a significant risk for the project as an example of “putting all of your eggs in one basket”. Therefore, I would suggest that the most favourable project to invest in is not the project with the higher basket price but one that has a well-balanced basket price with multiple REEs providing a significant component of the revenue. Thus, no prolonged price downturn of any single REE, or several for that matter, are likely to be fatal to the economics of the asset. 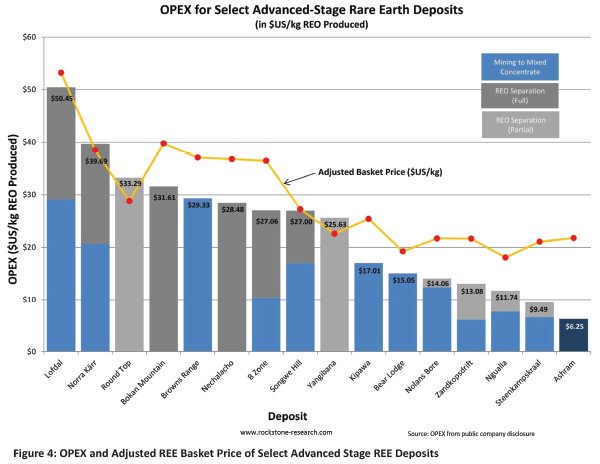 There is one project that sticks out to me, and that is the lowest cost and highest margin producer in the group, the Ashram Rare Earth Deposit. Coupled with its sizable tonnage and well-balanced distribution, the Ashram Project has the potential to produce at a low-cost and high operating margin into the next century. Bottom-line, the lower OPEX companies with good, balanced distributions will have the greatest chance of success in this complicated space. Using the current market basket price to approximate the operating margin, it is very clear that HREE enriched deposits (i.e. ones with higher basket prices) are prone to significantly higher OPEX, and significantly lower projected operating margins. A higher basket price may clearly be counterfeited by a high OPEX, negating the potential for any healthy operating margin.  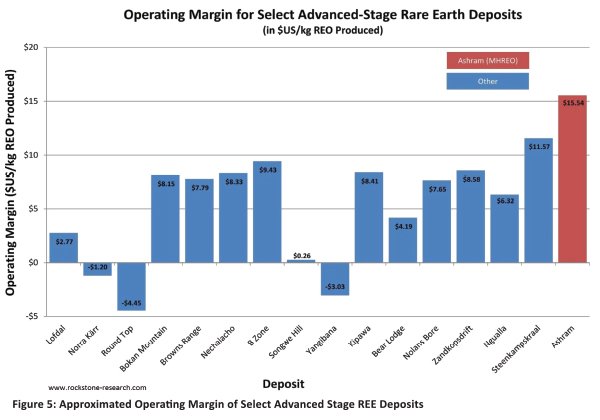 CONCLUSION The REE basket price is a poor reflection of a project’s merit and is a tool that requires input from other metrics to be relevant to any reasoned evaluation. When used on its own, the REE basket price is a misleading indicator with numerous detrimental assumptions and limitations evident. Coupled with OPEX is the best context in which to use the REE basket price, with it being best described as a constantly wavering, optimistic upper limit of revenue expressed in $ per kg of REO produced. The guise of robustness and ability by management to easily promote to the market this metric as the sole unifying indicator of value for an REE deposit is the main reason for its prevalence today in the space. However, the REE space has endured a prolonged downturn in REO prices and has matured as a result, with many of the lessor REE deposits disappearing altogether. The ones that remain will be judged with more diligence, and hence, is the reason cracks in the REE basket price metric, obvious to some since the beginning, are now becoming obvious to all. An REE project requires far more than an HREE enriched distribution and resultant high basket price with the latter two charts a clear indication of this. The basket price is a dying metric. has been my top pick from early on in the REE development space and one that I have not come to on a whim. I have read the peer economic studies, news disclosure, conversed with many in the space, and have simply taken the time to review and understand the relevant literature available. I have done my due diligence, and continue to do so as the various projects advance, some with more merit than others. There are some quality REE assets in the world under development; however, I feel the cream of the crop is the Ashram Deposit, with known mineralogy, standard low-cost and proven processing routes, favourable jurisdiction, robust preliminary economics using practical pricing assumptions, along with a seasoned and learned management team that understands the space. The Ashram Deposit can produce what the market needs at some of the lowest costs projected, if not the lowest in the space. This is market flexibility and versatility to its core, and is what any project in any space strives for. Perhaps a detailed breakdown of my top pick should be the focus of my next article on the space? 
Disclaimer and Information on Forward Looking Statements: All statements in this report, other than statements of historical fact should be considered forward-looking statements. Much of this report is comprised of statements of projection. Statements in this report that are forward looking include that rare earth element prices are expected to rebound; that Commerce Resources Corp. can and will start developing its projects into a mine; that exploration has or will discover a mineable deposit; that the Plan Nord will be executed; that someone is interested in partnering up, etc. These statements involve known and unknown risks, uncertainties and other factors that may cause actual results or events to differ materially from those anticipated in these forward-looking statements. Risks and uncertainties respecting mineral exploration companies are generally disclosed in the annual financial or other filing documents of Commerce Resources Corp. and similar companies as filed with the relevant securities commissions, and should be reviewed by any reader of this report. In addition, with respect to Commerce Resources Corp., a number of risks relate to any statement of projection or forward statements, including among other risks: the receipt of all necessary approvals; the ability to conclude a transaction to build the mine; uncertainty of future production, capital expenditures and other costs; financing and additional capital requirements for exploration, development and construction of a mine; the receipt in a timely fashion of further permitting for its projects; legislative, political, social or economic developments in the jurisdictions in which Commerce Resources Corp. carries on business; operating or technical difficulties in connection with mining or development activities; the ability to keep key employees and operations financed.There can be no assurance that such statements will prove to be accurate, as actual results and future events could differ materially from those anticipated in such statements. Accordingly, readers should not place undue reliance on forward-looking information. Rockstone and the author of this report do not undertake any obligation to update any statements made in this report.Disclosure of Interest and Advisory Cautions: Nothing in this report should be construed as a solicitation to buy or sell any securities mentioned. Rockstone, its owners and the author of this report are not registered broker-dealers or financial advisors. Before investing in any securities, you should consult with your financial advisor and a registered broker-dealer. Never make an investment based solely on what you read in an online or printed report, including Rockstone’s report, especially if the investment involves a small, thinly-traded company that isn’t well known. The author of this report is paid by Zimtu Capital Corp., a TSX Venture Exchange listed investment company. Part of the author’s responsibilities at Zimtu is to research and report on companies in which Zimtu has an investment. So while the author of this report is not paid directly by Commerce Resources Corp., the author’s employer Zimtu will benefit from appreciation of Commerce Resources Corp.’s stock price. In addition, the author owns shares of Commerce Resources Corp. and would benefit from volume and price appreciation of its stock. Thus, conflicts of interest exist. In some cases, the companies the author features have one or more common directors with Zimtu Capital Corp. Rockstone’s and the author’s views and opinions regarding the companies that are featured in the reports are teh authors own views and are based on information that was received or found in the public domain, which is assumed to be reliable. Rockstone and the author have not undertaken independent due diligence of the information received or found in the public domain. Rockstone and the author of this report do not guarantee the accuracy, completeness, or usefulness of any content of this report, nor its fitness for any particular purpose. Lastly, Rockstone and the author do not guarantee that any of the companies mentioned in the reports will perform as expected, and any comparisons that were made to other companies may not be valid or come into effect. Unless not disclosed differently, pictures used in this article are sourced from www.shutterstock.com and the public domain.
|


Bitcoin Stalls Near $60K as Strategy Moves, ETFs Outflow, and EU MiCA Rules Take Effect
Bitcoin hovers near $60,000 with ETF outflows, while Strategy boosts reserves, sells BTC, and raises dividends to reassure investors. Ethereum...


Cannabis Dominates Global Drug Use: Trends, Risks, and Shifting Markets
Cannabis remains the world’s most widely used illicit drug, with 256 million users in 2024, surpassing all others combined. Growth...


Italy Approves First Hydrogen-Powered Train for National Rail Network
ANSFISA has approved Italy’s first hydrogen-powered train, the Alstom HMU214, for use on the Brescia–Iseo–Edolo line. Capable of 140 km/h,...


Cotton Market Weakness Persists Despite Brief Rebound
Cotton prices fell to new lows last week before a modest rebound. USDA data shows crop conditions remain worse than...


Eli Lilly Hits $1 Trillion Valuation Amid Strong Bullish Momentum
Eli Lilly stock hit a record high, surpassing $1 trillion market value after strong product demand. Shares surged over 7%,...
 |
|
 |  |
 |
|
-

 Biotech7 days ago
Galicia Launches €805M Biotechnology Strategy to Drive Innovation and Competitiveness (2026–2030)
-

 Crypto2 weeks ago
Bitcoin and Ethereum Markets Steady as Strategy and Bitmine Expand Holdings Amid World Cup Crypto Activity
-

 Impact Investing5 days ago
ESG Gap Persists as Firms Struggle to Link Sustainability to Financial Value
-

 Crowdfunding2 weeks ago
Temotiva Launches Crowdfunding Campaign to Advance Preventive Mental Health