Featured
Understanding growth rates as an investment metric
Although Compound Annual Growth Rate (CAGR) is a good tool for measuring an investment’s growth, it lacks the concept of stability.

High-quality stocks are an investor’s dream because all high-quality stocks have two things in common investors are looking for:
1. Capital gains in the long run.
2. Increasing dividends (if dividends are paid).
The reason for capital gains and growing dividends the growing profit of a company. A company growing its profits becomes more valuable, and finally, the stock price goes up. Bear markets and trends may delay this fact, but finally, the stock price will go up.
In “When cheap means crap,” I showed why the notorious price-earnings-ratio isn’t helpful in finding high-quality stocks. In contrast, it is misleading, and you may lose hard-earned money if you succumb to its false promises.
The price-earnings-ratio fails because it does not respect if profits are growing or declining. But another key metric does: Welcome to the compound annual growth rate (CAGR).
The CAGR: quantifying growth rates
The idea is to quantify the change of an underlying value (e.g. profit) in a specific period of time (e.g. five years). The result is a yearly average rate of increase or decrease in percent. Simple example:
- Company’s profit in 2015: $10 million (start value)
- Company’s profit in 2018: $15 million (end value)
- Time range: three years (period)
CAGR calculation: (15/10) ^ (1/3)-1 = 14.5 percent yearly growth rate of profit.
CAGR formula: (Start value/End value) ^ (1/ Period) – 1
The CAGR in the wild
The chart below shows the earnings history of Rollins (ROL) including the CAGR for five years from 2012 to 2017. Rollins increased profits by a yearly average of 10 percent. It becomes obvious that increase is related to the company’s quality to increase its profits. In fact: Rollins looks like a high-quality stock!
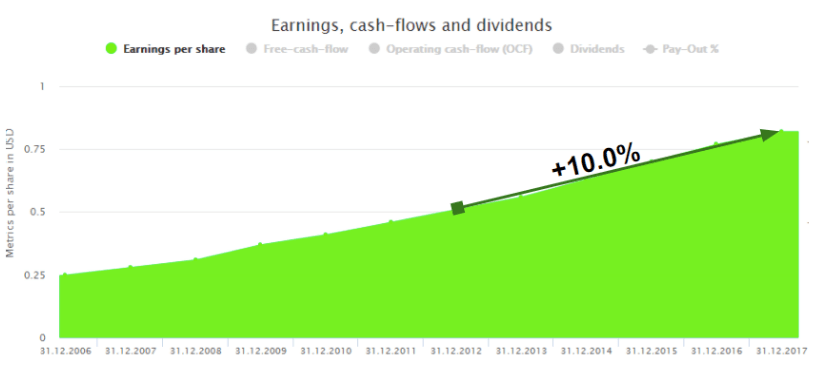
Source: DividendStocks.Cash
Is this the metric we are looking for? Before start cheering, let’s look at another stock. With 30 years of increasing dividends, Chevron (CVX) is a dividend aristocrat. But is Chevron a high-quality stock, too?
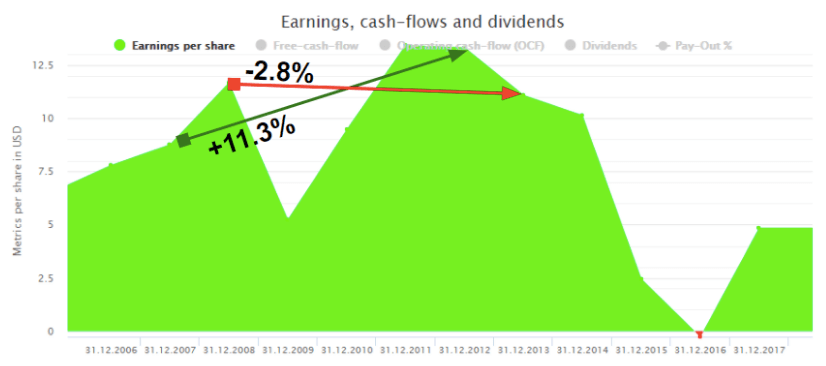
Source: DividendStocks.Cash
The CAGR for five years from 2007 to 2012 is 11.3 percent. Even higher than Rollin’s CAGR just seen. But one year later the CAGR for five years drops to -2.8 percent. What happened? In 2012, Chevron enters a period of declining profits due to a weakening oil prices. As a result, the CAGR gets worse from year to year.
The CAGR: blindness for stability
After a promising start, we found the CAGR’s weak spot. The CAGR has no clue what stable growth means. All it does is calculating the average increase between two points. What happens between these points, before and after isn’t considered at all. In the case of Chevron, rolling the CAGR to the period one year later yields a completely different result. But long-term investors need stability.
Although popular, the CAGR isn’t the solution we were hoping for. The quest for finding high-quality stocks continues.
—
DISCLAIMER: This article expresses my own ideas and opinions. Any information I have shared are from sources that I believe to be reliable and accurate. I did not receive any financial compensation in writing this post, nor do I own any shares in any company I’ve mentioned. I encourage any reader to do their own diligent research first before making any investment decisions.


Youth Cannabis Use in Colorado Is Falling — But the Full Story Is More Complex
The 2026 Colorado survey shows teen cannabis use fell to 10 percent in 2025, down from 21 percent in 2015....


Morocco’s Growth Holds at 4.6% as Agriculture Offsets Economic Pressures
Morocco’s economy grew 4.6% in Q1 2026, driven by a strong agricultural rebound offsetting declines in industry. Services expanded moderately...


Abivax Shares Surge as New Trial Data Eases Safety Concerns Over Ulcerative Colitis Drug
Abivax shares surged nearly 36% after positive updated trial results for its ulcerative colitis drug obefazimod reassured investors following earlier...


El Dorado Raises $9M to Expand Cross-Border Fintech Platform
El Dorado, a Latin American fintech improving cross-border financial services, raised a $9 million Series A led by Paradigm with...


Bitcoin Stalls Near $60K as Strategy Moves, ETFs Outflow, and EU MiCA Rules Take Effect
Bitcoin hovers near $60,000 with ETF outflows, while Strategy boosts reserves, sells BTC, and raises dividends to reassure investors. Ethereum...
 |
|
 |  |
 |
|
-

 Crypto5 days ago
Bitcoin and Ethereum Slide as Market Pressure Builds Amid Strategy Concerns and Layer 2 Disruptions
-

 Business2 weeks ago
Fed Policy Shift Raises Concerns Over Debt and Inflation Risks
-
 Crypto1 day ago
Bitcoin Stalls Near $60K as Strategy Moves, ETFs Outflow, and EU MiCA Rules Take Effect
-

 Biotech1 week ago
Galicia Launches €805M Biotechnology Strategy to Drive Innovation and Competitiveness (2026–2030)
You must be logged in to post a comment Login