Featured
Volatility ahead: Wall Street thinks a recession is coming
Could a “Black Swan event” spark a debt and stock market collapse? Wall Street thinks so.

“For last year’s words belong to last year’s language And next year’s words await another voice.”—T.S. Eliot, 1888–1965; essayist, publisher, poet, playwright, literary and social critic—one of the 20th century’s greatest poets
“Tomorrow, is the first blank page of a 365-page book. Write a good one.”—Brad Paisley, 1972—; American country musician and songwriter
“Each year’s regret are envelopes in which messages of hope are found for the new year.”—Ralph Waldo Emerson, 1803–1882; essayist, lecturer, philosopher, poet
2019 started as 2018 ended—volatile. The year had barely started when we had our first 600-point down day. That was the seventh in the past year. The 600-point down day, sparked by Apple’s earnings, was immediately followed by a 700-point-plus up day, thanks to rosy job numbers and Fed Chair Jerome Powell soft-pedaling interest rate hikes. Feeling whipsawed yet?
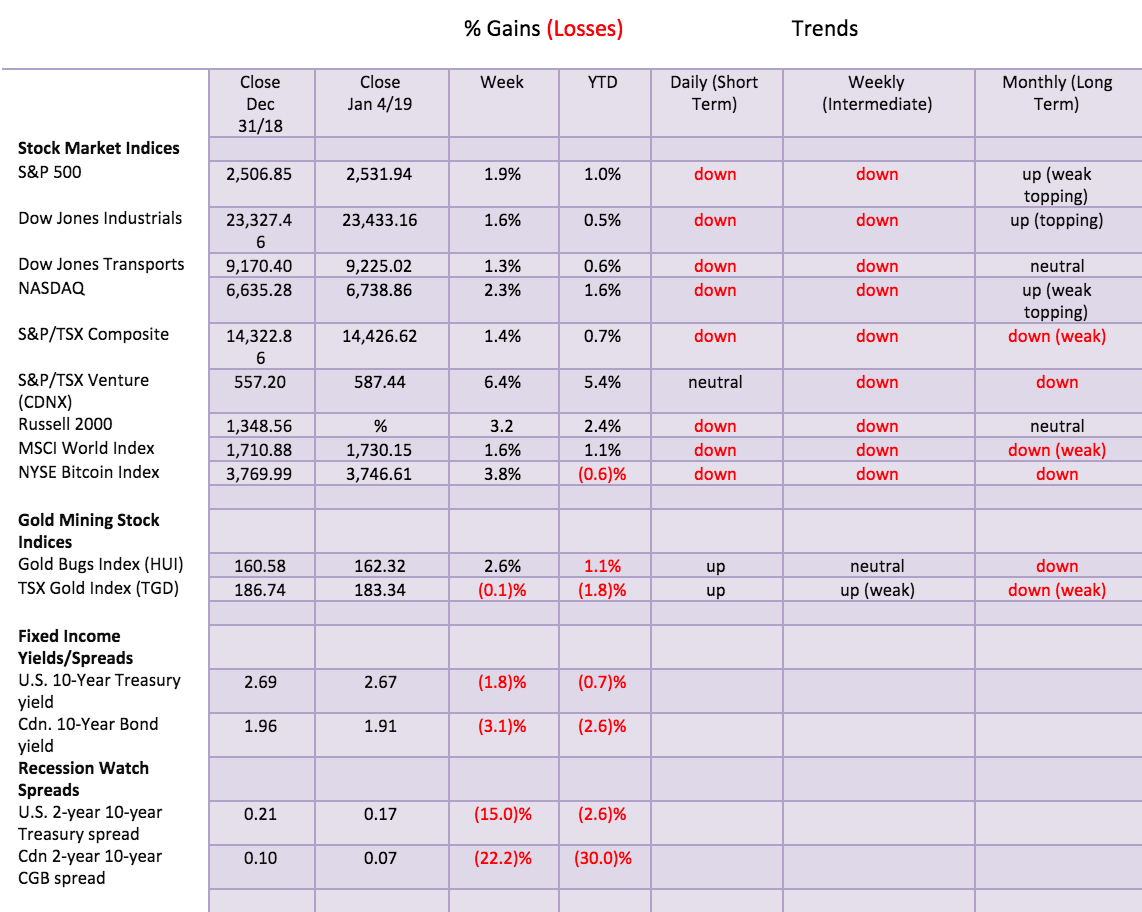
Despite the miserable December market that successfully turned what had been an up year into a down year, “Santa Claus” did come to town. The “Santa Claus” rally period, according to Jeffrey Hirsch’s Stock Traders Almanac runs the last five trading days of the year and the first two trading days in January. During that period, the Dow Jones Industrials (DJI) gained 4% while the S&P 500 was up 3.9%. Not bad when one considers the DJI ended down 5.6% in 2018 and the S&P 500 was down 6.2%. The down year came on the heels of both indices, along with other indices, making record all-time highs in 2018. A positive “Santa Claus” rally historically suggests good days to come.
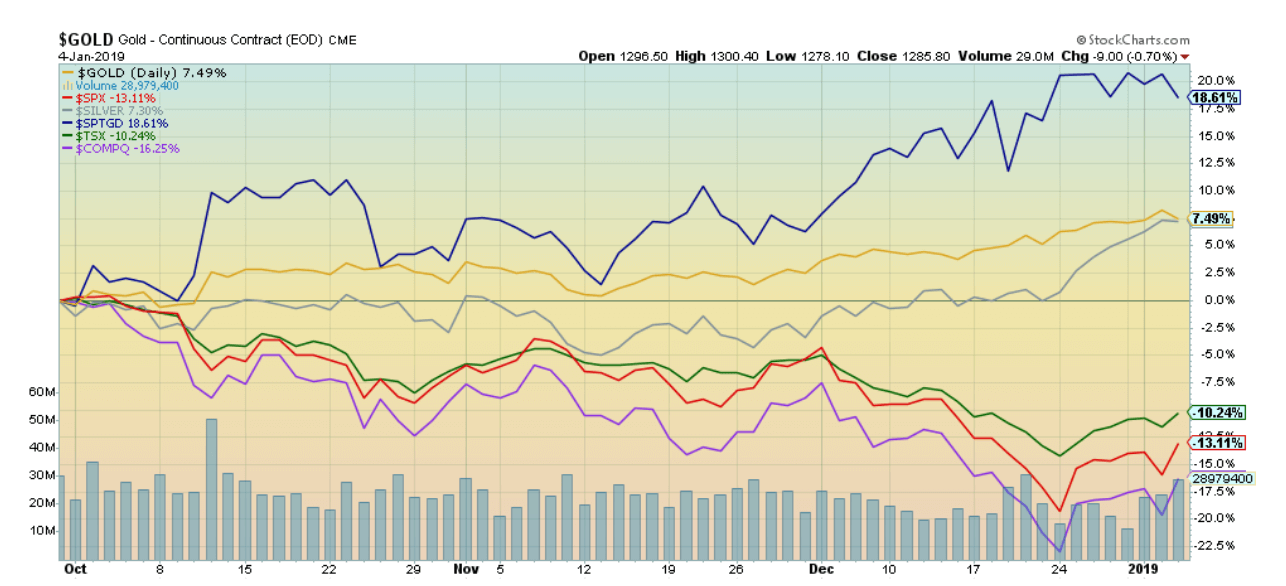
The markets topped out in September/October 2018. Since then, stock indices have fallen, at one point down roughly 20% from the high, with virtually all ending up in the red for the year. It was estimated that 85% of all stocks were down in 2018. It was the worst down year since 2008. But not everything has fallen since October. Gold, silver, and gold stocks have outperformed. Since October 1, the S&P 500 has lost 13.1%, the NASDAQ is down 16.3%. while the TSX is down 10.2%. However, gold has jumped 7.5%, silver is up 7.3%, while the TSX Gold Index is up a solid 18.6%. With chaos in governments all around, gold is proving to be the safe haven it was meant to be.
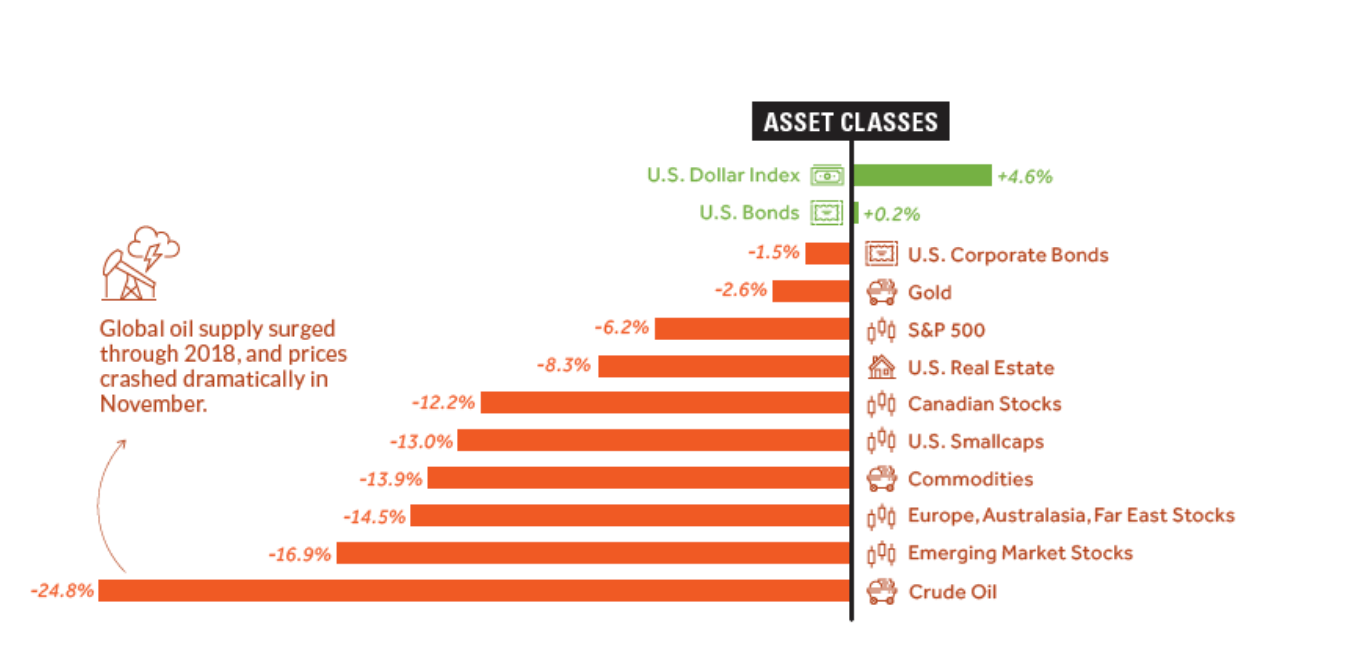
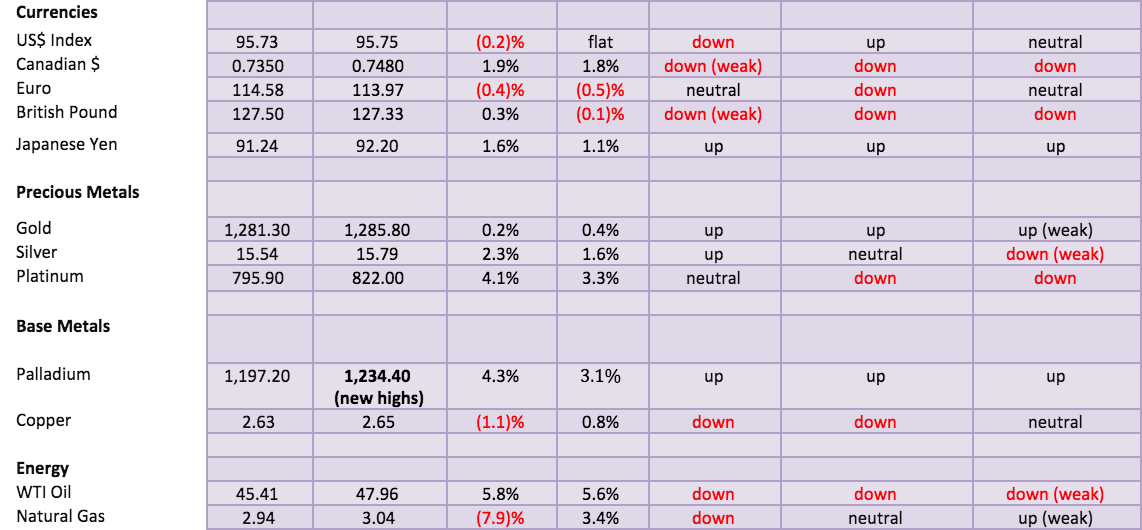
2018 was not a good year. When looking at various asset classes, they were almost universally down. The US$ Index gained 4.6% and U.S. bonds eked out a tiny gain as did Canadian bonds. But everywhere else it was red ink. One of the worst performers was oil prices that collapsed almost 25% in 2018. An even bigger loser was Bitcoin and the cryptocurrencies, with Bitcoin down about 75% in 2018 and many cryptocurrencies down 90%. The crypto-bubble became the crypto-bust. Of major global indices, China’s Shenzhen Composite led the way down with a 35.6% loss. If there was a winner it was Brazil’s Bovespa Index that saw a gain of 15%. But indices globally were almost universally down in 2018 and all North American indices were in the red with the TSX Venture Exchange (CDNX) leading the way down 34.5%. The NASDAQ was only down 3.9% in 2018, but that was before Apple on January 3, 2019.
Selected Performance from October 1, 2018 © David Chapman
How Markets Did in 2018 © David Chapman
Here in Canada, the TSX Composite fell 11.6%; however, the performance of individual sectors varied. Surprisingly, the big winner was the TSX Information Technology Index with a gain of 11.7% in 2018. The biggest loser was, unsurprisingly, the TSX Energy Index, down 28.6% in 2018. Since the energy stocks tend to dominate the TSX it was a major reason the TSX was down in 2018. Overall, however, only two TSX sub-indices were up on the year with the TSX Consumer Staples Index being the other one eking out a 0.7% gain in 2018.
So, what will 2019 bring? Given the poor performance of the stock markets in 2018, Wall Street and Bay Street are almost universally calling for a recession in 2019. It could happen. Or it could be delayed. In behind the scenes, the economy continues to do well—relatively. The positive “Santa Claus” rally was a good sign for 2019. Next up is “January’s first five days” indicator. Since 1950, the “January’s first five days” indicator has an 83.7% accuracy ratio. Three days have gone by and the DJI is up 0.4%. We’ll see where we are on Tuesday. There is also the January barometer that states as the S&P 500 goes in January so goes the year. Since 1950, there were only 9 major errors for an accuracy ratio of 86.8%. Actually, make that 10 errors. January 2018 saw the S&P 500 gain 5.6%. The S&P 500 ended the year down 6.2%. But it did make a new all-time high first.
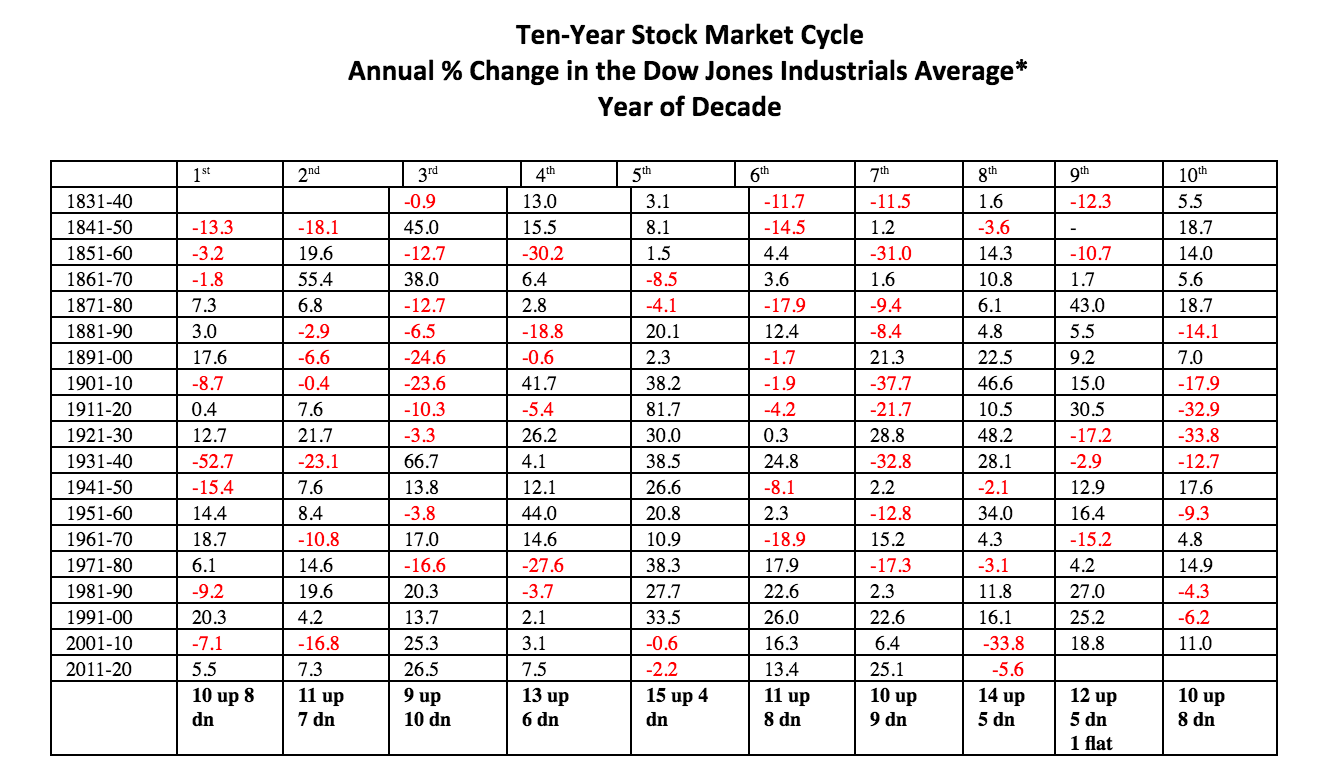
It has been some time since the markets suffered two consecutive years of losses. The last time was actually three consecutive years of losses in 2000, 2001, and 2002. That was the dot.com bust that also included 9/11. Not even the 2008 financial crash brought us two consecutive down years. However, 2008 overall saw the DJI lose 33.8%. Years ending in nine tend to be good years. Since 1831, the record is 12 up years, five down years, and one flat. The worst year was 1929 and the last down year for years ending in nine was 1969. 2019 is also the pre-election year and the record for pre-election years is 34 up years and only 12 down years. It tends to be the best year of the presidential cycle. The worst pre-election year was 1931 when the market fell 52.7%. The entire Hoover presidency was a stock market disaster as every year of his presidency was a loser.
© David Chapman
As to the Trump presidency, the first year Trump bump turned into the second year Trump slump. The wide expectation now is that 2019 could be a very rough year. Or it could fool us since the consensus has built up so much that the markets have entered a bear and a recession will soon follow. Consensus has a habit of being wrong. We could easily see a cycle low sometime in Q1 and then the markets recover. We technicians would call this the culmination of the A wave followed by a B wave to the upside that could take months to play out. So far, there is no confirmation of a low, but we are watching for one. At minimum, a near-term rebound is underway. Our 4-year cycle could easily find a low in 2019 (last cycle low was August 2015 and February 2016) followed by a recovery before the markets turn down once again into the 6.5-year cycle low and other longer dated cycles that we have outlined in the past.
Staving off a recession won’t be easy, given the universal consensus, but Friday’s job numbers suggest there is still life in the economy. As well, there were solid wage gains. Yes, the headline unemployment rate ticked higher, but that was the result of more people looking for work. A wild card going forward is the stand-off between the President and Congress over the government shutdown and the “wall.” A continuation of the government shutdown could have a negative impact on the GDP to the tune of 0.1% a month. If the shutdown drags on and people are not getting paid that could result in a more serious drag on the economy as people can’t pay their bills, mortgages etc. Then there is the wild card of essential workers still working but not being paid. A mass walk-off or mass sick-off could cause chaos at airports and borders as they are forced to shut down.
There were other positives that affected the stock market’s huge surge on Friday. China and the U.S. are at least talking on trade, which is giving rise to them cutting a deal. A U.S. delegation is off to Beijing this coming week. Are Trump’s rants against Fed Chair Jerome Powell getting to him? Powell put out a dovish speech on Friday stating that the Fed “will be patient” in raising interest rates in 2019.
While all of this was good news, it also all could quickly turn to pixie dust. The job numbers at best are gimmicky. John Williams of Shadow Stats calls them “a reporting fraud, a canard, no more than massive prior-period revisions ‘recalculation of seasonal factors’ that shifted growth from past months into the October 2018 to December 2018 timeframe, without showing the headline downside revisions to the earlier months from which the growth was borrowed.” What does that translate as? It means that there were downward revisions made to previous nonfarm payrolls and the job growth from those reports was shifted into the latter part of the year. December is also a month when there is extra hiring for the Christmas season. Many of the jobs reported were part-time positions.
For the record, the December nonfarm payrolls surged an unexpected 312,000, well above the consensus 165,000. The headline unemployment rate ticked up to 3.9% from 3.7%, largely because more people were looking for work. The labor force participation rate jumped to 63.1% from 62.7%. That translated into some 237,000 extra people looking for work. Average hourly earnings also ticked higher, up 3.2% year over year when the market was expecting a gain of only 3%. The U6 unemployment rate held at 7.6% while the Shadow Stats unemployment also held at 21.4%. The Shadow Stats unemployment rate includes long-term displaced and discouraged workers (normally find them listed under “not in labor force”) that disappear from the labor force rolls after one year.
The China/U.S. trade talks could break down once again. With Trump, anything is possible and can change on a moment’s notice. While Jerome Powell talked dovish, that still might not stop the Fed from hiking interest rates a few more times to normalize rates, as Powell has said in the past.
Past periods of rising interest rates inevitably resulted in dislocations. Rising interest rates from 2004 to 2007 led to the credit crisis of 2008, the real estate crash, derivatives problems, the oil/commodities crash, and the biggest drop in the stock market since the Great Depression. The period was also characterized by sub-prime loans, collateralized debt securities, and more. The situation was a house of cards waiting to fall, and with rising interest rates and a slowing economy it didn’t take much to bring it all crashing down. Rising interest rates from 1987 to 1990 helped spark the S&L credit crisis and the crash of the junk bond market in the late 1980s early 1990s. Rising interest rates preceded the dot.com crash of 2000–2002. But that crash was also helped by the huge volume of IPOs issued, particularly in 1999, for companies that had no earnings (and no hope of ever achieving them). Once everybody figured out that it was all a shell game the market crashed. That period also saw the deregulation of the energy industry that led to considerable abuses again with risky instruments. The result was the Enron collapse.
It is telling that today we don’t have any these or at least not on the same scale. There has been no huge IPO rush to questionable companies, nor sketchy financial securities being pedaled to funds and the unsuspecting public to the extent that was seen in 2007. Exceptions are with student and auto loans. What there is, however, is massive debt. Globally, some $250 trillion and counting. Up over $100 trillion since 2008. A downturn could become ugly, even uglier than in previous declines because of the sheer volume of debt: student loans, auto loans, corporate loans, real estate mortgages, government debt, and more. It would not take much to turn marginal investment quality debt into junk bonds thus triggering liquidation of those bonds from funds that are not allowed to carry below investment quality debt.
A housing crash is possible in Britain if Brexit fails (which it appears poised to do) and in China, as tens of thousands of apartment buildings built during the boom years sit empty and real estate companies are increasingly delinquent putting pressure on the shadow banking system. The woes of Italian banks and other EU banks is well-known. Everybody is worried about Deutsche Bank. Even the housing market in Canada and the U.S. could be in jeopardy where, once again, excessive increases in prices have created the potential for an accident waiting to happen, given rising interest rates and tightening credit conditions.
They always say that “this time it is different.” The only thing that it is different is the massive level of global debt and what might trigger a collapse. History is littered with “Black Swan events” (defined as an occurrence that is impossible to predict, unexpected, and unknowable). What happens when there is another Lehman Brothers moment, or a 9/11? One might even argue that Trump’s announcement back in February that he was imposing tariffs on steel and aluminum was a “Black Swan event.” That one was mild. The stock markets only fell 12%. Apple’s announcement that its iPhone and tablet sales could take a hit with China slowing down could also be considered a minor “Black Swan event”. The DJI swooned 600 points.
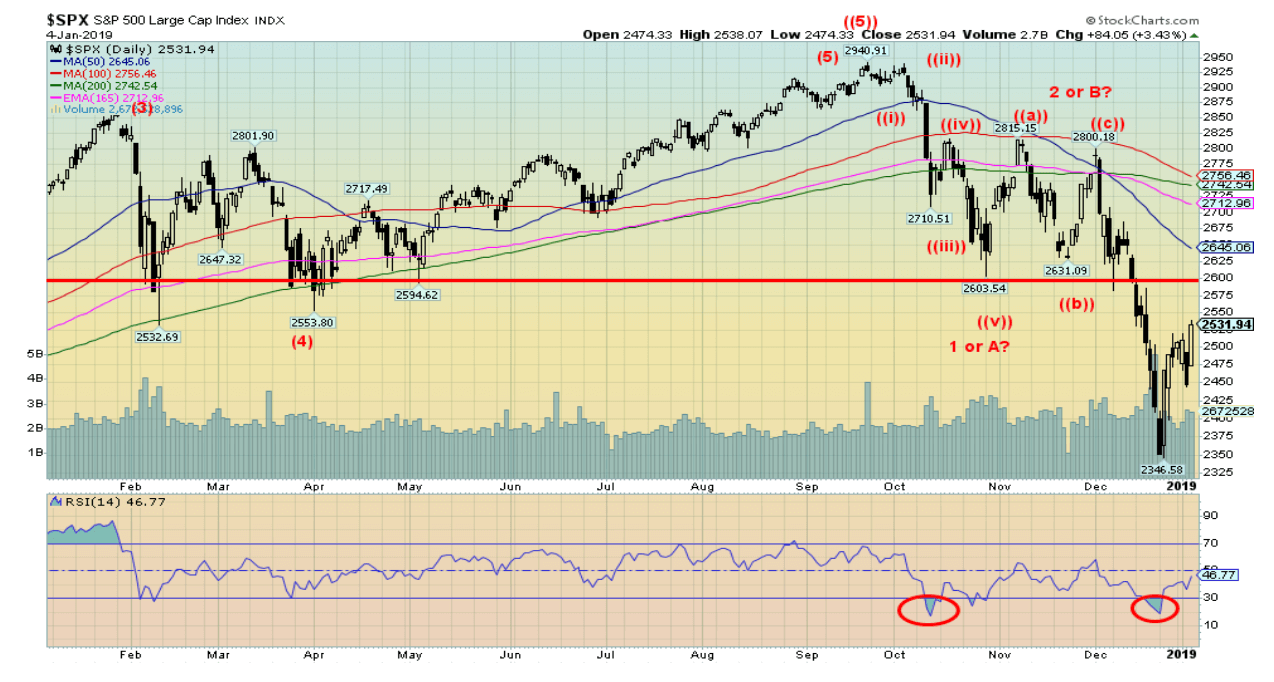
The recent collapse that got underway in October has seen the major North American stock indices break their uptrend line from the March 2009 low and the February 2016 low. As well, the breakdown cracked under the February 2018 fourth-wave low. This sent the signal to us that a new bear market is underway, following what appears to be the longest bull market in history. It was inevitable that it was going to happen. As we have previously stated, we believe this bear could last two to three years and eventually shave 50% or more off the markets.
But it won’t be a straight down affair. There will be numerous hooks where it appears that a new bull might be getting underway. This may be one of them. Our chart of the S&P 500 below shows what appears to be a five-wave decline from the October 2018 top. That wave only took us down near the February/April lows. Following what appears to be an ABC-type flat correction, the market has broken down once again, only this time it plunged through the February low. This is a significant breakdown and signals to us that we have entered a potentially more dangerous decline.
The market commenced a rebound on Boxing Day. The bulls will believe it is the start of a new up leg. The bears will believe it is merely a rebound following a sharp decline into oversold conditions. Note the RSI under 30 at the recent lows. Some indicators such as the NYSE advance/decline line and the VIX Volatility indicator did not confirm the breakdown to new lows. The bulls believe this is a sign that this could signal the start of a new up leg. However, the S&P 500 needs to first recoup the breakdown line at 2,600, and then it has to break firmly above the falling MAs. The Highest MA resistance is currently near 2,750. Above 2,800 would suggest a test of the October high of 2,940.
© David Chapman
However, if this is truly a three or C-wave down, those waves usually decline in five. While there does appear to be a small five-wave decline that would likely show up better on intraday charts, there is no discernible five-wave decline yet. The current rebound may only be a two-wave. Volume has not picked up discernibly. Resistance remains above. Despite the soothing words of Jerome Powell and the strong job numbers, the market has a way to climb back to suggest that the current decline is over.
A 700-point up day does not a new bull market make. A 600-point plunge followed by an immediate 700-point rebound should instead be a cause of concern because of the extreme volatility. It is not the sign of a healthy market that should be celebrated. Yet there were high fives all around on Friday with the 700-point up day. There are simply too many lurking dangers and, of course, there is $250 trillion of debt, an accident waiting to happen.
© David Chapman
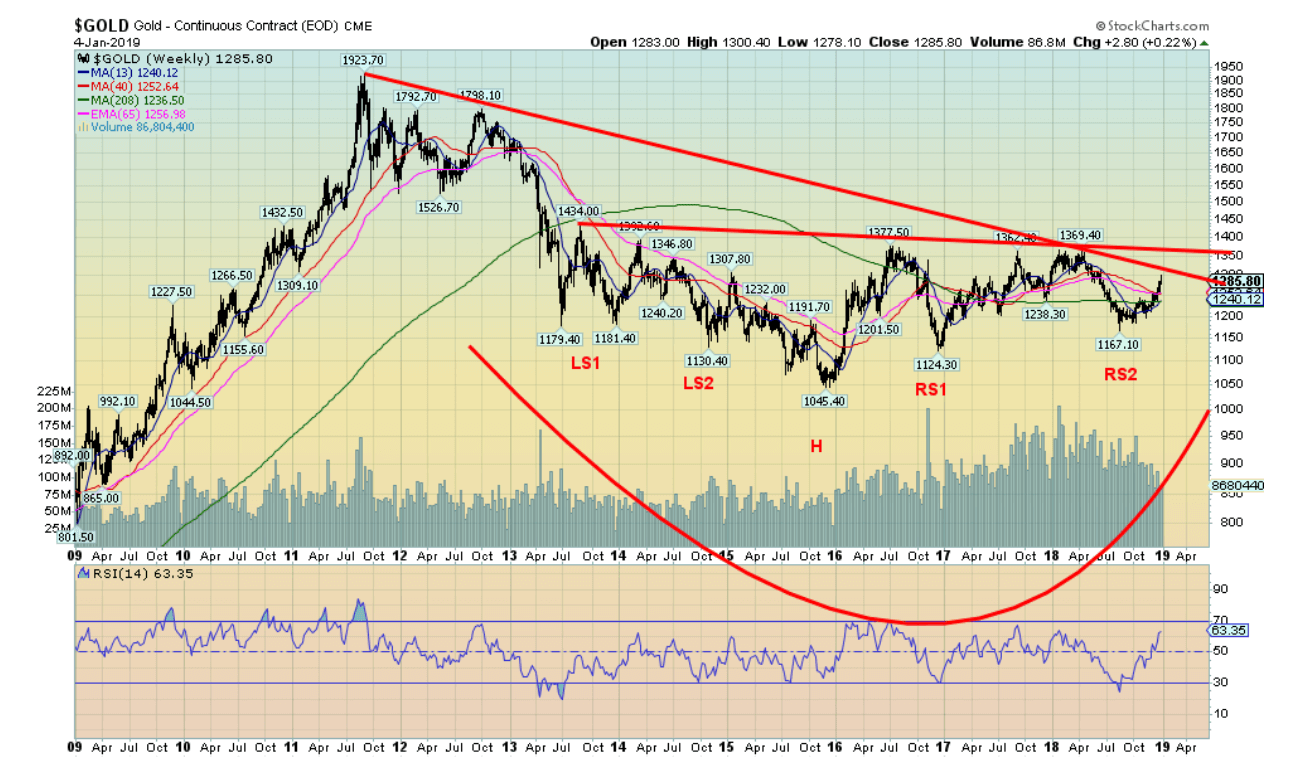
Gold, on the other hand, has started to rise phoenix-like after a long hibernation that is now entering its eighth year. However, there is still considerable work to be done. A break above $1,320 would be the next positive sign. That would appear to break the downtrend line from the September 2011 top. Gold has already broken above its 13- and 40-week MA and its 4-year MA. That’s good to see, but it broke above those MAs back in 2016, 2017, and 2018 only to fail and then fall back. Major resistance developed at around $1,370. That level—plus what appears to be a resistance line from the 2013 rebound high that comes in currently around $1,350—are the next major hurdles. A breakout above those levels, combined with a strong close above $1,400, could project gold up to $1,740, based on what appears as a multi-year complex head and shoulders bottom. As a minimum, the pattern projects to at least $1,500.
Our expectation is any initial approach to $1,350 could fail and gold might consolidate for a few months following that. For the record, similar type patterns on silver project up to around $24 and on the TSX Gold Index (TGD) up to around 350 or at least up to 250. Generally, they would follow or lead gold. Our preference is that silver and the gold stocks are the leaders.
We have entered a new and more dangerous period. Persistent high debt—much of it leveraged–dysfunctional governments, the rise of right-wing populism and authoritarianism, the bashing of victims (Muslims, immigrants), rising interest rates, the potential bursting of bubbles in the stock market, housing, and bonds are giving rise to the move into what are considered safe havens. Gold has traditionally acted as a safe haven during other periods of economic and political instability, such as the 1930s and the 1970s. However, nothing goes straight up or down and there will be periods where gold pulls back even sharply or the stock market rebounds again even sharply. But there is a shift going on, and we are just in the early stages. If nothing else, 2019 promises to be an interesting time.
Markets and trends
 New highs/lows refer to new 52-week highs/lows. © David Chapman
—
DISCLAIMER: David Chapman is not a registered advisory service and is not an exempt market dealer (EMD) nor a licensed financial advisor. We do not and cannot give individualised market advice. David Chapman has worked in the financial industry for over 40 years including large financial corporations, banks, and investment dealers. The information in this newsletter is intended only for informational and educational purposes. It should not be considered a solicitation of an offer or sale of any security. The reader assumes all risk when trading in securities and David Chapman advises consulting a licensed professional financial advisor before proceeding with any trade or idea presented in this newsletter. We share our ideas and opinions for informational and educational purposes only and expect the reader to perform due diligence before considering a position in any security. That includes consulting with your own licensed professional financial advisor.


Edison Accelerates Renewable Growth and ESG Impact in 2025
Edison reports strong 2025 sustainability progress, boosting renewable investments by 90% to reach 2.3 GW toward a 4 GW 2030...


New Gene Therapies Transform Rare Disease Care, but Gaps Remain
Gene therapies are transforming rare disease treatment, enabling normal lives for some patients. However, only about 6% of 7,000 rare...


Temotiva Launches Crowdfunding Campaign to Advance Preventive Mental Health
Temotiva Innovación Lab has launched a crowdfunding campaign through Santander X Explorer, marking a new phase for the University of...


Fed Policy Shift Raises Concerns Over Debt and Inflation Risks
The Federal Reserve is criticized for resuming balance sheet expansion through Treasury purchases despite expectations of tighter policy under new...


AI Adoption in Italian Retail Stalls Despite Strong Experimentation
A survey on AI in Italian large-scale retail trade shows companies are increasingly adopting artificial intelligence, but only 1.4% have...
 |
|
 |  |
 |
|
-

 Fintech5 days ago
Fintech and AI: Adoption Grows, but Profits Favor Agile Innovators
-

 Cannabis2 weeks ago
Argentina Legalizes Cannabis Seed Sales Under New Regulatory Framework
-
 Impact Investing17 minutes ago
Edison Accelerates Renewable Growth and ESG Impact in 2025
-

 Business1 week ago
SpaceX IPO Sparks Déjà Vu as Market Risks Loom and Gold Bulls Stay Hopeful
You must be logged in to post a comment Login