Markets
Fed Holds Rates Steady Amid Surprising Downturn in Inflation and Economic Indicators
It was a big week with the Fed and inflation reports. As expected, the Fed left rates unchanged, but the inflation reports surprised to the downside. As well a few other economic numbers were also weaker than expected suggesting that maybe the U.S. economy is finally slowing. The job numbers due out on July 5 could be telling. We look at the inflation numbers and some economic numbers and many are pointed down.

To cut, or not to cut: that is the question (with apologies to William Shakespeare). The Fed was faced with that dilemma this past week and the decision was not to join the ECB and the BofC in cutting rates. The Fed rate was left at 5.25%-5.50%. While Fed Chair Jerome Powell felt that the Fed’s restrictive policy is having an effect on inflation that central bankers had hoped to see “the question of whether it’s sufficiently restrictive is going to be one we know over time”.
The May CPI came in flat below the expected gain of 0.1%. Year-over-year the CPI was up 3.3% again below the expected 3.4%. Core inflation for May was up 0.2% below the expected 0.3% while y-o-y it was up 3.4% vs. the expected 3.6%. All remain above the Fed’s target rate of 2%.
Still being better than expected sparked a rally in bonds, stocks, and gold and a sell-off of the US$ Index. Then came the Fed in the PM and threw cold water on everyone signalling the potential for only one rate cut in 2024. Markets quickly pared their gains and gold (along with silver and the gold stocks) sunk the next day. Of course, it was not what the market wanted to hear.
The Fed received more good news on Thursday when the PPI came out. The May PPI actually fell 0.2% when they had expected instead a rise of 0.2%. However, the y-o-y PPI was as expected at 2.2%. The core PPI y-o-y was also as expected at 2.3% while May core PPI was flat below the expected gain of 0.3%. The weaker than expected PPI is another sign for the Fed that inflation is slowing. Will that change their mind about rate cuts? Probably not, at least not yet. Old axiom. Don’t fight the Fed but it doesn’t seem to stop many from trying.
But with rising delinquencies in the consumer mortgage market (Canada too) a commercial real estate market threatening further bankruptcies, rising bankruptcies, potential problems in both the corporate debt market and sovereign debt especially sovereign debt denominated in U.S. dollars, the risk remains that there could be a financial crisis and credit crunch.
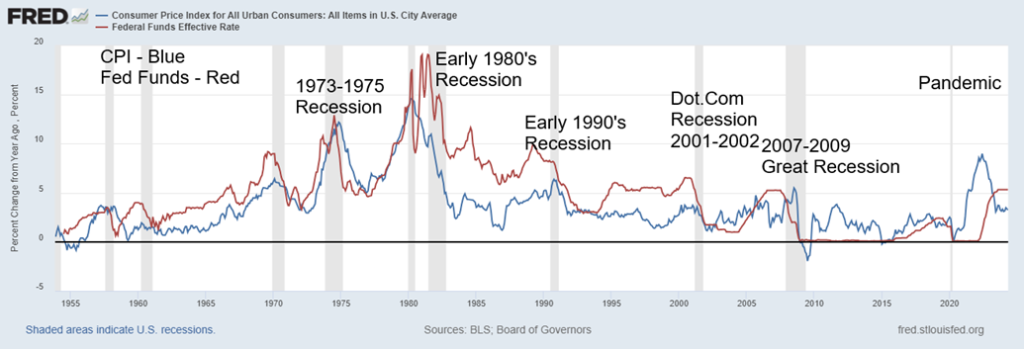
For years, especially dating from the Great Recession of 2007-2009 and the pandemic, interest rates remained below the rate of inflation. This was an unusual situation as traditionally there is a positive real rate of interest.
Instead, we had negative real interest rates. Couple in oodles of liquidity through quantitative easing (QE), it encouraged all sorts of speculation. The stock market and the housing market were the primary beneficiaries sparking asset inflation as bubbles developed given cheap borrowing costs and boatloads of money. Add in some huge tax cuts benefitting primarily the wealthy and you had the perfect conditions for asset inflation.
The losers were those dependent upon interest income, particularly retired seniors. However, more recently it has been the opposite as the Fed’s hiking of interest rates starting in March 2022 coupled with quantitative easing (QT) we now see interest rates above the rate of inflation. That in turn is causing alarm in the housing market, the commercial real estate market and more as many had become dependent on ultra-low interest rates and did not prepare for an inevitable upwards adjustment. Or worse as they thought the gravy train would go on forever.
CPI (y-o-y % change), Effective Fed Funds 1955-2024
No, it is not the only reason that helped spark inflation. Supply chain disruptions, sanctions, trade wars, currency wars, actual war (Russia/Ukraine, Israel/Hamas (and spreading)), huge budget deficits also contributed to the rise in inflation. Yes, and belatedly we are seeing a rise in wages and increased strikes adding to inflationary pressures.
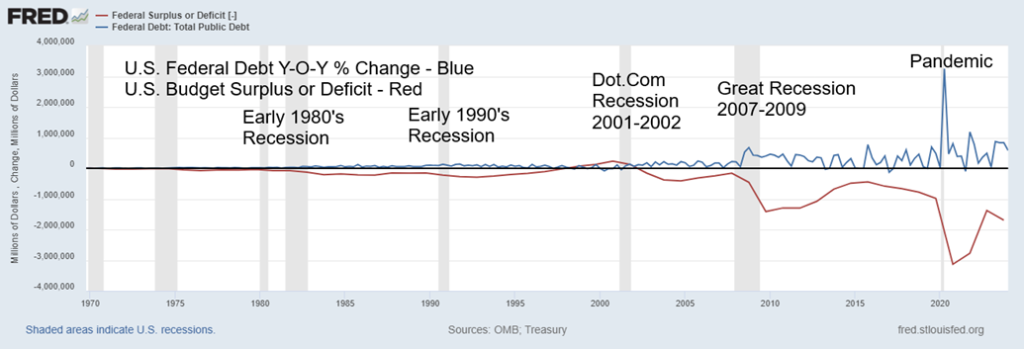
Adding to the pressure was a massive rise in the U.S. Federal debt and a sharp rise in budgetary deficits. 2020 saw the biggest budget deficit in U.S. history at $3.1 trillion while the U.S. Federal debt jumped $4.2 trillion the same year. All were sparked by the pandemic as governments responded to the sharp rise in unemployment and the move to work from home thus negatively impacting thousands of businesses. While the charts are for the U.S. the same phenomena were seen in Canada, the EU, Japan, the U.K. and more.
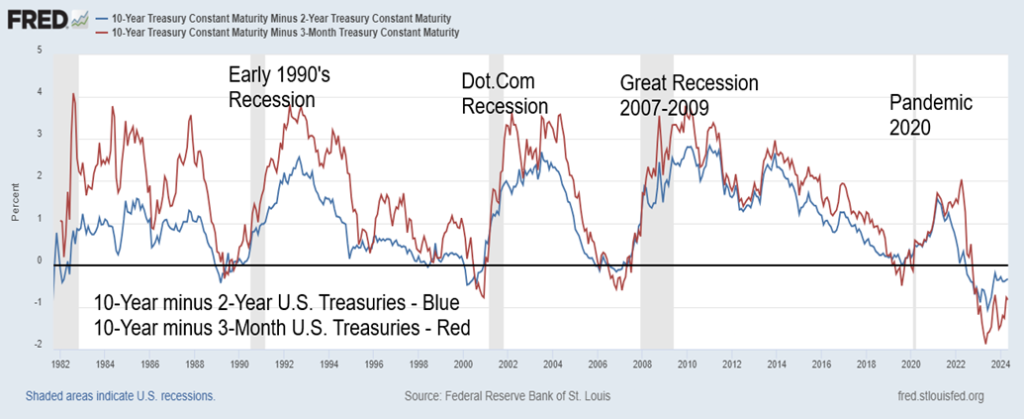
But are their signs of a slow down? The spread between the 10-year U.S. treasury note and the 2-year treasury note, along with the spread between the 10-year U.S. treasury note and the 3-month U.S. treasury bill has rarely been not only so wide but also persistently negative for the longest time we’ve ever seen. Yet the negative spreads have a 100% accuracy record in predicting a recession.
By comparison as the chart below shows the current negative spread is the largest ever and it has gone on for the longest time ever. That has had many predicting that there either won’t be recession or that it will be a soft-landing mild recession. Our thoughts continue to be the opposite as we believe it is suggesting that when the recession comes it will be steeper than many expect and last longer. An overreaction one way (larger negative spreads) often begets an overreaction in the opposite direction (steeper recession).
U.S. Federal Debt y-o-y % change, U.S. Budget Surplus or Deficit 1970-2024
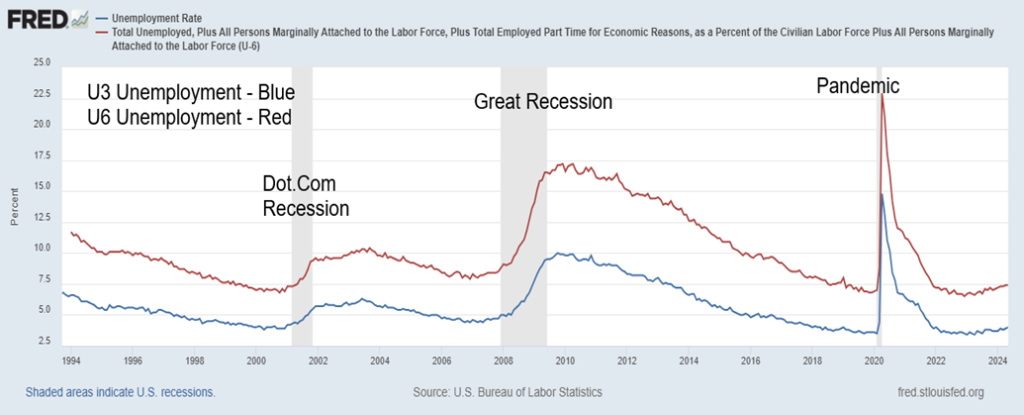
Rising unemployment is often a bell weather. But thus far unemployment (U3) is only grudgingly rising having hit 4% for the first time since 2021. Even at 4% unemployment remains historically low. U6 unemployment has also begun to rise. U6 unemployment is U3 plus all persons marginally attached to the labour force, plus total employed part time for economic reasons, as a percent of the civilian labour force plus all persons marginally attached to the labour force.
U6 is up to 7.4% the highest as well since 2021 as the unemployment rate was falling following the pandemic recession. Again, it remains historically low. Full-time jobs are falling (good paying jobs) while part-time jobs (poor paying jobs) are rising. Government jobs, leisure and hospitality jobs and health care jobs dominate the recent increase in jobs.
U.S. 10-Year Treasuries minus 2-Year Treasuries, U.S. 10-Year Treasuries minus 3-Month T-Bills 1980-2024
U3 Unemployment, U6 Unemployment 1994-2024
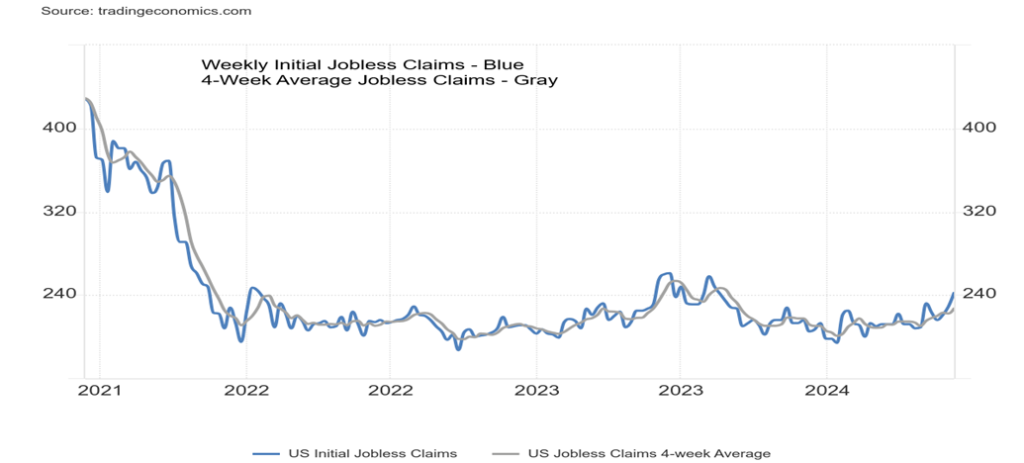
Weekly Jobless Claims, 4-Week Average Jobless Claims 2021-2024
U.S. Leading Economic Index, Business Confidence, Industrial Production 2019-2024
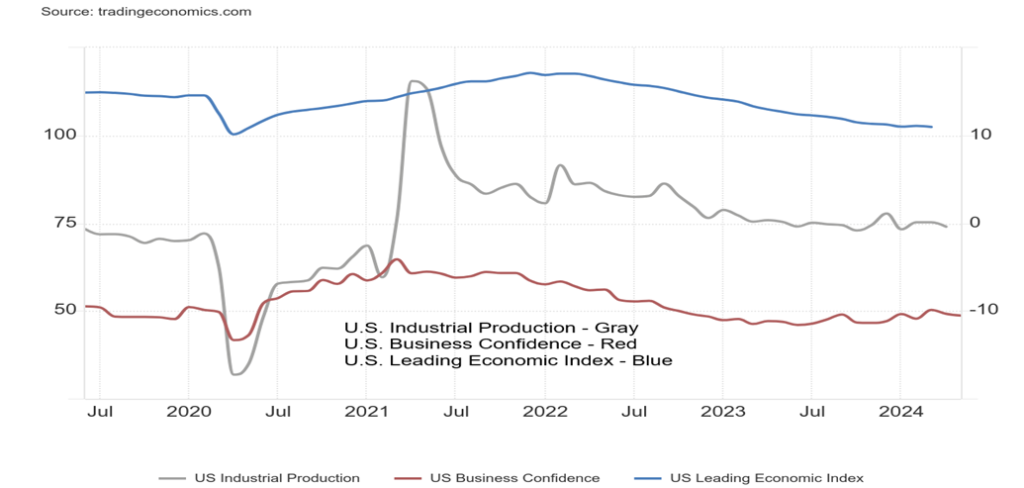
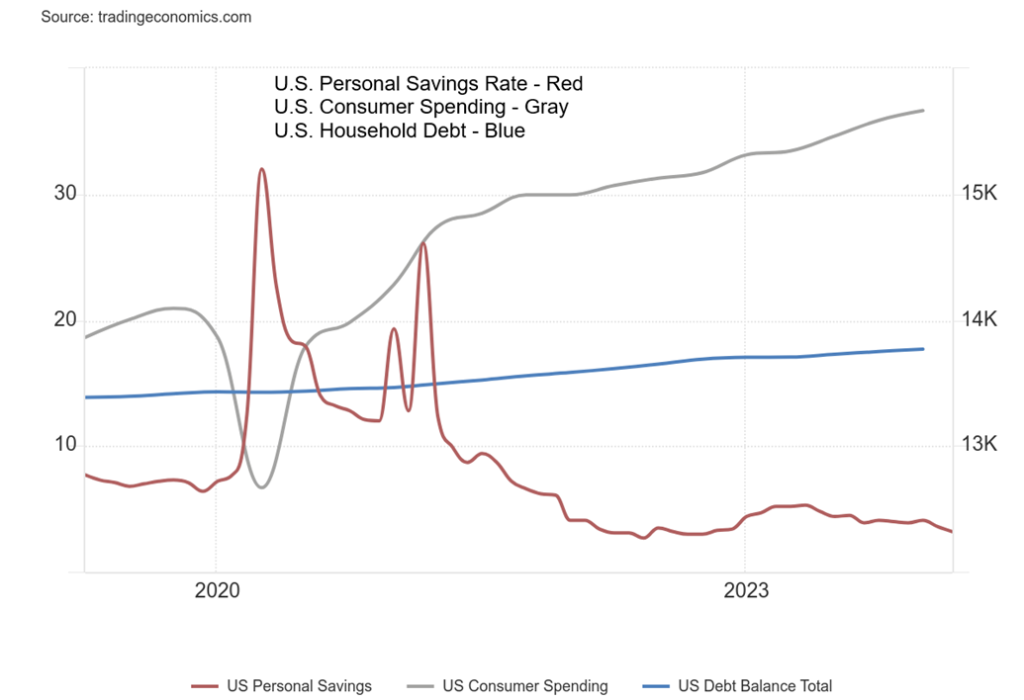
Maybe its no surprise then that we are seeing a slowing as demonstrated above with industrial production, business confidence and the leading economic index all declining. None have turned particularly negative but the direction is down. Consumer spending has been rising even as personal savings are falling and household debt is rising. None of this bodes well going forward if we were to fall into a recession.
U.S. Personal Savings Rate, Consumer Spending, Household Debt 2019-2024
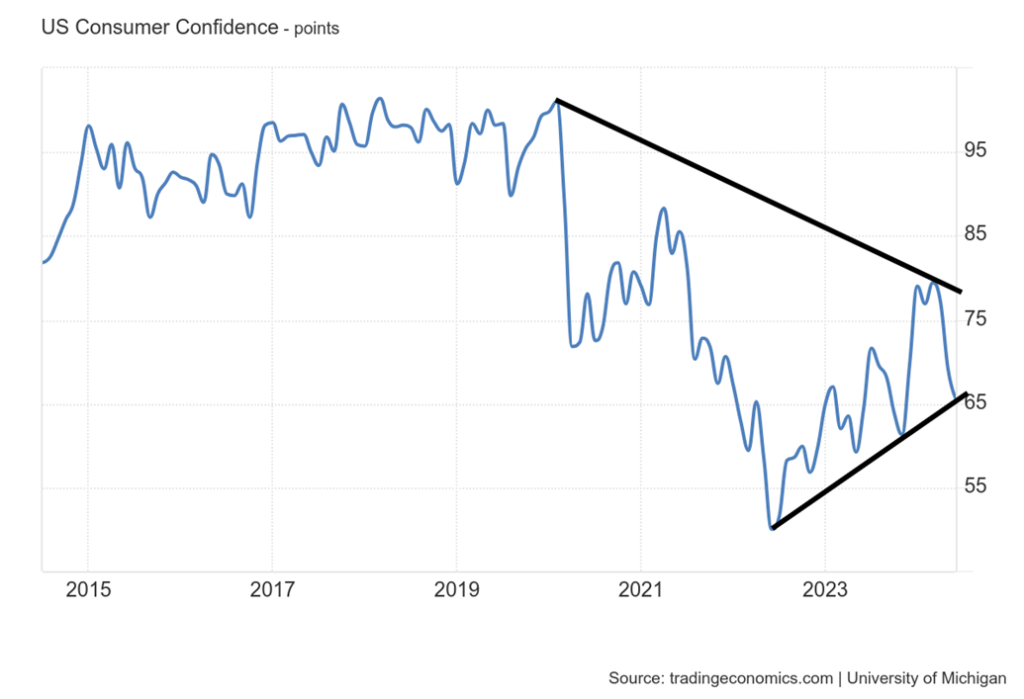
Lastly consumer confidence is sliding. The most recent University of Michigan Consumer Confidence Index came in at 65.6 the third consecutive monthly decline. Not only was it down it was below consensus of 72 and below May’s 69.1. The current conditions gauge was also down as was consumer expectations. The expectation from consumers is that inflation will continue. Not only it was it a seven-month low it was the lowest since November 2023.
What it is forecasting is that consumers are losing confidence in the economy and see themselves as worse off. The lofty days pre-pandemic seems but a distant memory. A downtrend is in place and the index appears poised to breakdown further. Concerns are over deteriorating finances, high prices and weakening incomes. Strikes, as we noted, have increased as workers attempt to catch up.
U.S. Consumer Confidence University of Michigan 2014-2024
The Fed hinted at only one rate cut in 2024. But could weakening economic conditions spur more than one rate cut. One rate cut could mean either September or December. The Fed is data driven so don’t expect knee jerk reactions from them. Add in all of the other issues of ongoing wars that are showing signs of deteriorating further despite lofty expectations of cease fires and potentially the most divisive election in U.S. history since the U.S. Civil War a century and half earlier. Divisions are also steepening in Canada and the EU countries.
There has been a distinct shift to the hard right in the EU based on the recent EU elections. With deep divisions civil strife is rising. Witness Argentina where a shift to the hard right has impoverished thousands and now there are nightly clashes on the streets between protestors and heavily armed police. One could say no wonder consumer confidence is falling.
We hold to our thoughts that it will eventually be a hard landing and ultimately that plays out in the stock market as confidence falls.
Chart of the Week
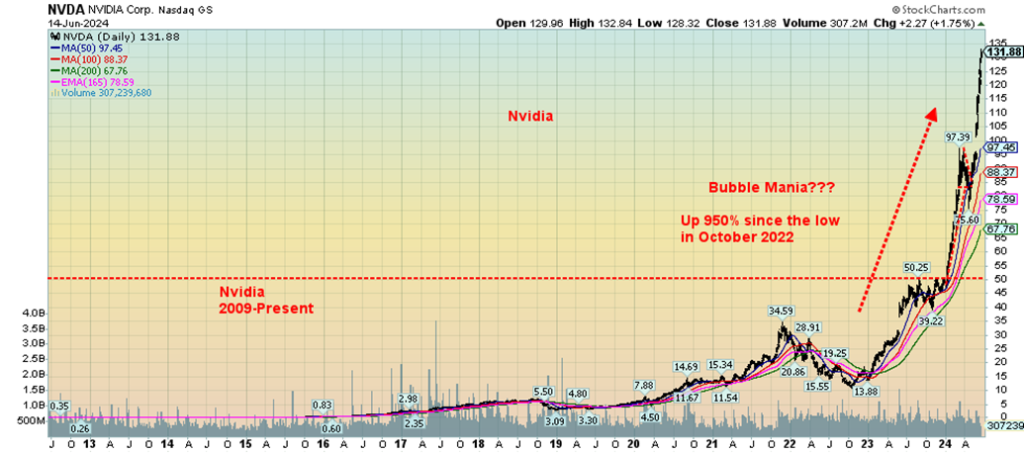
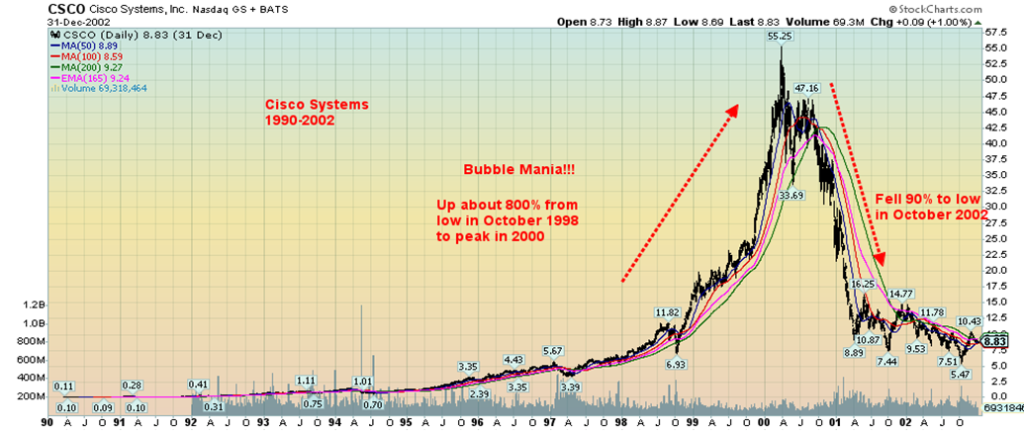
We may have shown this before. But it’s worth repeating. We can’t describe Nvidia in anything else but a bubble. All bubbles eventually end and when they do it is usually a devastating crash. We show Cisco Systems below as a comparison. Cisco was a part of the late 1990’s dot.com bubble. Nortel might have been a perfect poster child but it’s no longer around. Cisco, like Nvidia today supplying chips, supplied routers for the internet. Cisco is still around. Its still down almost 20% from that 2000 high. Yes, Cisco did take out the 2000 high, just, in 2021 a period of 21 years to get back to break even.
This should act as a warning for Nvidia. Nvidia has been the poster child for the AI revolution. NVDA’s profits soared in the early going but those are now waning. This company took 25 years to reach $1 trillion market cap, another 9 months to hit $2 trillion and a mere 3 months to hit $3 trillion. Do we hear $4 trillion? But Nvidia now faces competition as others ramp up chip production including Intel, Qualcomm and Apple. Cisco fell when everybody got into the router game and then there was a glut. Nvidia is now challenging Apple as the world’s second largest corporation by market cap just behind Microsoft.
We don’t know when the fall will come but we do know it is bound to happen. Former Fed Chairman Alan Greenspan made his famous “irrational exuberance” speech in 1996. Yet it took until 2000 before the market actually topped at levels, we’re sure that even had Greenspan blanch. Nvidia is not tulips. But it is sure acting like it is.
Markets & Trends
| % Gains (Losses) Trends | ||||||||
| Close Dec 31/23 | Close Jun 14, 2024 | Week | YTD | Daily (Short Term) | Weekly (Intermediate) | Monthly (Long Term) | ||
| Stock Market Indices | ||||||||
| S&P 500 | 4,769.83 | 5,431.60 (new highs)* | 1.6% | 13.9% | up | up | up | |
| Dow Jones Industrials | 37,689.54 | 38,589.16 | (0.5)% | 2.4% | down (weak) | up | up | |
| Dow Jones Transport | 15,898.85 | 14,807.47 | (1.4)% | (6.9)% | down | down | neutral | |
| NASDAQ | 15,011.35 | 17,688.88 (new highs)* | 3.2% | 17.8% | up | up | up | |
| S&P/TSX Composite | 20,958.54 | 21,639.10 | (1.7)% | 3.3% | down | up | up | |
| S&P/TSX Venture (CDNX) | 552.90 | 574.09 | (2.4)% | 3.8% | down | up | down | |
| S&P 600 (small) | 1,318.26 | 1,272.44 | (1.9)% | (3.5)% | down | up (weak) | up | |
| MSCI World | 2,260.96 | 2,343.72 | (2.2)% | 3.7% | neutral | up | up | |
| Bitcoin | 41,987.29 | 65,741.24 | (4.8)% | 56.6% | neutral | up | up | |
| Gold Mining Stock Indices | ||||||||
| Gold Bugs Index (HUI) | 243.31 | 262.06 | (0.4)% | 7.7% | down | up | up | |
| TSX Gold Index (TGD) | 284.56 | 308.78 | (0.9)% | 8.5% | down | up | up | |
| % | ||||||||
| U.S. 10-Year Treasury Bond yield | 3.87% | 4.23% | (4.7)% | 9.3% | ||||
| Cdn. 10-Year Bond CGB yield | 3.11% | 3.31% | (4.2)% | 6.4% | ||||
| Recession Watch Spreads | ||||||||
| U.S. 2-year 10-year Treasury spread | (0.38)% | (0.49)% | (6.5)% | (29.0)% | ||||
| Cdn 2-year 10-year CGB spread | (0.78)% | (0.59)% | (9.3)% | 54.4% | ||||
| Currencies | ||||||||
| US$ Index | 101.03 | 105.52 | 0.6% | 4.4% | up | up | up | |
| Canadian $ | 75.60 | 72.94 | 0.2% | (3.5)% | down | down | down | |
| Euro | 110.36 | 107.06 | (0.9)% | (3.0)% | up | down (weak) | down (weak) | |
| Swiss Franc | 118.84 | 111.89 | (0.5)% | (5.9)% | up | neutral | neutral | |
| British Pound | 127.31 | 126.85 | (0.3)% | (0.4)% | up (weak) | up | neutral | |
| Japanese Yen | 70.91 | 63.54 | (0.4)% | (10.4)% | down | down | down | |
| Precious Metals | ||||||||
| Gold | 2,071.80 | 2,349.10 | 1.0% | 13.4% | down (weak) | up | up | |
| Silver | 24.09 | 29.47 | 0.1% | 22.3% | neutral | up | up | |
| Platinum | 1,023.20 | 958.60 | (1.3)% | (6.3)% | down | up (weak) | up (weak) | |
| Base Metals | ||||||||
| Palladium | 1,140.20 | 898.50 | (2.7)% | (21.2)% | down | down | down | |
| Copper | 3.89 | 4.49 | 0.2% | 15.4% | down | up | up | |
| Energy | ||||||||
| WTI Oil | 71.70 | 78.05 | 3.3% | 8.8% | down (weak) | down (weak) | down (weak) | |
| Nat Gas | 2.56 | 2.88 | (1.4)% | 12.5% | up | up | down (weak) | |
New highs/lows refer to new 52-week highs/lows and, in some cases, all-time highs.
- * New All-Time Highs
Does it get lonely at the top? We wonder. This past week the S&P 500 and the NASDAQ both leaped to new all-time highs. The Dow indices, Industrials and Transportation were both down on the week. Naturally it was the FAANG stocks that took us to these all-time highs as six of them also made new all-time highs. Too bad the rest of the market didn’t seem to get the message. Yes, there were a few other indices that made all-time highs but they were related and again were dominated by the FAANGs.
Making new all-time highs was the NASDAQ 100, the NY FANG Index, the S&P 100 (OEX), the Russell 1000, the Russell 3000, the Semiconductor Index (SOX), and the Wilshire 5000. Some like the Dow Jones Transportations (DJT) are now in a downtrend while others are clearly rolling over. This is, we believe a significant divergence and the overvalued FAANG stocks are due for a fall. A chart below shows that the FAANG stocks (technology) stocks now make up as much of the S&P 500 as the technology stocks (dot.com) did at the 2000 peak. A warning?
On the week the S&P 500 gained 1.6%, the Dow Jones Industrials (DJI) fell 0.5%, the DJT was down 1.4% while the NASDAQ was up 3.2%. Significantly the S&P 500 Equal Weight Index (SPXEW) actually fell 0.6% telling us that it is strictly those FAANG stocks holding the market up while everyone else was weak or down. New Highs vs New Lows is actually falling and the breadth indicators are below the highs that were seen in 2021 prior to the 2022 20% + drop.
The percentage of stocks above their 50-day MA is actually only at 45% well below a very bullish 90% usually seen at highs. That’s a negative sign. The Advance/Decline line is falling not rising with the S&P 500. The McClellan Oscillator is negative 50. The McClellan Summation Index is at 300 and falling. The NASDAQ AD line is also falling not rising with the index. The NYSE Bullish Percent Index (BPNYA) is also falling as are similar ones for the S&P 500 and NASDAQ. We could go on but the reality is the indicators are telling us that this market is in trouble and that new all-time highs is a false signal.
Elsewhere the S&P 400 (Mid) was down 0.9% and the S&P 600 (Small) was down 1.9%. In Canada the TSX fell 1.7% and the TSX Venture Exchange (CDNX) lost 2.4%. Even Bitcoin fell 4.8%. In the EU the London FTSE lost 1.2%, the EuroNext dropped 4.2%, the Paris CAC 40 fell 6.2% while the German DAX dropped 3.0%. The EU is increasingly becoming nervous about the Russia/Ukraine war with NATO F16’s parked in Romania and Poland for Ukraine’s use; French troops are possibly going to Ukraine allegedly to train and the west is tapping into seized Russian assets to fund Ukraine. No, Ukraine doesn’t get the assets, but instead it’s the earnings from those assets. All designed supposedly to avoid breeching international laws about seizing other people’s funds.
In Asia China’s Shanghai Index (SSEC) was off 0.6%, the Tokyo Nikkei Dow (TKN) was up 0.3% while Hong Kong’s Hang Seng (HSI) was down 1.8%. The MSCI World Index fell 2.2%. Seems everywhere stock indices were falling except the FAANGs kept the S&P 500 and the NASDAQ alive. That won’t last. We suppose then we could take solace that gold despite its recent weakness actually rose this past week up 1.0%.
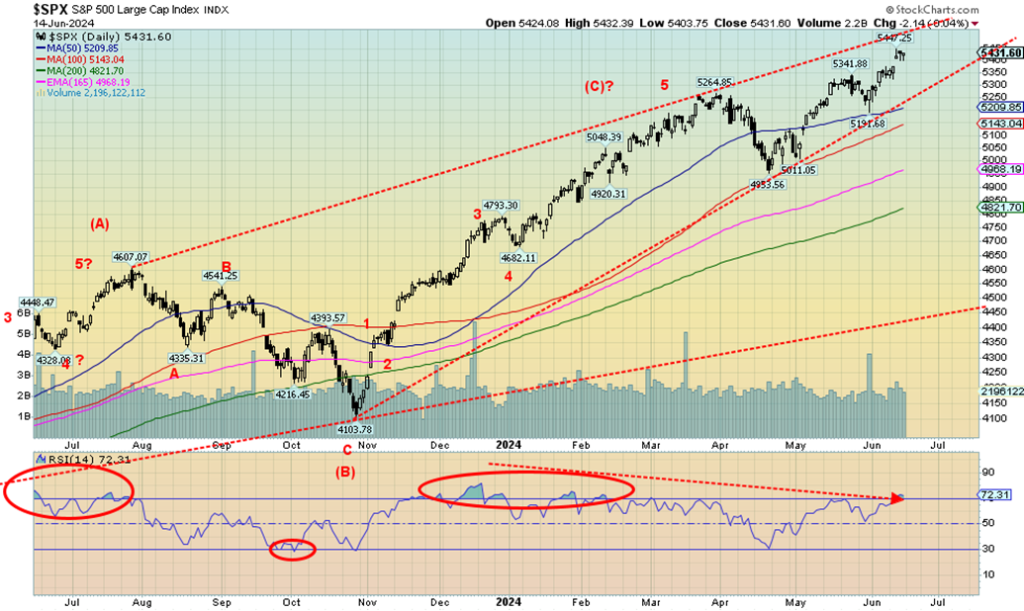
The breakdown gets underway under 5,200. Under 4,900 its all over and a more serious correction gets underway. There are just too many negatives out there with all the geopolitical divisiveness, domestic political divisiveness, unsustainable debt, negative impacts from climate change and more. No wonder we have noted that our safety feature is to own gold bullion (and silver bullion) to protect against currency devaluation and political difficulties including the upcoming U.S. election which potentially promises to be the most divisive since the U.S. Civil War 150 years ago.
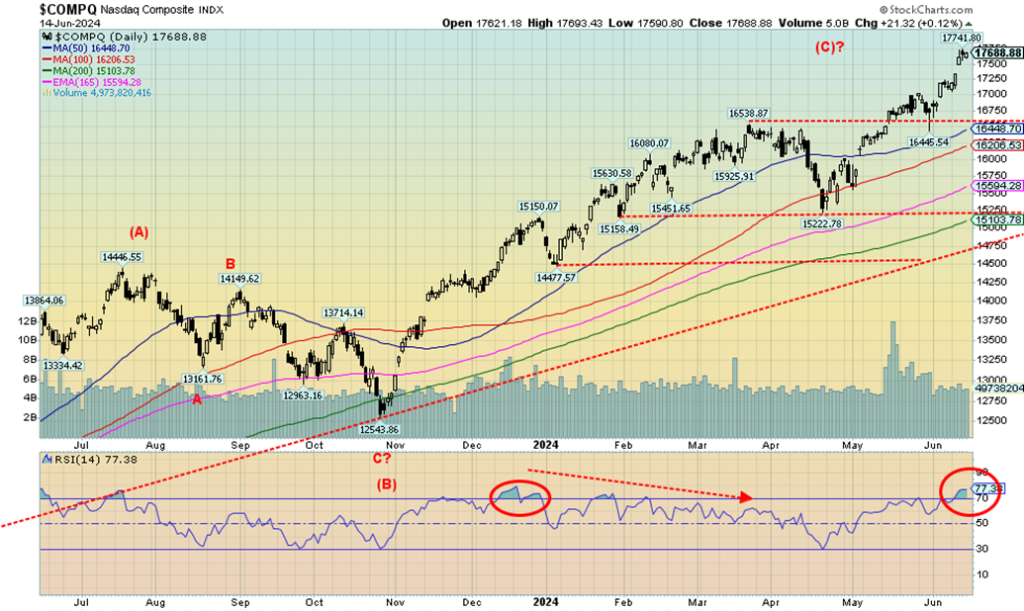
Seems there is nothing stopping the FAANGs. The NASDAQ gapped up on Wednesday and so far, hasn’t stopped. Too bad other indices didn’t get the message. The NY FANG Index also gapped higher. A runaway gap (or measuring gap as it also called) or a potential island gap? We won’t know it’s the latter until it gaps down. But if the former this market still has a way to go before topping. New all-time highs were seen in a number of FAANG stocks.
The leader was one not noted much, Broadcom up 23.4% on the week. Nvidia, the newest $3 trillion company, gained 9.1%. Other winners making new all-time highs were Apple +7.9%, Netflix +4.4%, Google +1.4% and Microsoft +4.4%. Were there any losers? The Chinese stocks Baidu and Alibaba fell 4.1% and 6.5% respectively. Snowflake lost 3.1% and AMD fell 4.9%. But eyes were on the NASDAQ up 3.2% on the week. Is there anything stopping this train?
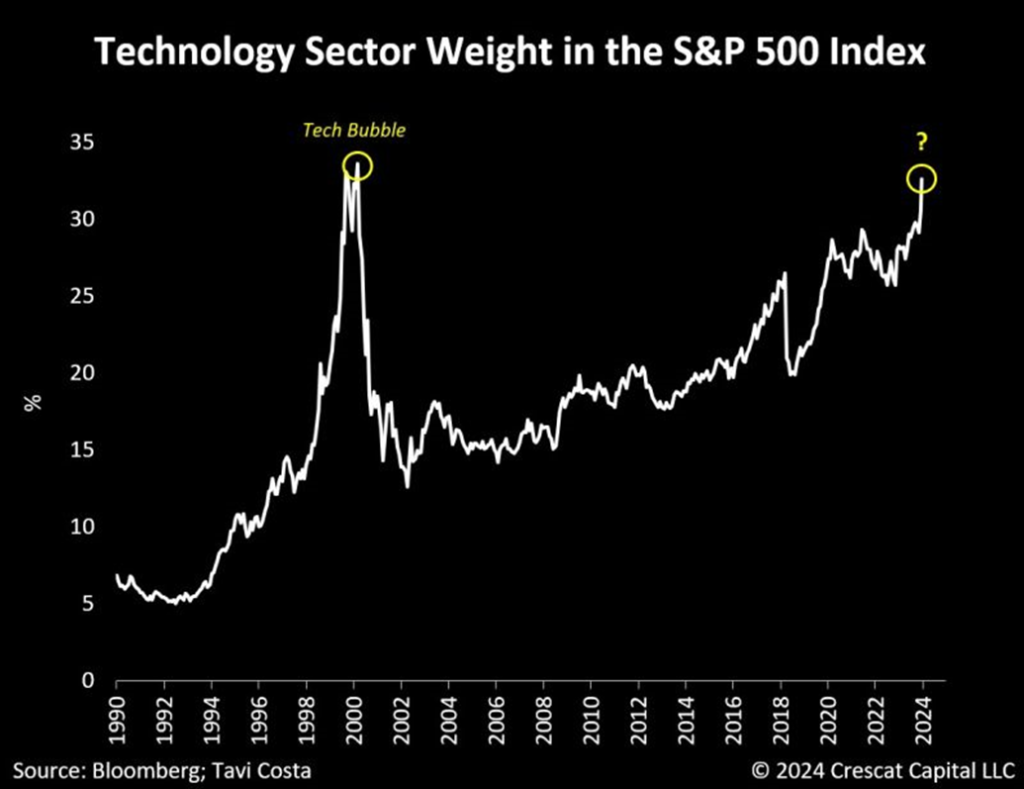
Things that make you go Hmmmm!! At the peak of the dot.com tech bubble of 2000 the tech sector made up 34% of the S&P 500. Today the tech sector makes up 33% of the S&P 500. Does history repeat? Or just rhyme?
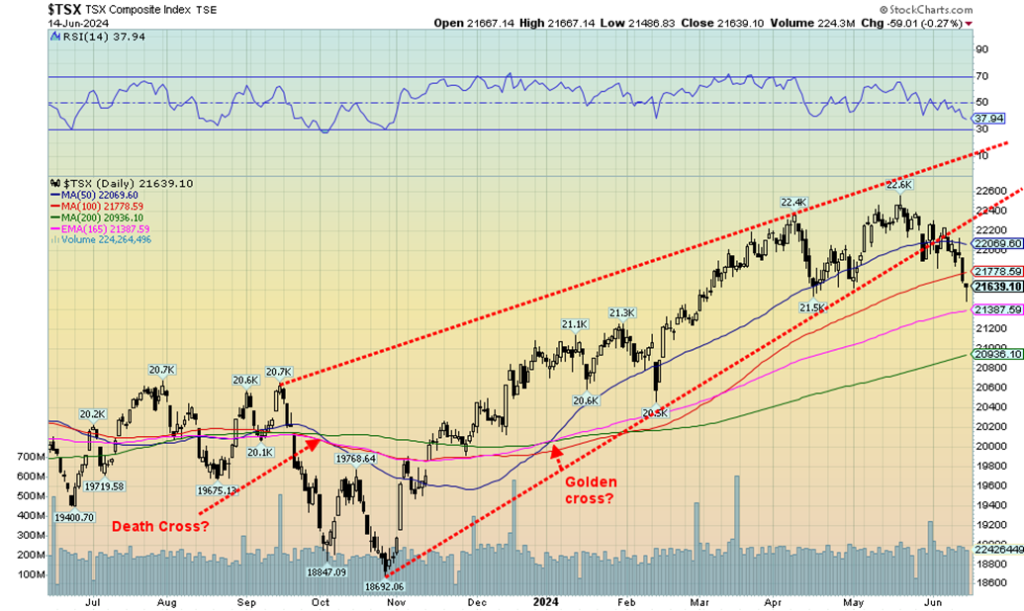
The TSX Composite fell again this past week losing 1.7% suggesting that a downtrend may now be underway. The TSX Venture Exchange (CDNX) also fell off 2.4%. The TSX briefly broke under the April low before recovering on Friday. We are now below both the 50 and 100-day MAs with the 200-day MA looming below at 20,900. The trend remains up and we are not yet oversold although the RSI is now down to 38 and falling. Of the 14 sub-indices only one was up this past week, Information Technology (TKK) gaining 2.6%.
The larger TSX 60 was weaker than the TSX losing 1.9%. Leading the way down was Energy (TEN) down 3.5% followed by Consumer Staples (TCS) down almost 3.0%. Telecommunications (TTK) and Utilities (TUT) both fell 2.9% while Financials (TFS) dropped 2.4% and Income Trusts (TCM) was down 2.3%. The materials group were also down but lost less with Golds (TGD) down 0.9%, Metals & Mining (TGM) off 2.0% and Materials (TMT) down 1.7%.
The short-term trend (dailies) has turned down but the intermediate (weekly) and long (monthly) remain to the upside. Key will be the 200-day MA near 20,900 with interim support near 21,400. Regaining above 22,300 would be positive and suggest the down trend is over and that new highs could lie ahead. A more serious decline could be underway if we broke under 20,500.
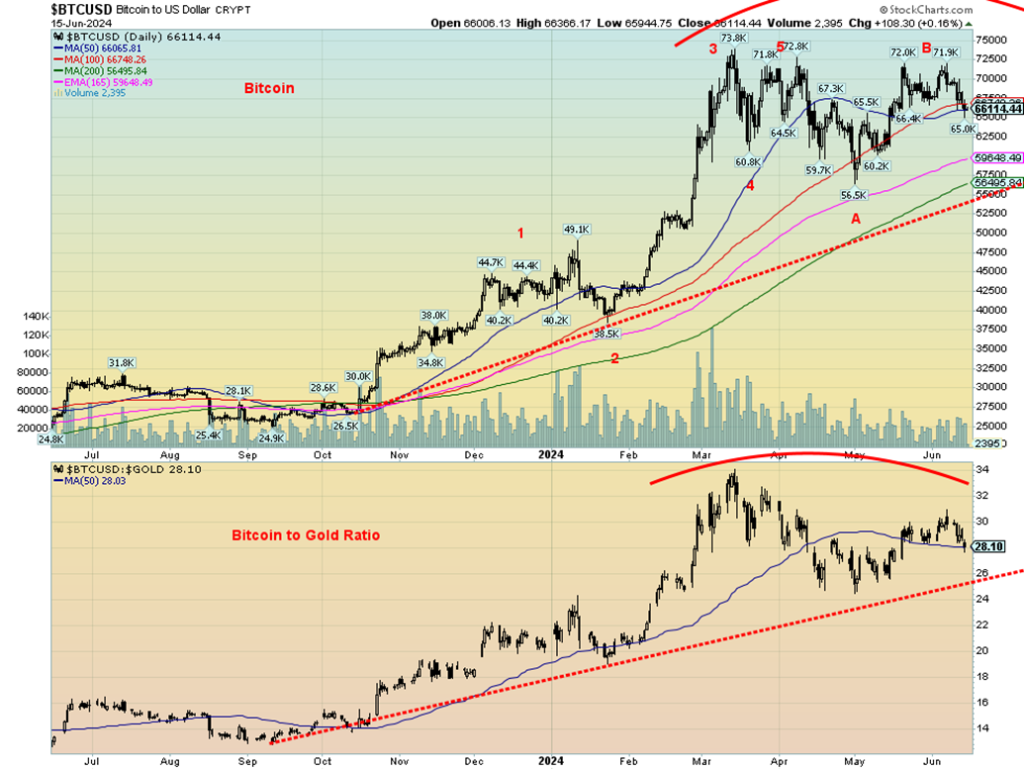
In some ways this was a surprise. Yes, we knew Bitcoin had been on a bit of a tear rising from $25,000/$26,000 back in August/September 2023 to over $70,000 recently. But since then, it has been a bit of a struggle including Bitcoin falling 4.8% this past week. No worries, it is still up 56.6% in 2024. After falling from the failed peak Bitcoin has rebounded but now that appears to be faltering.
A break under $65,000 appears imminent and under $60,000 we could quickly fall to $55,000. More intriguingly and a surprise is the Bitcoin/Gold ratio appears to be shifting in favour of gold. If the ratio falls under 26 a down move would be on its way in favour of gold over Bitcoin. The peak appears to be last March and since then gold has generally outperformed. New lows would confirm that outperformance.
U.S. 10-year Treasury Note, Canada 10-year bond CGB
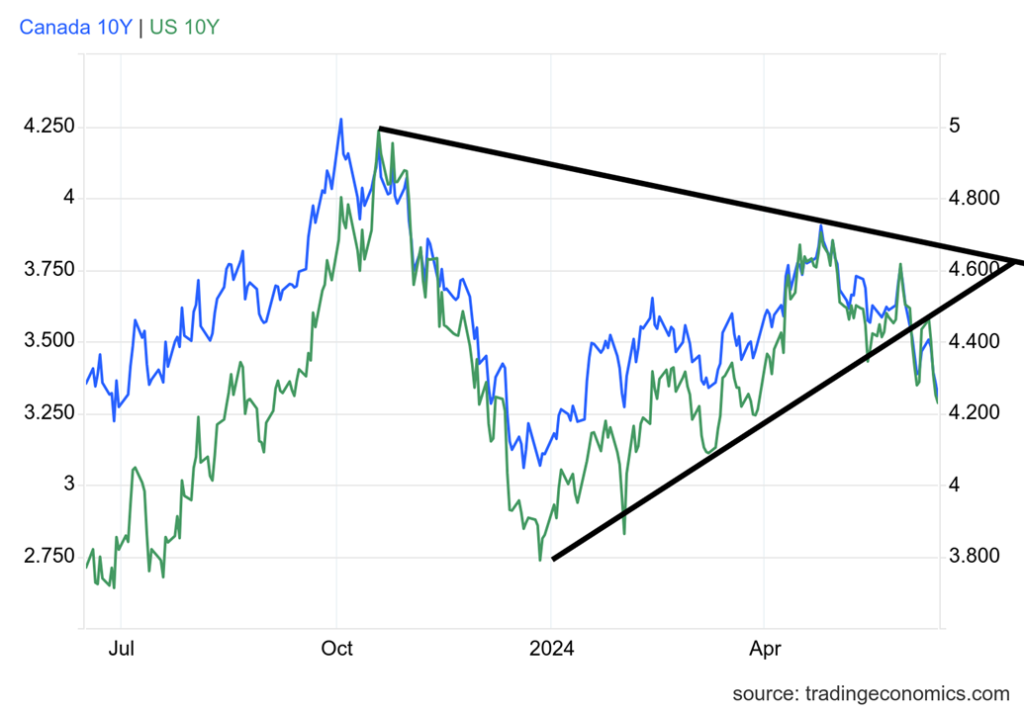
The Fed stood pat but hinted at least one rate cut in 2024; economic numbers were weaker; and, inflation was weaker than expected. All these helped long rates ease this past week. The U.S. 10-year treasury note fell from 4.44% to 4.23% while the 10-year Government of Canada bond (CGB) dropped from 3.49% to 3.31%. Long rates falling helps mortgage rates and we expect to see cuts to the mortgage lending rate going forward in both Canada and the U.S. Both bonds broke the yield uptrend this past week suggesting that rates may fall even further possibly even down to 4% in the US and 3% in Canada. However, we wouldn’t hold our breath as a period of consolidation is more likely.
Still the rate drop was welcomed. Funny part was the spreads actually widened as the U.S. 2-10 spread went out to 49 bp from 46 bp while in Canada the same 2-10 spread widened to 59 bp from 54 bp. We note that, as it might be suggesting that any recession remains months away. Or at least an official recession as many are feeling the pinch and believe a recession is already here. Nonetheless, to get a recession we still need two consecutive quarters of negative growth. In Canada we’ve had the odd quarter that went negative but Canada
has never had two consecutive quarters of negative growth. In the U.S. they did have two consecutive quarters in 2022 but still it was not called a recession. The U.K. recorded two consecutive quarters but then it was followed by a growth quarter. Japan has been going one quarter down the next quarter up.
The same process is playing out elsewhere (EU, China, Italy, France) where there are no consistent periods of negative GDP growth but there are persistent low growth quarters. So officially no recession but for many it will feel like one. So, on hand we have persistent above desired inflation coupled with low growth. Stagflation? Many believe its time for the Fed in particular to raise its inflation targets.
Not too many numbers to hang one’s hat on this coming week. Canada reports housing starts, housing price indices and PPI. The U.S. also reports housing starts, and retail sales, plus a few manufacturing indices.
Continued weakness will keep some downward pressure on interest rates but reality is the market wants the central banks (Fed, BofC etc.) to cut rates.
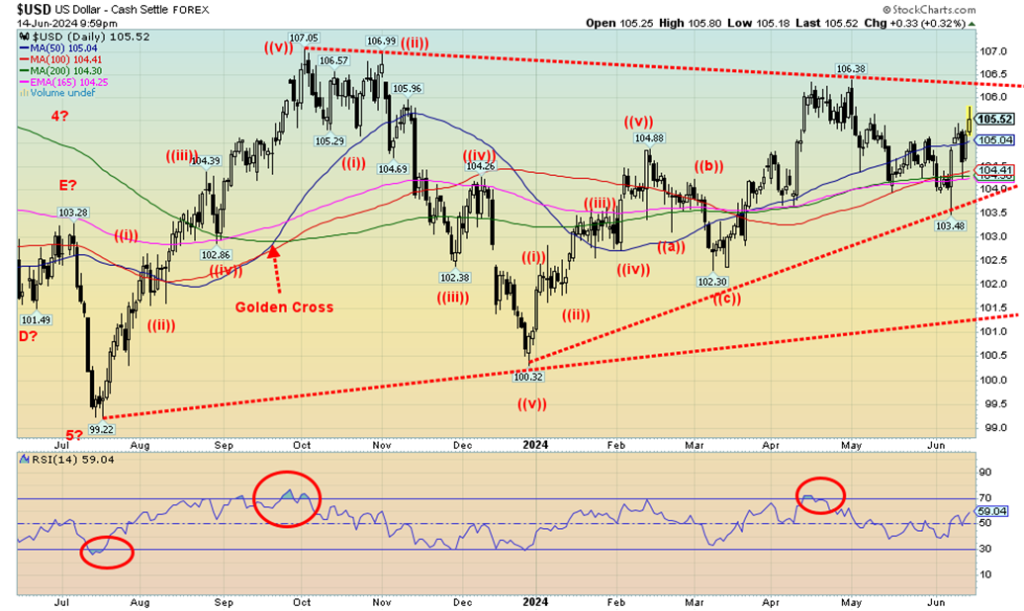
The US$ Index rose this past week as the CPI moderated and the Fed left interest rates unchanged. Given others are cutting rates (BofC, ECB) it continues to leave the U.S. with some of the highest rates in the developed countries. As well, with war in Europe (Russia/Ukraine) and the potential for spreading war in the Mid-East it has encouraged capital flows out of those areas into the U.S. It then generally finds itself in the U.S. stock market or U.S. treasuries. The US$ Index rose 0.6% this past week.
The euro fell 0.9%, the Swiss franc was off 0.5%, the pound sterling down 0.3% and the Japanese yen down 0.4%. Only the Cdn$ managed a gain up a small 0.2%. Only the US$ Index remains in an uptrend while the others are either in a downtrend or at least a weakening trend. The US$ Index remains below a potential breakout up at 106.25. If we break above that level a stronger up move could be seen. That in turn is not only negative for other currencies but potentially also gold. Support begins to give way below 104 and turns down under 103.50.
Oddly the U.S. dollar has been weakening against the Russian ruble but strengthening against the Chinese yuan. Neither currency has the depth or is used in international trade as compared to the U.S. dollar, the yen, the pound, the euro or the Cdn$ although the use of the yuan is growing. Sanctions against Russia in particular and trade wars with China have triggered a Dedollarization process but it hasn’t reached a point yet of being a major threat to the dominance of the U.S. dollar.
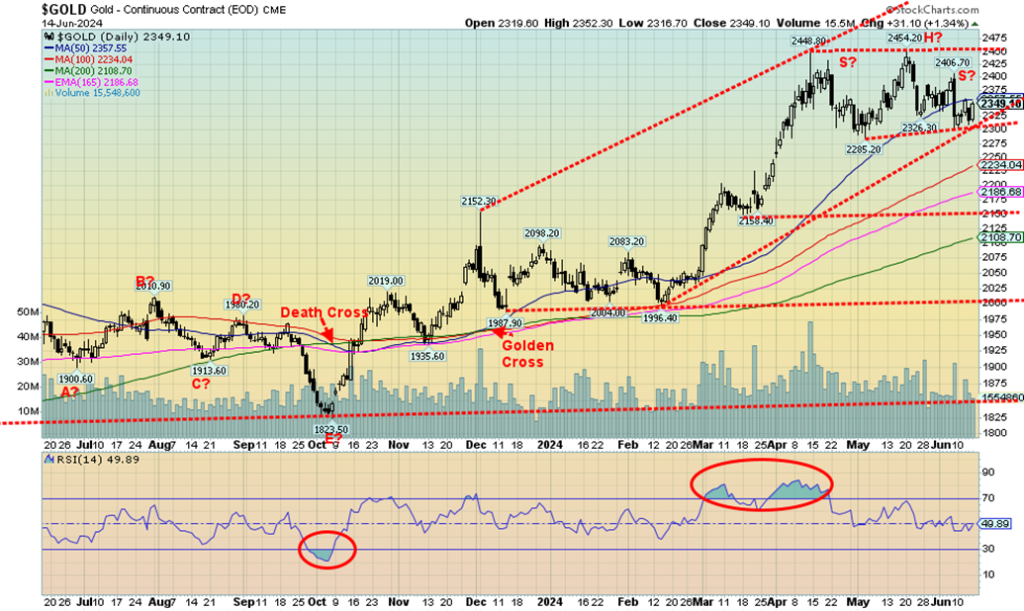
A week ago, we had that sharp scary drop on Friday bringing back memories of April 12/15, 2013 when gold along with silver and the gold stocks crashed. However, the downside follow through has been negligible and we spent the week basically whipsawing with ups and downs closing the week slightly up. It might be the sign we are trying to make a bottom but then we observed a potential small head and shoulders top pattern (it’s not a clean one) so we will have to watch $2,300 for any potential breakdown.
Potential targets on the H&S pattern are $2,125/$2,150. However, if we were to regain back above $2,400 then we’d negate the potential H&S pattern. Until then we wait but be wary of a break under $2,300. It could break but unless it is sustained it could be a false hook.
On the week gold gained 1.0%, silver was up an anemic 0.1% while platinum was hit again falling 1.3%. Of the near PMs palladium was down 2.7% while copper was up a feeble 0.2%. The Gold Bugs Index (HUI) fell 0.4% while the TSX Gold Index (TGD) was off 0.9%. Gold, silver and the gold stock indices remain up in 2024 but platinum is in negative territory. It’s surprising for what is known as white gold as it is rarer than gold itself.
Nonetheless, gold remains in solid demand from central banks particularly Asia and steady demand in India and China. As we keep repeating gold has been around for upwards of 3,000 years as money and of course as jewelry because of its lustrous quality and doesn’t tarnish. And also, as we often say, gold is no one’s liability. Money is worth more when it is backed by something other than the governments promise to pay (an IOU).
Under a gold standard, things were generally more stable but when the gold standard was removed things
became more volatile as debt and money grew. Given today’s unsustainable debt and massive monetary growth there are those who believe that a return to a gold standard of some sort is inevitable to bring stability. China and Russia haven’t been buying gold just because they like the colour. The purpose is to bring stability to the yuan and ruble and strengthen their currency as they continue the process of de-dollarization.
Gold has gained some 35% since that low last October 2023 so pullbacks are not unusual. Despite the current correction the trend remains firmly to the upside. This is the second corrective period since that low so this might be a fourth wave up. The fifth wave up could take us as high as $2,800 once we surpass $2,500. May/June is typically a weak period for gold with a stronger up cycle starting in July that could take us into October.
The background is there with geopolitical divisions, domestic political divisions, an upcoming deeply divisive election, unsustainable debt, persistent inflation and a slowing economy. Gold has been leading the way with record highs even as silver and the gold stock indices remain well below their all-time highs. The junior gold mining market remains moribund as the focus seems to be more on AI stocks, cryptos and GameStop. It is, however, a small market and if there is any shift started towards it, a sharp rise could follow.
Resistance at $2,400, support at $2,300 and then $2,200.
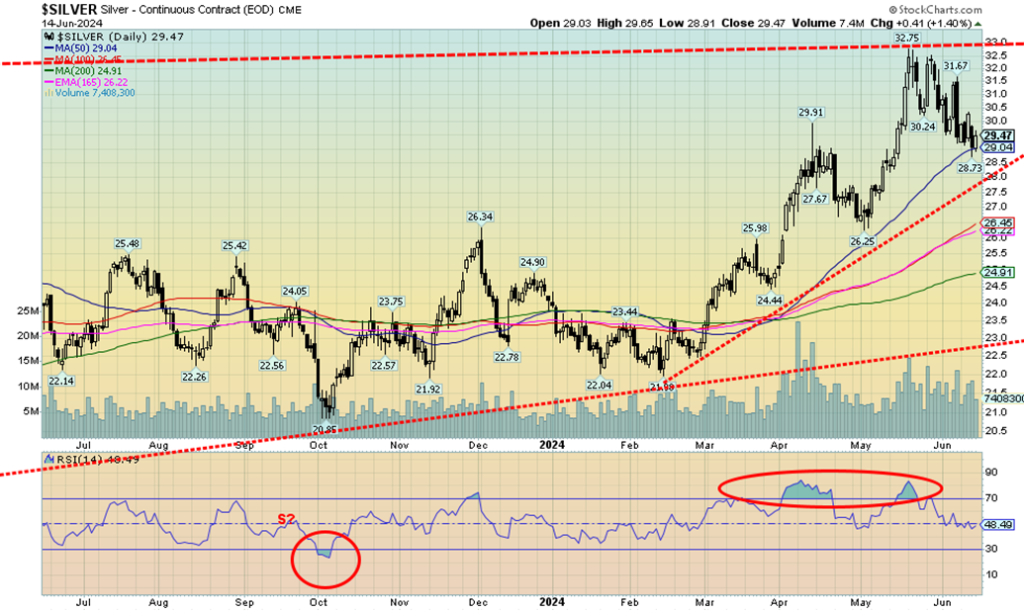
Silver continued its recent correction this past week even as it gained a small 0.1%. We can’t rule out a test of that uptrend line from the February low that is currently near $28. Only a breakout above $32 and particularly the resistance up to $33 would convince us that the correction is over and we’re on our way to the next level with targets up around $39/$40. Many believe targets are considerably higher but we prefer to take it one step at a time.
We have dropped from overbought levels but we are not yet oversold with the RSI at a respectable 48. That’s neutral. As with gold, we’ve been a bit volatile of late but nonetheless currently rest on the 50-day MA. A break of $29 could take us down to $28. Regaining $30 might suggest a low but we prefer to use $32 to convince us a low is in.
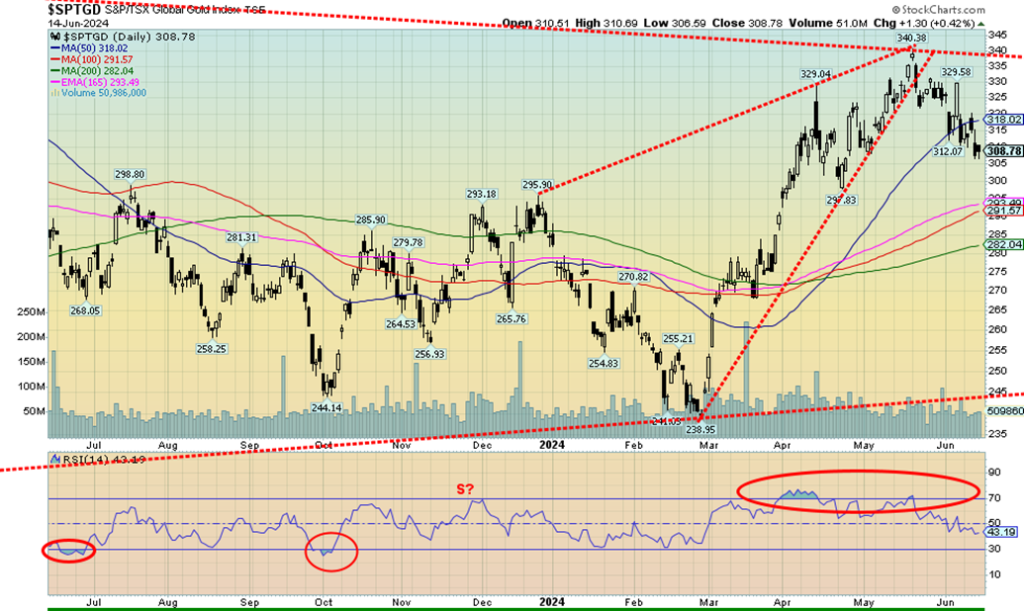
Weakness continues for the gold stocks as they consolidate below potential more important breakout points. On the week the TSX Gold Index (TGD) fell 0.9% while the Gold Bugs Index (HUI) was off 0.4%. Both remain up in 2024 by 8.5% and 7.7% respectively. All this occurred despite gold being up marginally on the week while silver was basically flat. Key points remain for both the TGD and HUI.
The TGD needs to firmly take out 340 while the HUI needs to break above 300 to suggest higher prices. Meanwhile we appear to be correcting that good upward move in February to the top in May. The TGD gained 42% during that period so the current 9.5% pullback feels rather normal. During the 2009-2011 bull market for gold stocks where the TGD gained over 200% there were 3 pullbacks of 20% or more. Each pullback served the purpose of shaking out the weak hands as others bought in.
So, the current 10% pullback is not unusual especially following a sharp upswing. In fact, the initial 200% plus gain from October 2008 to a high in March 2009 was met with a 25% pullback. May/June tends to be weak seasonally for gold and gold stocks so in many respects this is not a surprise especially after a period of good gains. We still have a potential compelling head and shoulders bottom pattern but we need to firmly break above 340 to confirm the next phase. It has targets up to 540 some 75% from current levels. In the interim we’ve dropped under the 50-day MA so could we test the 200-day MA near 28. Interim support is at 290.
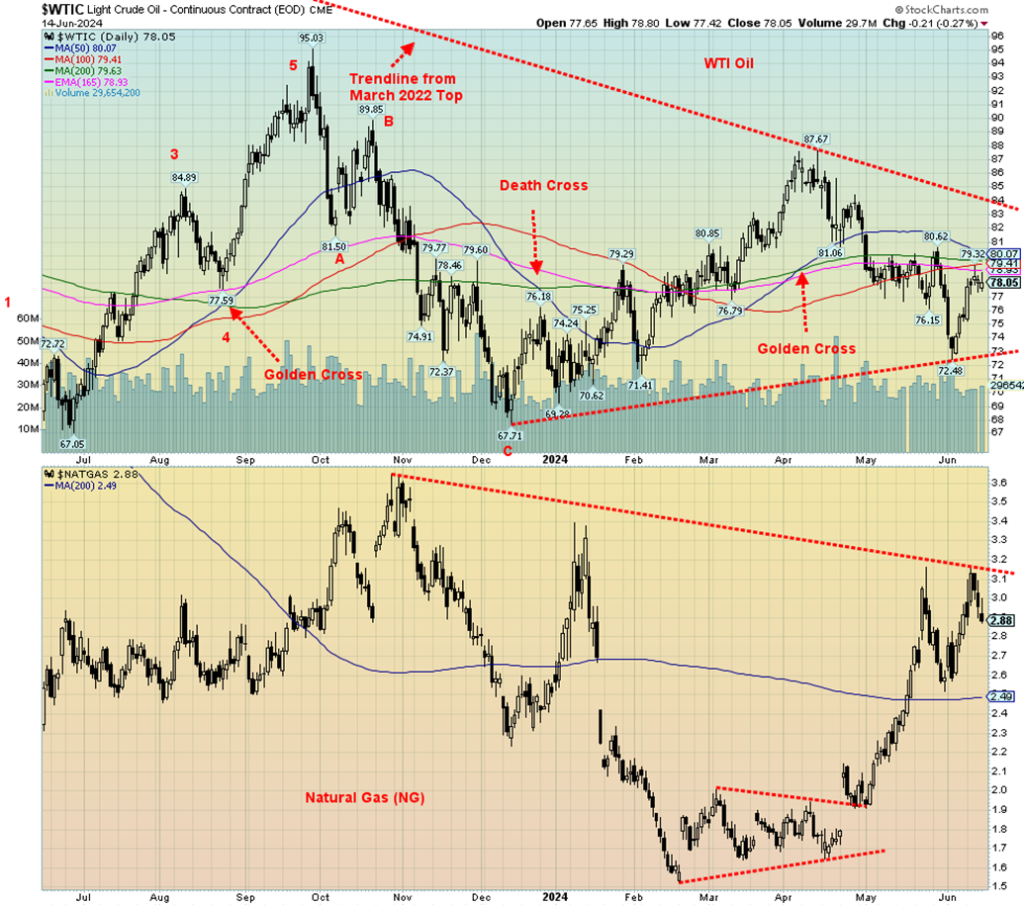
Following a period of weakness oil prices rebounded this past week on signs of easing inflation and some demand upticks. Nonetheless, WTI oil remains below a potential breakout zone above $80. On the week WTI oil gained 3.3%, Brent crude was up 3.7% and over $82. Natural gas (NG) at the Henry Hub was flattish falling 4 cents or 1.4%. But at the EU Dutch Hub NG caught up rising 6.8% on concerns about LNG storage facilities and slow progress in refilling gas storage for winter.
Demand has shot up in the EU because of heat waves. Given the Russia/Ukraine war getting NG from Russia is no longer an option and any deliveries of Russian NG are unreliable. Despite the oil gains, the oil stocks weren’t buying it as the ARCA Oil & Gas Index (XOI) fell 2.4% while the TSX Energy Index (TEN) was down 3.5%.
Seasonally the period from June to August is generally weak for both oil and NG and by extension for the energy stocks. The result is that unless something heats up on the war front that could disrupt supplies (see Iran) energy prices are not expected to do much for the next month or two. Yes, demand for NG can increase due to the heat waves and some believe an escalation in the Israel/Hezbollah war could also result in upward pressure on energy prices because of the potential involvement of Iran. Many are also scrambling still trying to replace Russian oil and gas even as Russia evades sanctions by selling to friendly countries then they repurpose and resell to countries that may have sanctions against Russia. Another version of smuggling. Just change the flags.
As noted, WTI oil needs to break above $80 to suggest higher prices and NG needs to breakout over $3.10 to suggest that a new upward phase is officially on its way. We don’t see much in the way of downside for either even as consolidation may take place. But if the above points break, we’ll know where we’re going – up.
Copyright David Chapman 2024
__
(Featured image by Joshua Mayo via Unsplash)
DISCLAIMER: This article was written by a third party contributor and does not reflect the opinion of Born2Invest, its management, staff or its associates. Please review our disclaimer for more information.
This article may include forward-looking statements. These forward-looking statements generally are identified by the words “believe,” “project,” “estimate,” “become,” “plan,” “will,” and similar expressions. These forward-looking statements involve known and unknown risks as well as uncertainties, including those discussed in the following cautionary statements and elsewhere in this article and on this site. Although the Company may believe that its expectations are based on reasonable assumptions, the actual results that the Company may achieve may differ materially from any forward-looking statements, which reflect the opinions of the management of the Company only as of the date hereof. Additionally, please make sure to read these important disclosures.
David Chapman is not a registered advisory service and is not an exempt market dealer (EMD) nor a licensed financial advisor. He does not and cannot give individualised market advice. David Chapman has worked in the financial industry for over 40 years including large financial corporations, banks, and investment dealers. The information in this newsletter is intended only for informational and educational purposes. It should not be construed as an offer, a solicitation of an offer or sale of any security.
Every effort is made to provide accurate and complete information. However, we cannot guarantee that there will be no errors. We make no claims, promises or guarantees about the accuracy, completeness, or adequacy of the contents of this commentary and expressly disclaim liability for errors and omissions in the contents of this commentary. David Chapman will always use his best efforts to ensure the accuracy and timeliness of all information. The reader assumes all risk when trading in securities and David Chapman advises consulting a licensed professional financial advisor or portfolio manager such as Enriched Investing Incorporated before proceeding with any trade or idea presented in this newsletter.
David Chapman may own shares in companies mentioned in this newsletter. Before making an investment, prospective investors should review each security’s offering documents which summarize the objectives, fees, expenses and associated risks. David Chapman shares his ideas and opinions for informational and educational purposes only and expects the reader to perform due diligence before considering a position in any security. That includes consulting with your own licensed professional financial advisor such as Enriched Investing Incorporated. Performance is not guaranteed, values change frequently, and past performance may not be repeated.


Augustine Raises $17 Million in a Round Co-Sponsored by Eli Lilly and Led by Asabys
Augustine Therapeutics raised 17 million euros in the first closing of a Series A round led by Asabys Partners. Eli...


PlanRadar: Digital Solutions Can Simplify the Proof of ESG Compliance
PlanRadar, a platform for digital documentation in construction, facility management, and real estate, found that only a third of industry...


US Spot Bitcoin ETFs Record $31 Million Net Inflows After Outflow Trend
US spot Bitcoin ETFs have seen a significant turnaround with net inflows of $31 million after continuous outflows. This indicates...


Nickel Is Considering Diversifying its Offer in Belgium
Nickel offers payment cards linked to a current account in Belgium without traditional banking. With 500 sales points and plans...


Brazil’s Supreme Court Decriminalizes Cannabis Possession
Brazil's Supreme Court decriminalized cannabis possession for personal use, a major shift amid longstanding debates. This decision, aimed at alleviating...
 |
|
 |  |
 |
|
-

 Impact Investing2 weeks ago
Pictet AM Launches Environment Co-Investment Fund I Eltif
-
 Impact Investing6 days ago
Another 42 Million Euros of Issues for the ESG Basket Bond Supported by CDP and Unicredit
-
 Crypto2 weeks ago
Fed Keeps Interest Rates Stable – Bitcoin Loses Recent Gains
-

 Biotech2 days ago
Faes Farma Expands Investment to 200 Million Euros to Reinforce Production