Markets
Why the Entire Debt Market Is Seeing Declines in Yields
My recommendation on the debt market is to leave it alone and watch this show from afar. I say that knowing this advance in bonds may go on longer, and stronger than I believe possible, but that is how I see it. But if you are one of those nimble traders, someone who doesn’t fall in love with their positions, and can switch from being a bull to a bear in a moment; there may be some great trading opportunities.
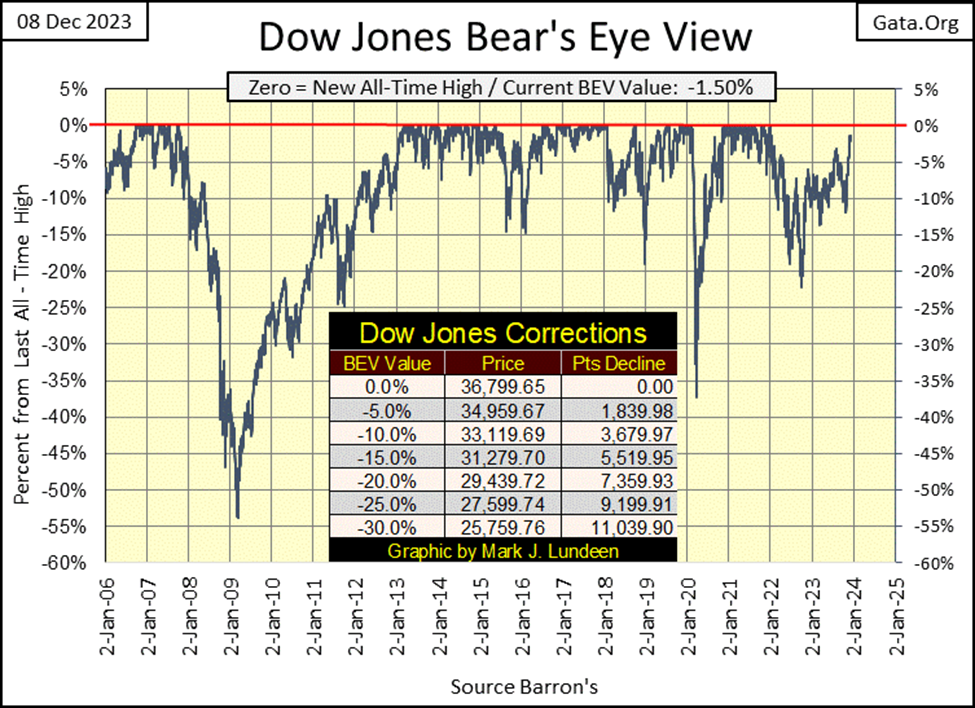
This week, the Dow Jones in its BEV chart below closed above last week’s close, by 0.01% BEV points, or up $2.37 from last week. Not much of an advance, but it wasn’t a decline either. So, we’re only 1.50% BEV points from the Dow Jones’ last all-time high, that is only $551.78 separates this week’s close with the Dow Jones’ last all-time high, of 04 January 2022.
The bulls in the weeks or months to come should have what it takes to close this gap in the Dow Jones. If they can’t make that happen, that would be a major indicator we’re at a major top in the market, with nowhere to go but down in the first half of 2024.
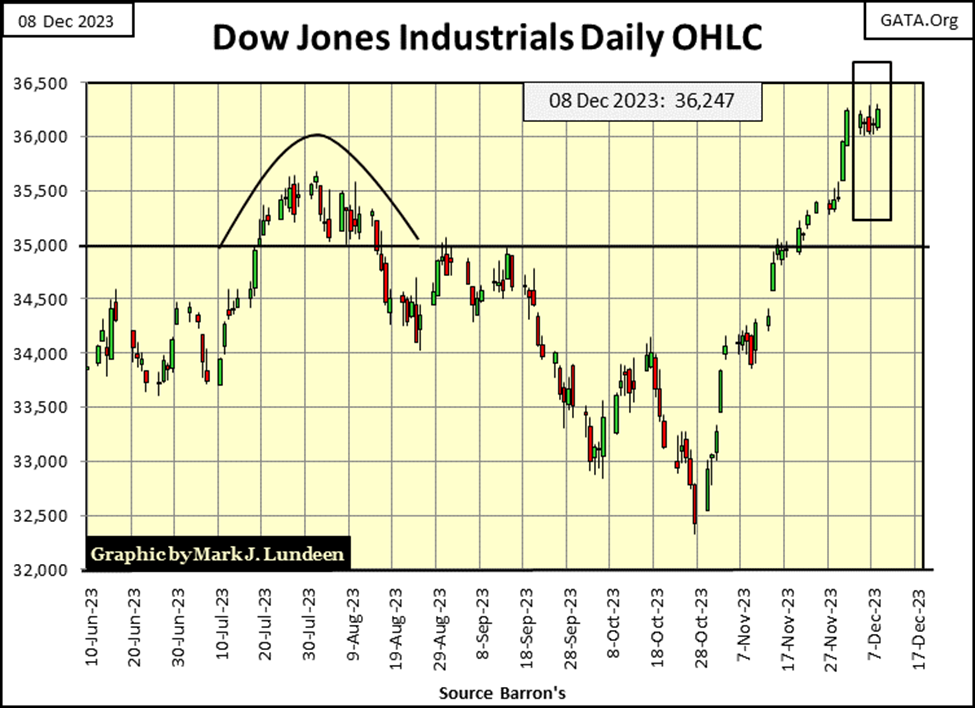
Looking at the Dow Jones in daily bars below, we see this week the Dow Jones did nothing much for the bulls; zero follow up on last week’s stellar advances.
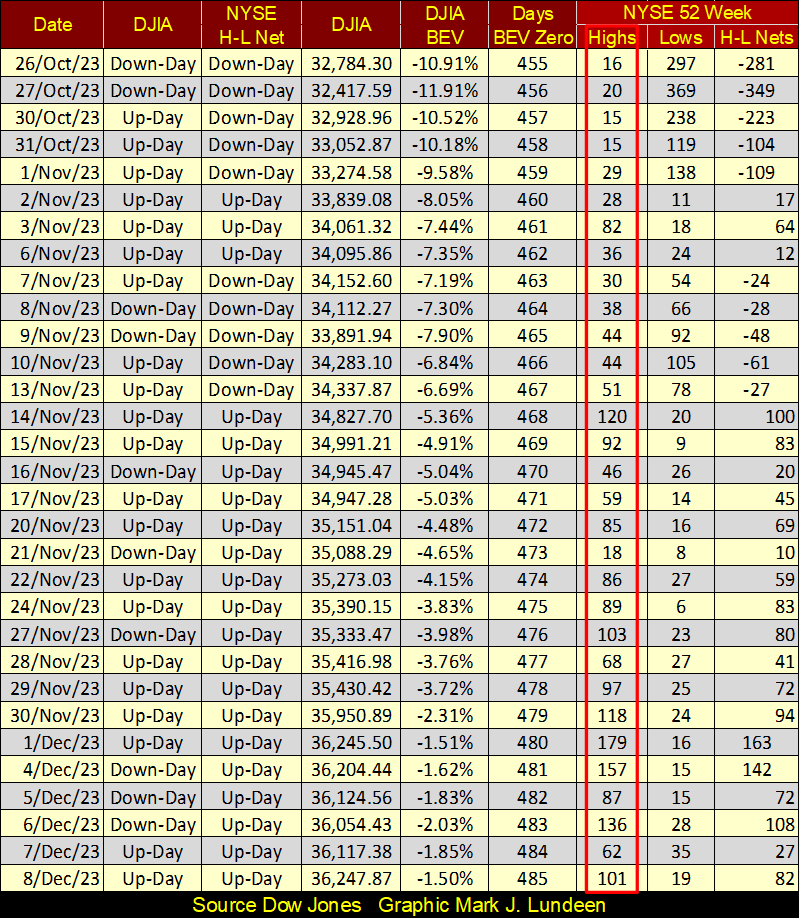
As noted last week, the Dow Jones made a new 52Wk High, something most issues trading at the NYSE (2,922 of them) have failed to do, as seen in the table below. What to think about that? In October, the NYSE was dominated by 52Wk Lows. On October 23rd, 454 of the 2971 issues trading on the NYSE hit a 52Wk Low, or 15.3% of all issues trading that day closed at a new 52Wk Low. It was a bottom, and the market has been advancing since, as seen above.
If the Dow Jones’ next big thing is to begin a significant decline, without first seeing a new all-time high in the past two years, this would be the type of market that could happen in. And then, the Dow Jones could make a new all-time high. What would happen after that is the question?
My table below lists the BEV values for the major market indexes I follow; the lack of new all-time highs (BEV Zeros / 0.00%) is becoming an embarrassment for the bulls. Monday, the NASDAQ Insurance Index (#1) saw a BEV of -0.15%. This was deep in scoring position, just a tiny sliver, only 0.15% from making a new all-time high. So, where does it close on Friday? With a BEV of -1.18%.
What a flirt this, and some of the other better performing indexes, like the Dow Jones (#2), are being in late 2023. The thing about being in scoring position is; these indexes should score with a new all-time high, but they don’t.
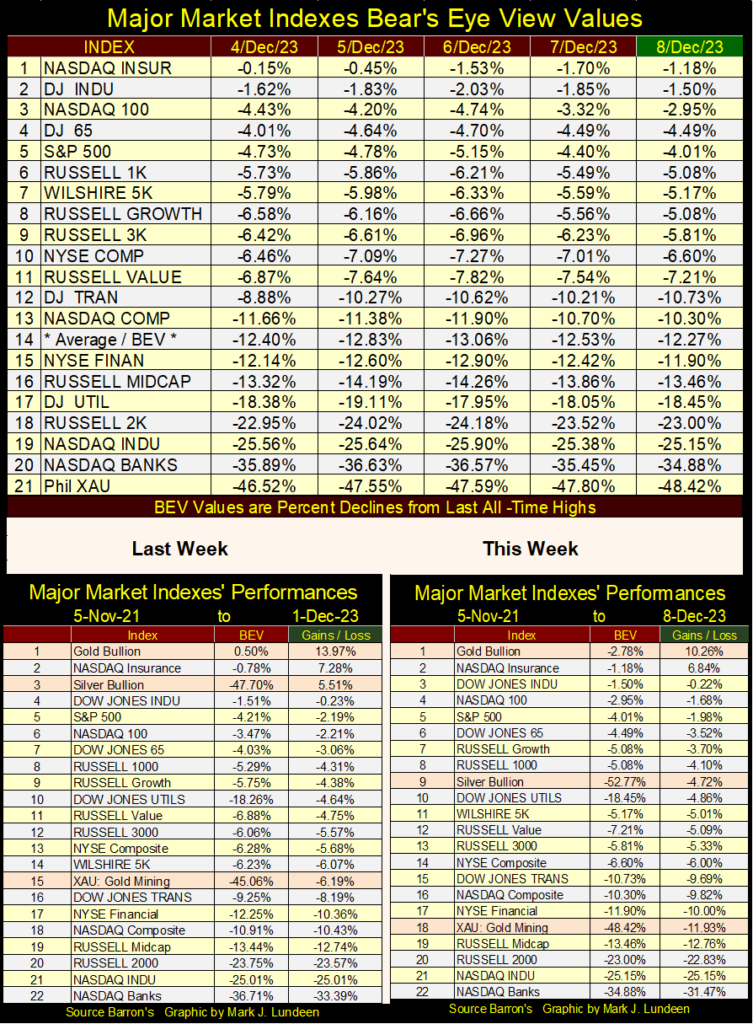
In the performance tables above, silver and the XAU took big hits this week. Gold lost too, but managed to remain in the #1 position in the table. So, who is making money in the stock market? Looking at the data above, except for the daily and weekly variations in valuation, market noise, no one is in the stock market. It’s a different story in the bond market.
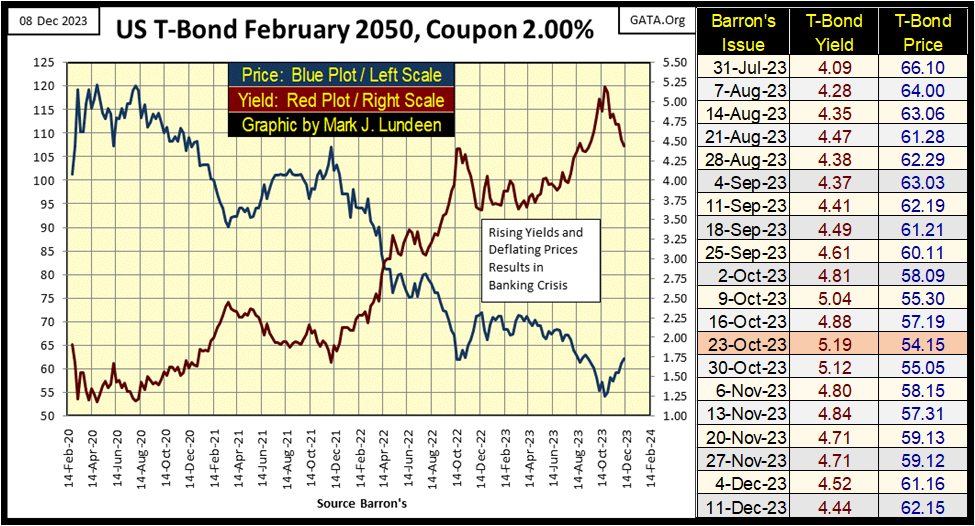
Something that should be concerning for the bulls, are the lackluster gains noted above, when considering the decline in bond yields seen in the long T-bond below. The yield for this bond has fallen 75 basis points since Barron’s October 23rd issue, its valuation advancing 15%. I believe this bond’s valuation has outperformed the gains seen in the stock market’s major indexes seen above.
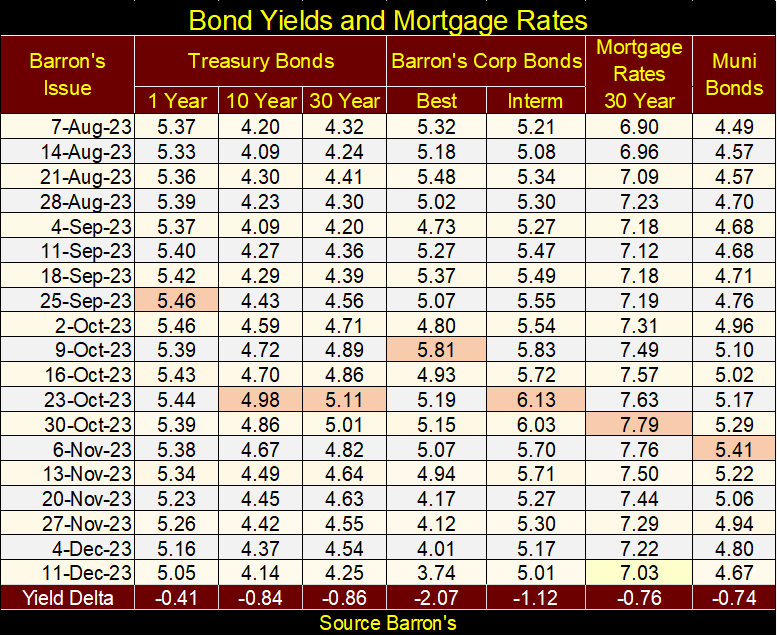
It’s not just the T-bond market seeing significant yield declines. Barron’s Best Grade Bond Yields have collapsed by a full 2.07% since early October. Unfortunately, Barron’s has never published valuations for this bond’s data series, but with a decline of over 2% in yield, these bonds’ valuation must be taking off like a rocket.
In the bottom BP Delta row, are listed the yield declines from their highlighted peaks. It appears the entire debt market is seeing declines in yields, and valuations advance in a big way.
So, should we invest in this bull market in bonds? What bull market? Are you talking about this correction in what will almost certainly be the most profound bear market in debt in the history of the United States? Looking back in a couple of years, late 2023 will certainly seem like the good old days in the bond market.
My recommendation on the debt market is to leave it alone, and watch this show from afar. I say that knowing this advance in bonds may go on longer, and stronger than I believe possible, but that is how I see it. But if you are one of those nimble traders, someone who doesn’t fall in love with their positions, and can switch from being a bull to a bear in a moment; there may be some great trading opportunities in the debt market. Speaking for myself, I’m going to watch this show from afar.
I used to follow Richard Doughty, aka The Mogambo guru. Richard had a great sense of humor as he followed the financial markets. More than just a few times, he’d write something I had to include in my file of quotes, like the following:
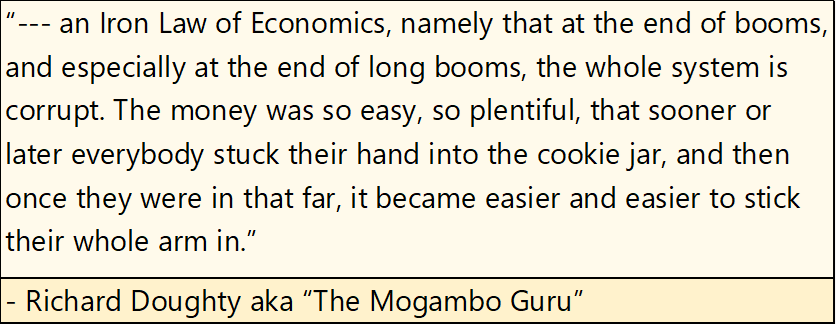
The above quote from years ago is still true, especially for our current stock market boom. A very long boom that has been booming for the past forty-one years, since August 1982. And sticking one’s hand in the cookie jar isn’t just a matter of pulling out some of the money to be found there. Doing so is questionable, if not outright illegal.
Not so much for retail investors, people assuming more debt than is good for them, and are well regulated by “government regulators,” but by the big market makers, financial institutions that dominate the markets.
I’m not a big fan of Rolling Stone Magazine, but every now and then, even they get something right, like the following quote from Matt Taibbi on Goldman Sachs:
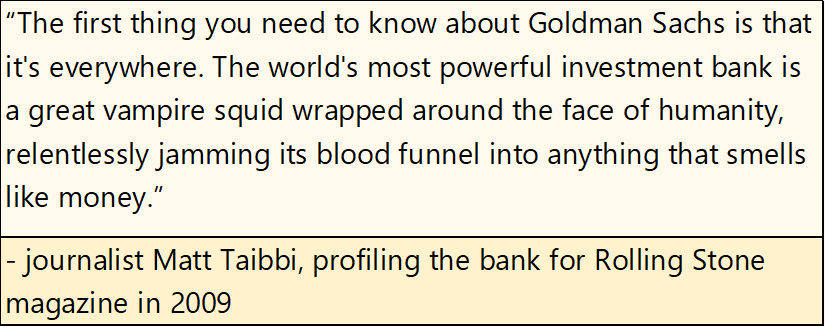
The above quote was written during the aftermath of the sub-prime mortgage crisis, which market makers such as Goldman Sachs, JP Morgan and many others made a killing during the bull market in single family homes (sub-prime mortgages) from 2002-2007.
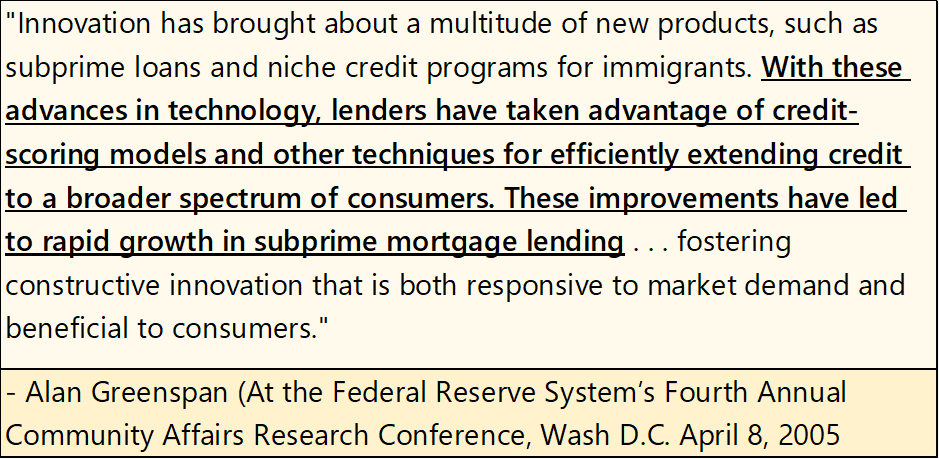
They, Wall Street’s big banks, during the boom in housing did some questionable things with derivatives. Derivatives; “stabilized the markets by shifting market risks to those best able to bear them.” Or so we were told by Alan Greenspan; then chairman FOMC, and Robert Rubin; former US Secretary of the Treasury during Congressional testimony in the autumn of 1999. I believe that is also when the rule of not being able to short a stock until there was an uptick in price was eliminated. It seems derivatives made that rule unnecessary too, or so they thought in 1999.
Their scam was then called “structured finance,” that magically transformed non-performing mortgages, into AAA rated debt Wall Street then sold to pension funds, charitable trusts or anyone else with a few billion dollars to invest in “AAA rated debt.”
Using derivatives, the banking system could, and did make $250,000, and larger mortgage loans to credits (unemployed deadbeats) previously believed too risky to make loans too. By bundling these junk mortgages with higher quality mortgages via derivatives, anything became possible. Wall Street then flooded the debt markets with this garbage, making a fortune by mispricing junk mortgages. As long as trusting fiduciaries were willing to use their beneficiaries’ funds to buy Wall Street’s toxic waste, and resisted the urge to sell, all was right with the world. That was until late 2007.
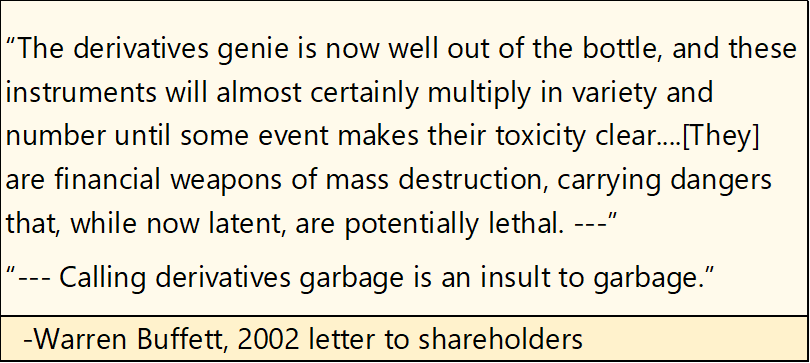
The derivative disaster that was the sub-prime mortgage bubble bust (2007-2009) was predictable. Warren Buffett saw it coming as far back as 2002, as he noted in his 2002 letter to Berkshire Hathaway shareholders below.
With the bust in sub-prime mortgage, came the knowledge of exactly who was best able to bear the market risks of knowingly selling worthless, nonperforming mortgages to fiduciaries of other peoples’ money – the US Taxpayer. Washington couldn’t do enough to keep the likes of Goldman Sachs and JP Morgan in business in the aftermath of the crash, and so they, and their ilk remain with us today, still doing what they do best; making money anyway they can.
Being the curious sort, I wonder exactly what unethical schemes these banksters are running today. Thanks to Mac Balkam, CEO of Eskay Mining, who sent me a video link on questionable short selling, or naked-short selling in the junior mining sector, I think I’ve found one, but don’t know for sure.
Mac is a former RCMP Mountie, who investigated fraud and market manipulation, before he became a broker for twenty-four years. He isn’t exactly sure what is going on with Eskay Mining’s depressed share price, except he’s sure something isn’t right in the entire junior gold and silver miners, and exploration sector.
This is nothing new. I remember well how over a decade ago, abuses in naked short selling by Wall Street and hedge funds were being noted in the pro-gold internet sites. But back then, what could anyone do about it? Go to the SEC to file a complaint? That would be a waste of time, as Wall Street purchased the government’s “market regulators” long ago.
This is what makes bringing up naked short selling today worthwhile; someone is finally doing something about it, as seen in the three video links below.
But first, what is short selling? It’s selling a company’s stock short, or selling a company’s stock that one doesn’t actually own. Do this with your neighbor’s automobile, and the police will soon be hunting you down. But if one has a margin account with a broker, an account where investors can speculate by borrowing money from their broker, it’s possible for someone to short-sell a company’s stock.
Note: I’m no “market expert.” I’ve never personally shorted a stock. But as I understand the process, this is how shorting stocks work.
Let’s say you have $10,000 to buy Whiz-Bang Enterprises, as you really like this company’s prospects. So, you open a margin account with your broker. Borrowing $10,000 on margin, you can now purchase $20,000 of Whiz-Bang Enterprises’ shares, which will double your profits if it goes up. Or double your loses should it goes down.
So, with your margin account, that is what you do; buy $20,000 of Whiz-Bang with your $10,000. But legally, these shares of Whiz-Bang belong to your broker as much as they belong to you, as like you, your broker put up half the money to buy them. Like you, your broker intends to make money with them. But unlike you, who purchased them, your broker will attempt to have them shorted (sold) by a short seller, if your broker doesn’t short these shares of Whiz-Bang Enterprise themselves.
As a leveraged speculator of Whiz-Bang Enterprise, this isn’t good for you, as you want these shares to go up in value. But this isn’t necessarily bad for the market itself, as shorting as described above provides some negative feedback to the stock market. When do most people decide to buy stocks on margin? Unfortunately, at market tops. Shorting stocks provides a market mechanism to quell the animal spirits, when investors believe they are ten foot tall and bullet proof at market tops.
At market tops, being a market top, there is nowhere for the market to go but down. People who purchased stocks on margin, will on the market’s decline begin selling to close their short position, or their broker will provide that service for them. But who wants to buy stocks in a declining market? As this works out, the short seller who sold your shares at the top, will also be covering their position by buying them back, providing something urgently needed in a market decline; buying demand.
Naked-short selling is the issue here, and not all naked-short selling is bad. Naked short selling is something a broker, or market maker does. They receive an order to short so many shares of Whiz-Bang Enterprises from a big hedge fund that does a lot of business with them. So, that is what they do to keep this important client happy, sell the required shares short for the hedge fund.
However, if the broker doesn’t have the required shares in the company’s margin accounts – the broker is now a naked short seller, but they have until the close of the day’s trading to find them. If they find them, the broker is no longer a naked short. If they don’t, the broker can file a 14-day extension to find these shares. If found in the next 14 days, the hedge fund can keep its short position on Whiz-Bang Enterprises. If the broker can’t locate the shares, they must force the hedge fund to close their short position.
The problem with naked-short selling comes when brokers no longer bother to locate shares of stocks purchased on margin. Months, and even years can pass, creating; Failures-to-Delivers (FTDs).
Legally, the number of shares issued by a company for trading in the stock market are determined by a company’s board of directors. But should FTD short selling become a business model in the brokerage industry, this illegal short-selling by brokerages can increase a company’s float of shares outstanding by many multiples. In effect, FTDs create counterfeit shares in the market. Increasing supply of anything in a market, forces the price of that thing down, including the share price of junior gold and silver miners and exploration companies.
The junior gold and silver miners, as well as companies in the mineral exploration sector would be a prime target of FTD naked short trading. These companies are cash poor, relying on their share prices to fund future operations. By short selling these companies via FTD orders, which is illegal, not that the government regulators would notice, naked short selling can drive the share prices down to nothing, bankrupting the targeted company.
This would be much desired by these naked short-sellers, as they then don’t have to cover (buy back the shares shorted), allowing them to keep all of the money they received from short selling the shares – INCOME TAX FREE.
Is this actually happening in the gold and silver mining sector? I’m damned sure something has been keeping the sector’s valuations depressed for the past five decades. Naked-short selling using the FTDs, would explain much of what is seen below in the Barron’s Gold Mining Index (BGMI).
The BGMI peaked in October 1980 at 1285.16. Note that forty-three years earlier, it was only 33.41 in October 1937. So, the BGMI gained 3746% during those four decades, or a dollar invested in 1937 returned $37.46 in 1980. Look ahead forty-three years, from October 1980 to December 2023. Four decades that saw the US national debt increase from $1 trillion, to over $33 trillion, an increase of 3300%. The Federal Reserve’s balance sheet increased from 134.45 billion in 1980, to 7,768.82 billion in 2023, an increase of 5777%.
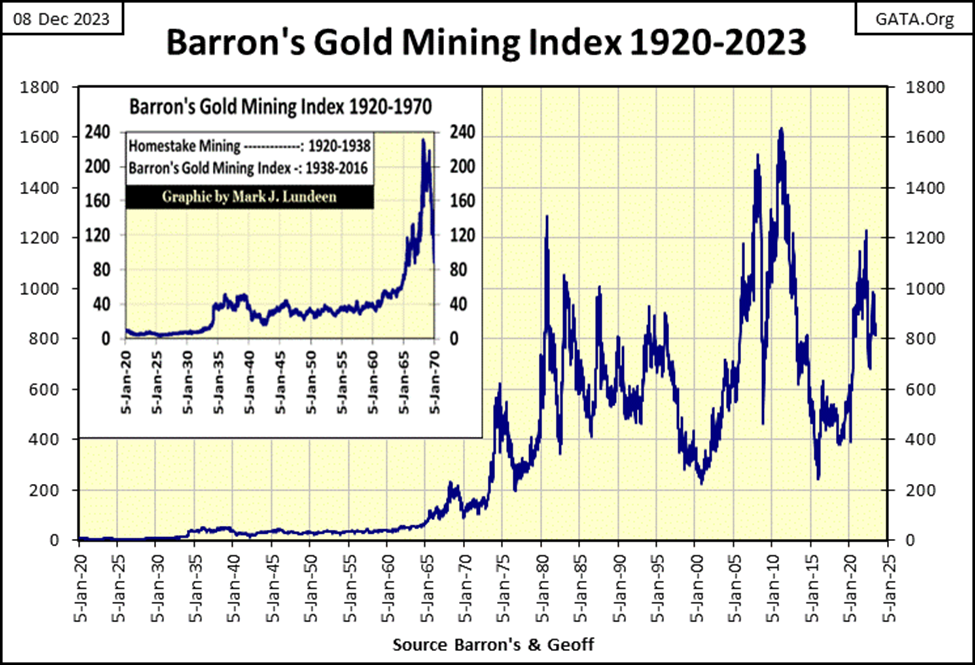
After all that inflation in US dollars, and increases in the national debt, how did the BGMI respond to the forty-three years of monetary inflation, and deficit spending in Washington DC from October 1980 to December 2023? It’s down 37% from its highs of October 1980.
There is something very wrong with this, and I wouldn’t doubt that naked short selling, using the FTDs, is largely responsible for the lackluster gains in the BGMI since 1980.
How could we discover whether naked short selling using the FTD model is a factor in the sub-performance of the BGMI seen above? After watching the videos below, I’d urge every junior gold and silver miner, or mineral exploration company to engage the services of David Wenger’s Shareintel, to discover what the hell is going on in their market.
I’m not being paid by Shareintel for promoting their services, or expect to be compensated by them. But if David Wenger decided to send some love my way, in the form of a check for mentioning his company in this article; I’d take it!
Anyway, after watching the three videos below, I’m very excited by the potential of what David Wenger’s Shareintel could do for many junior gold and silver miners, and the industry in general, should his services become widely used.
David also has a commanding camera presence, that would be sure to draw the attention of many viewers of any interview with him by the pro-gold internet sites that do such things. Mr. Wenger; a box of fine cigars (maduro wrapper, ring size of 60) and a bottle, or two of 100 proof bourbon, in lieu of a check would be acceptable with me.
What? Are you disgusted with my begging for money, nicotine, and booze from a total stranger? Well, until the CEOs of the junior gold and silver mining, and exploration companies begin correcting the irregularities taking place daily on the trading floors of the exchanges their shares trade at, my begging for the necessities of my life will only get worse. Like my pleading with David, a heck of a nice guy, or a very special someone, like you, to send me a shoebox stuffed full of $100 bills, or better yet, bars of pure gold.
Moving on to gold’s BEV chart below, last week gold closed at a new all-time high. Then this week, as has been the case since its BEV Zero of August 2011, all advance of gold into market history, have no follow through to higher levels.
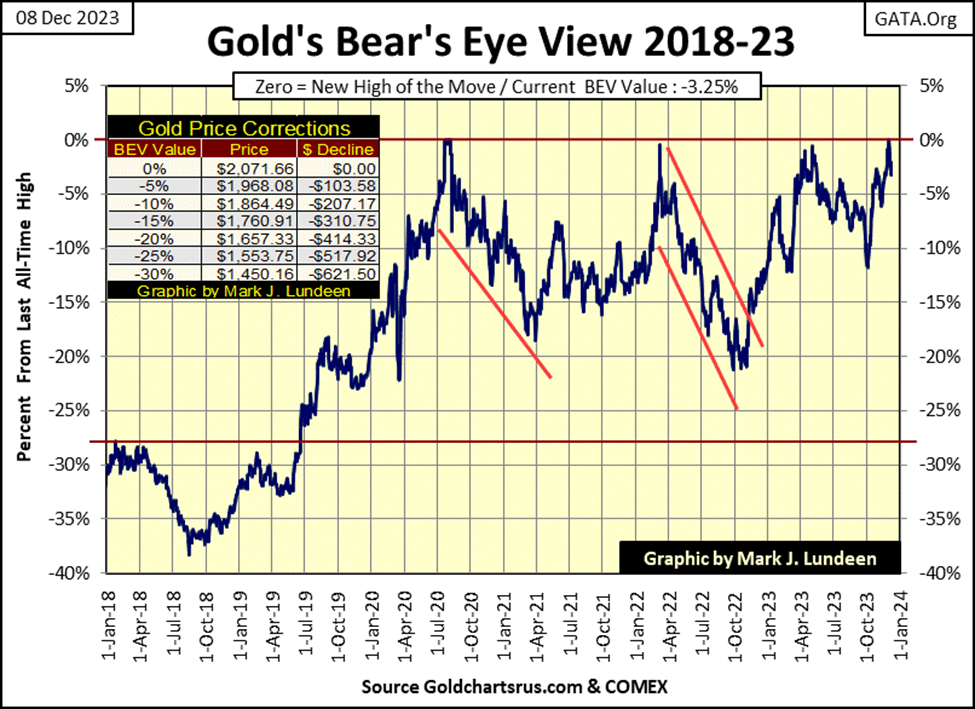
Get a grip on yourself Mark, the shoeboxes and cigars are coming! So, don’t talk yourself into a mental state of depression over the current sad state-of-affairs in the bull market in gold. Look at the chart below. A week ago, gold (Red Plot) broke over its 47.5 level of resistance, and that is an important technical achievement. Give gold a few weeks before you say something you may later regret.
That’s good advice. So, until gold takes out its 42.5 level on the downside, I’m going to remain optimistic on the prospects of much higher gold prices. Some things just take time. I’ll tell you something that would really cheer me up, seeing silver take out its 17.5 level in the chart below, that would be a major breakout of silver. It’s only a matter of time before silver does that, and more. But don’t be surprised if it takes some market chaos in the stock and bond markets before that happens.
Next to gold’s step-sum table below, last week gold became overbought when its 15-count increased to a +7. Markets don’t like being overbought, so a bit of a retreat in valuation in the gold market was to be expected. What I’m now watching for with gold, is how far of a sell off it is going to see?
Since last Friday’s all-time high (BEV Zero / 0.00%), gold has traded for five days, with three of those days down days, and two up days. But I notice gold went down more on the down days, that it went up on its daily advances. That isn’t good, but things may change next week.
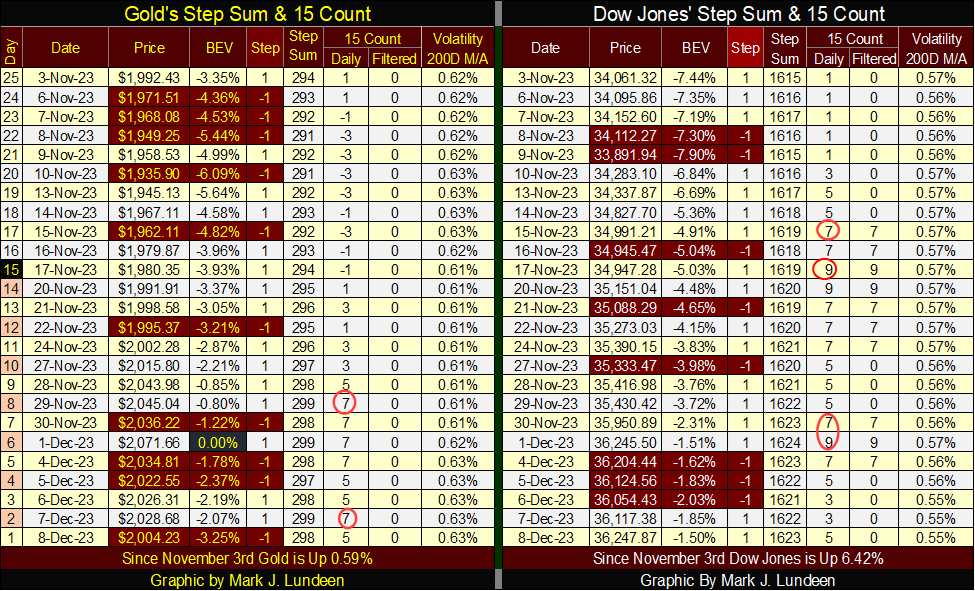
On the Dow Jones side of the table above, the Dow Jones has been an overbought market since it’s 15-count saw a +7 on November 15th. Two days later its 15-count moved up to a +9, making the Dow Jones a very overbought market. It then saw another +7 and +9 at the close of last week.
Technically, the Dow Jones is due for a correction. However, the same bulls that have failed to get the Dow Jones to close at a new all-time high, have been very successful in keeping the Dow Jones’ BEV values in scoring position (BEVs of -0.01% to -4.99%) since mid-November.
So, is the Dow Jones a buy? Looking over at the Dow Jones daily volatility’s 200D M/A, it closed the week at a 0.55%. As seen in the chart below, bull markets for the Dow Jones top with such low daily volatility values. So, no the Dow Jones (my proxy for the broad market) is not only * NOT * a buy, but a sell.
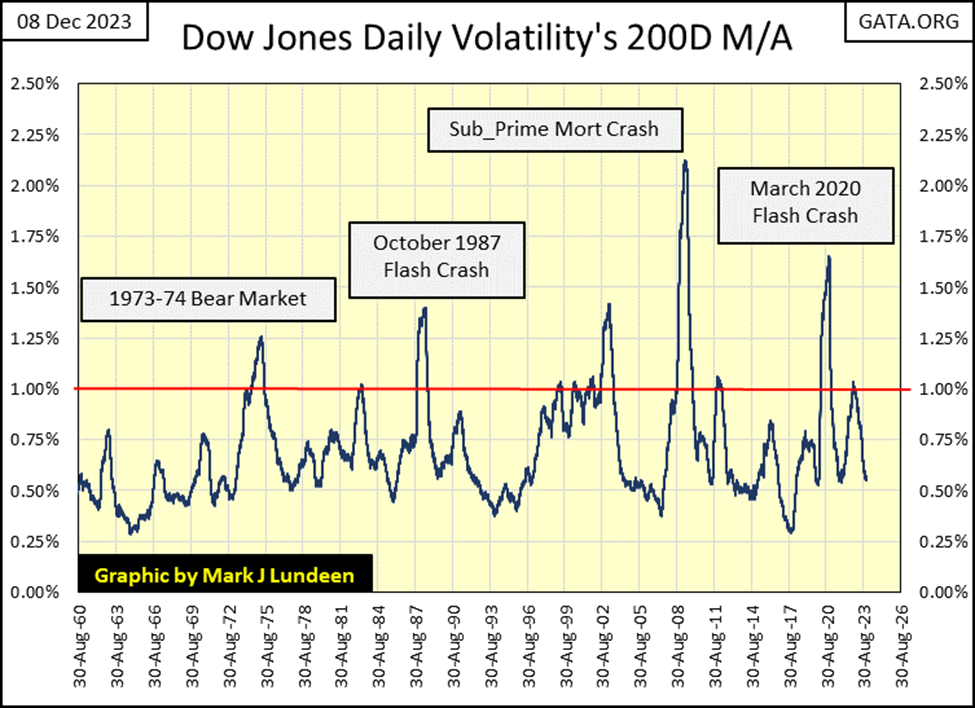
Do you want to make some money in the stock market? Then you must begin buying at market bottoms, not at market tops. Look at the daily volatility spikes in the chart above, each spike marked the bottom of a bear market, and buying at bear market bottoms is where the big money in the market is made.
In the chart above, seeing today’s Dow Jones daily volatility’s 200D M/A at 0.55%, marks this market as a market top. So, get out of the stock market, and stay out until once again daily volatility for the Dow Jones spikes, as it always does during a big-bear market decline. When this pending bear market spike in the 200D M/A peaks, and then begins declining towards the 1.00% line, the bottom is in, and the bull market is on. That is the time to jump into the stock market with both feet!
Being an old geezer myself; if I live long enough, that is what I plan to do. And until then; I’m going to grin-and-bear it with precious metal assets. That’s my plan, and I’m sticking to it.
__
(Featured image by rc.xyz NFT gallery via Unsplash)
DISCLAIMER: This article was written by a third party contributor and does not reflect the opinion of Born2Invest, its management, staff or its associates. Please review our disclaimer for more information.
This article may include forward-looking statements. These forward-looking statements generally are identified by the words “believe,” “project,” “estimate,” “become,” “plan,” “will,” and similar expressions. These forward-looking statements involve known and unknown risks as well as uncertainties, including those discussed in the following cautionary statements and elsewhere in this article and on this site. Although the Company may believe that its expectations are based on reasonable assumptions, the actual results that the Company may achieve may differ materially from any forward-looking statements, which reflect the opinions of the management of the Company only as of the date hereof. Additionally, please make sure to read these important disclosures.


TopRanked.io Weekly Affiliate Digest: What’s Hot in Affiliate Marketing [Changelly Affiliate Program]
It's official. TikTok is (potentially) dead. And, if you believe the news, that's gonna destroy thousands of small businesses and...


Terre et Lac Launches Crowdfunding for a Photovoltaic Power Plant
Terre et Lac, a Lyon-based company, launches a crowdfunding campaign for a solar plant in Voreppe. Residents of Isère and...


Qonto, Ledger, and Younited Credit, Leading Trio of the French Fintech Ecosystem
Qonto emerges as the top fintech in the latest rankings after its successful Series D funding. The 2024 Fintech 100...


Cannabis Clubs: Germany Introduces Strict Regulations
Germany introduces new regulations aimed at tightening control over cannabis clubs, following recent reforms. The Cannabis Act (CanG) allows limited...


Merck Invests Over 300 Million Euros in a New Research Center in Germany
Merck invests over 300 million euros in a new biotech research center in Germany, part of a larger 1.5 billion...
 |
|
 |  |
 |
|
-

 Markets2 weeks ago
Why Sugar Markets Closed Lower This Past Week
-

 Biotech4 days ago
PharmaMar Increases Profit by 64% in the First Quarter, Up To 2.3 Million
-

 Biotech1 week ago
Spending on R&D in Biotechnology Increased by 13% in 2022 and Reached 2.56 Billion
-
 Business2 days ago
TopRanked.io Weekly Affiliate Digest: What’s Hot in Affiliate Marketing [Changelly Affiliate Program]