Markets
Current Markets Rally Could Take Out the July 2023 and January 2022 Highs
Markets seemed to ignore a raft of weak economic numbers this past week and rallied. Bad news, or at least not great news, sparks a stock market rally suggesting the recent action may be nothing more than a short squeeze. A bear trap. The Fed most likely now will pause and that helped gold rise but sent oil prices tumbling. Warmer weather is also negatively impacting oil and gas. But will it last?

David Rosenberg, the founder of Rosenberg Research and author of the Daily Economic Report and Breakfast with Dave, is a well-known Canadian economist. His columns regularly appear in national newspapers. His recent article appeared in The Globe and Mail (Globe Investor) on November 16, 2023, titled, “This is how to invest as 2024 nears.” Mr. Rosenberg cites a number of things that we have also noted.
Mr. Rosenberg notes divergences between real gross domestic product and real gross domestic income, the employment household survey vs. the employment establishment survey, and ones we have noted such as the divergence between the S&P 500 and the S&P 500 Equal Weight Index. We have also noted divergences between the Dow Jones Industrials (DJI) and the Dow Jones Transportations (DJT), as well as divergences between large-cap stocks and small-cap stocks as measured by the Russell 1000 (large cap) and Russell 2000 (small-cap).
Last month’s nonfarm payrolls showed a slower rise in employment. But we also note that the number of full-time employment and part-time employment actually fell, even as nonfarm rose. The Civilian Labour Force also declined, along with the Employment Level. Those numbers could indicate weakness in the labor market, not strength, despite the rise in nonfarm. These differences are what make up the household survey vs. the establishment survey. For an explanation, see the Bureau of Labour Statistics (www.bls.gov). It is covered by the BLS at https://www.bls.gov/web/empsit/ces_cps_trends.htm. One thing we do see is that there are fewer people working and that helps raise the unemployment rate. U3 unemployment rose to 3.9% from 3.8%, U6 unemployment up to 7.2% from 7.0% and we have the Shadow Stats unemployment (U6 plus long-term unemployment over one year and discouraged workers defined out of the labor force) rose to 25.4% from 25.2%.
This past week’s initial claims report rose unexpectedly to 231,000 when they only expected 220,000 and the previous week’s 218,000. This could suggest that the November nonfarm payrolls may not be that rosy. Other potentially negative signs this week included the Philly Fed coming in at negative 5.9. This was better than the expected negative 9, but industrial production was negative 0.6% vs. last month’s gain of 0.1% and below expectations of negative 0.3%. As to the November nonfarm payrolls, early forecasts are for a rise of only 110,000 vs. October’s 150,000.
The big numbers out this past week were the CPI, the PPI, and retail sales. CPI came in flat for October and the year-over-year (y-o-y) gain was 3.2%. This was better than the forecast of a gain of 0.1% and 3.3% y-o-y. Core inflation came in as expected, up 4.0% y-o-y. Similarly, the PPI was down 0.5% vs. an expected gain of 0.1% and October’s gain of 0.4%. The y-o-y gain was 1.3%, below the expected gain of 2.3% and October’s gain of 2.2%. Retail sales for October were negative 0.1% and y-o-y was 2.5%. This was below October’s gains of 0.9% and 4.1%, respectively. This is not a good sign for Christmas sales.
CPI, Core CPI, Fed Funds, 10-year US Treasury, 2007–2023 (annual % Gain)
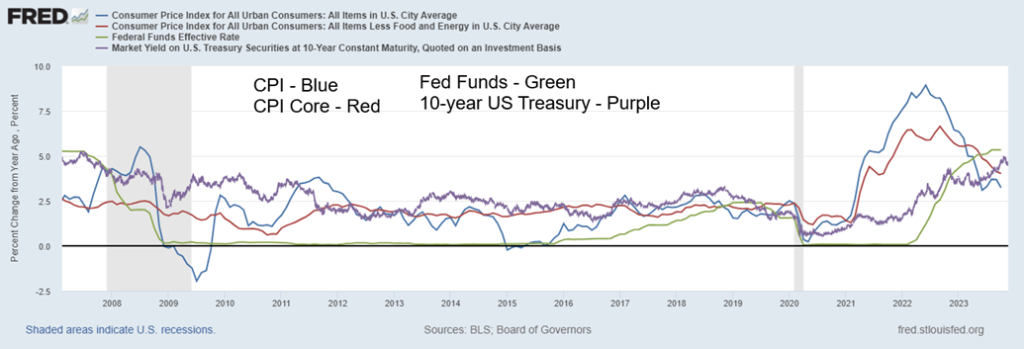
The lower-than-expected CPI numbers got the markets excited this past week. Add in weak manufacturing numbers, retail sales, weekly claims, and industrial production, and markets leaped. Bad news, it seems, is good for stocks and bonds. Stocks are up, bond yields are down, the US$ Index is down, gold is up, and oil is down. Happy days are here again. But could it also be a short squeeze as the market has been quite bearish recently? Now the market is expecting a soft landing, even no landing. And many are calling for the Fed to start cutting rates in 2024.
Hold on. This is seemingly ignoring China’s property collapse, a recessionary Germany, a stagnant U.K., and most likely weaker GDP numbers in the third quarter for both Japan and Canada. Add in monstrous debt levels, depleted savings, higher for longer interest rates, and the Fed effectively pulling away the punch bowl, all this suggests that the current growth numbers may not look so rosy a year from now. The Fed works in the rear-view mirror. They didn’t start hiking rates until it became established that inflation was rising. Coincidently, the first hikes were in March 2022 after the Russia/Ukraine war broke out. War is inflationary. Unless a Lehman Brothers-type collapse takes place, the odds of the Fed starting to cut rates in 2024 are slim to none.
GDP Annual Growth Rate G7 plus China
| Country | GDP Annual Growth Rate % | Latest Quarter | Central Bank Interest Rate % | Inflation Rate % |
| U.S. | 2.9 (Sep) | 3 | 5.5 | 3.2 (Oct) |
| Euro area | 0.1 (Sep) | 3 | 4.5 | 2.9 (Oct) |
| China | 4.9 (Sep) | 3 | 3.45 | -0.2 (Oct) |
| Germany | -0.1 (Sep) | 3 | 4.5 | 3.8 (Oct) |
| U.K. | 0.6 (Sep) | 3 | 5.25 | 4.6 (Oct) |
| France | 0.7 (Sep) | 3 | 4.5 | 4.0 (Oct) |
| Italy | 0.04 (Sep) | 3 | 4.5 | 1.7 (Oct) |
| Japan | 1.6 (Jun) | 2 | -0.1 | 3.0 (Sep) |
| Canada | 1.1 (Jun) | 2 | 5 | 3.8 (Sep) |
Our extensive chart on the next page looks at all the recessions since 1948. There have been 12 recessions since 1948. The longest was the Great Recession of 2007–2009, while the steepest in terms of unemployment was the pandemic recession. The pandemic recession also saw the steepest decline in GDP and the steepest drop in the stock market. We labeled eight of them a soft landing, not because they were necessarily soft, but because all of them lasted less than one year.
The remaining four—1973–1975, 1981–1982, 2007–2009, and 2020—we labeled as hard landings because of their length, the steepness of the decline, the high unemployment rate, and the decline in the stock market. The 2020 pandemic recession may have been short, but it was the steepest in terms of unemployment and the decline of GDP. As to stock market declines, the 2007–2009 recession was the easy winner.
Soft landings were generally the cry before every recession. Is this time different? Probably not. We have two wars being waged that could still morph into something bigger. World trade is contracting. The population is getting older. Years of ultra-low interest rates and trillions in stimuli are gone. That in turn created bubbles that are now being burst, particularly as we are now seeing the slow unraveling of the housing market and commercial real estate. Debt levels are simply too high, and the ability to add more debt is falling, along with falling savings.
Yes, delinquencies are still low, but they are rising, along with bankruptcies. Here in Canada, bankruptcies are being exemplified by the collapse of Bad Boy, an iconic 70-year-old warehouse furniture store owned by a former mayor of Toronto. In the U.S., five banks collapsed in 2023 and there are at least 11 more that have negative outlooks. However, we don’t have our Lehman Brothers moment. Or maybe it is just not yet. Nobody warned that Lehman Brothers was going to fall.
Combine all this, and the ability of the Fed and other central banks could be limited in their ability to restimulate economies. War and supply disruptions are playing havoc with commodity prices as shortages develop, and as the West has found out, many of the commodities they need are in countries they are effectively at war with, such as Russia and China.
U.S. Recessions 1949–2023
| Recession | Period | Duration (months) | Peak unemployment % | GDP decline peak to trough % | Stock market (DJI) % | Hard or soft landing |
| 1949 | Nov 48–Oct 49 | 11 | 7.9 | -1.7 | 0.7 | S |
| 1953 | Jul 53–May 54 | 10 | 6.1 | -2.6 | 22.1 | S |
| 1958 | Aug 57–Apr 58 | 8 | 7.5 | -3.7 | -10.4 | S |
| 1960–1961 | Apr 60–Feb 61 | 10 | 7.1 | -1.6 | 7.5 | S |
| 1969–1970 | Dec 69–Nov 70 | 11 | 6.1 | -0.6 | -2.2 | S |
| 1973–1975 | Nov 73–Mar 75 | 16 | 9.0 | -3.2 | -19.7 | H |
| 1980 | Jan 80–July 80 | 6 | 7.8 | -2.2 | 11.5 | S |
| 1981–1982 | Jul 81–Nov 82 | 16 | 10.8 | -2.7 | 6.4 | H |
| 1990–1991 | Jul 90–Mar 91 | 8 | 7.8 | -1.4 | 1.2 | S |
| 2001 | Mar 01–Nov 01 | 8 | 6.3 | -0.3 | -0.2 | S |
| 2007–2009 | Dec 07–Jun 09 | 18 | 10.0 | -5.1 | -36.8 | H |
| 2020 | Feb 20–Apr 20 | 2 | 14.7 | -19.2 | -13.8 | H |
| Average soft landings | 9 | 7.1 | -1.8 | 3.8 | ||
| Average hard landings | 13 | 11.1 | -7.6 | -16.0 | ||
| Average all | 10.3 | 8.4 | -3.7 | -2.8 |
Everything looks rosy right now. We could call it the Goldilocks economy. All we can think of is we are rallying and we haven’t even had the recession. The inverted yield curve is still pointing to a recession, most likely in 2024. That, along with a potentially contentious election and against the backdrop of wars could still expand. Hence our suggestion that the stock market rally may be a short squeeze, a bear trap.
We have easing inflation and the probability that the Fed is finished hiking. But will they cut, as many are already predicting for 2024? U.S. Treasury bonds and notes are rallying, even as the treasury has trouble raising all their funds at auctions and foreign buyers are not buying. The Fed most likely won’t cut unless there is clear evidence of a slowdown or we suddenly have a raft of high-profile bankruptcies that could lead to a Lehman Brothers moment.
The Fed is reactive, not proactive. In 2008 they cut rates after Lehman Brothers collapsed. Not before. Yes, there are signs of a slowdown. Christmas sales are expected to be down. Walmart has warned of challenging times ahead. If that’s what Walmart is predicting a slowdown, what does that say about the rest?
We have a weakening labor market, falling retail sales, rising delinquencies, growing stress in the housing market, rising bankruptcies, and yet the stock market goes up. No, the markets have not hit seriously overbought territory. We could see new highs above the July 2023 high. We could even see new highs above the January 2022 high. But we suspect that not everyone will be making new highs.
The Fear and Greed Index is mildly greedy. The CBOE put/call ratio is falling but is not yet in overbought territory as we note it was throughout much of 2020 and 2021. It is not unusual to have what we call bear hooks—meaning, a rebound in the stock markets is underway against an array of bad news. It brings everyone back to believing that the worst is over and it is now time to buy, buy, buy.
Then something happens and reality sets in. We saw that during the 1929–1932 bear, the 1937–1942 bear, the 1972–1974 bear, the 2001–2002 bear, and especially during the 2007–2009 bear. We are closing in on two years since the last stock market high. Bear markets have a habit of lasting upwards of three years. Events like stock market crashes, such as we saw in 1987 and in 2020, are just that—one-off crashes that soon recover.
We conclude with our chart of the CBOE put/call ratio on the next page. The S&P 500 and S&P 500 Equal Weight are below. While the S&P 500 is closing in on the July 2023 high, the S&P 500 Equal Weight remains some distance away. As we noted, we are seeing the same thing with the Dow Jones Industrials (DJI) and the Dow Jones Transportations (DJT), along with the Russell 1000 vs. the Russell 2000. Divergences, markets quickly getting greedy once again for seemingly no reason. These are all ingredients for this rally to end in tears—and not tears of joy.
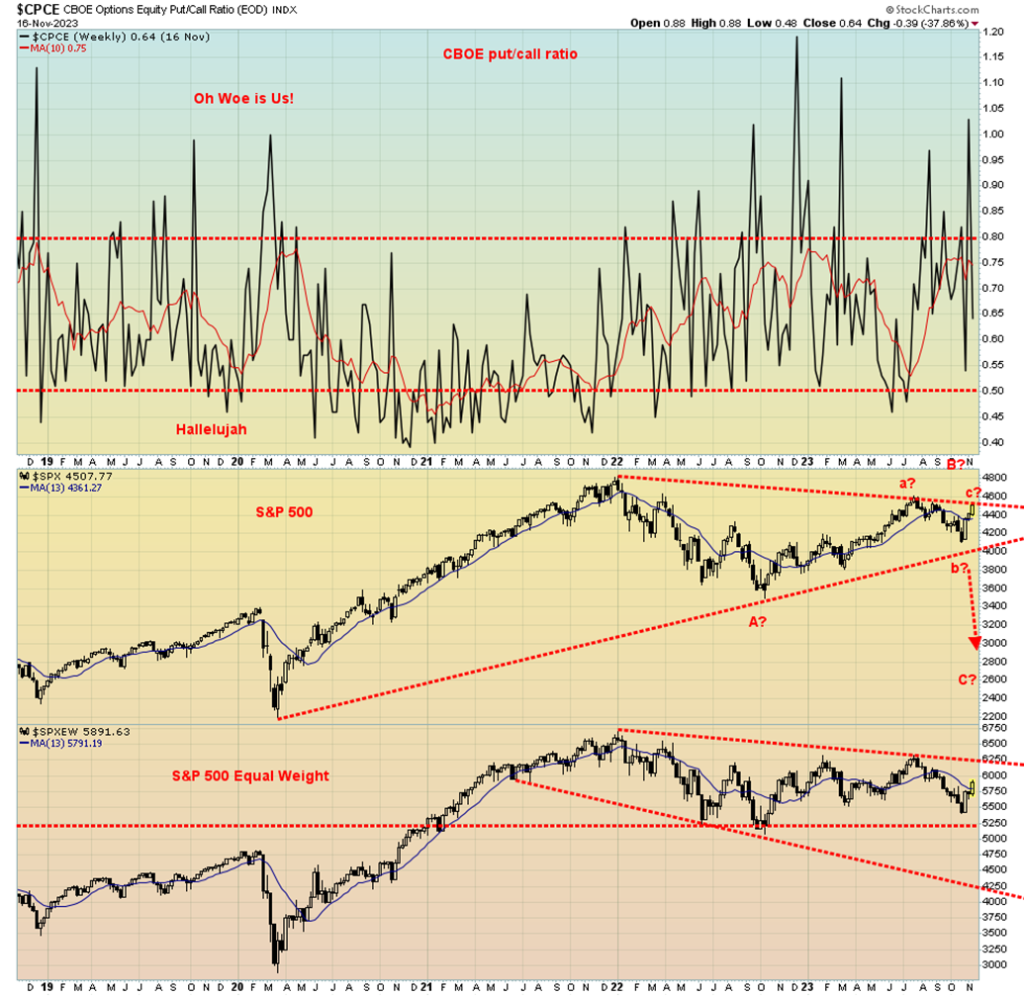
Chart of the Week
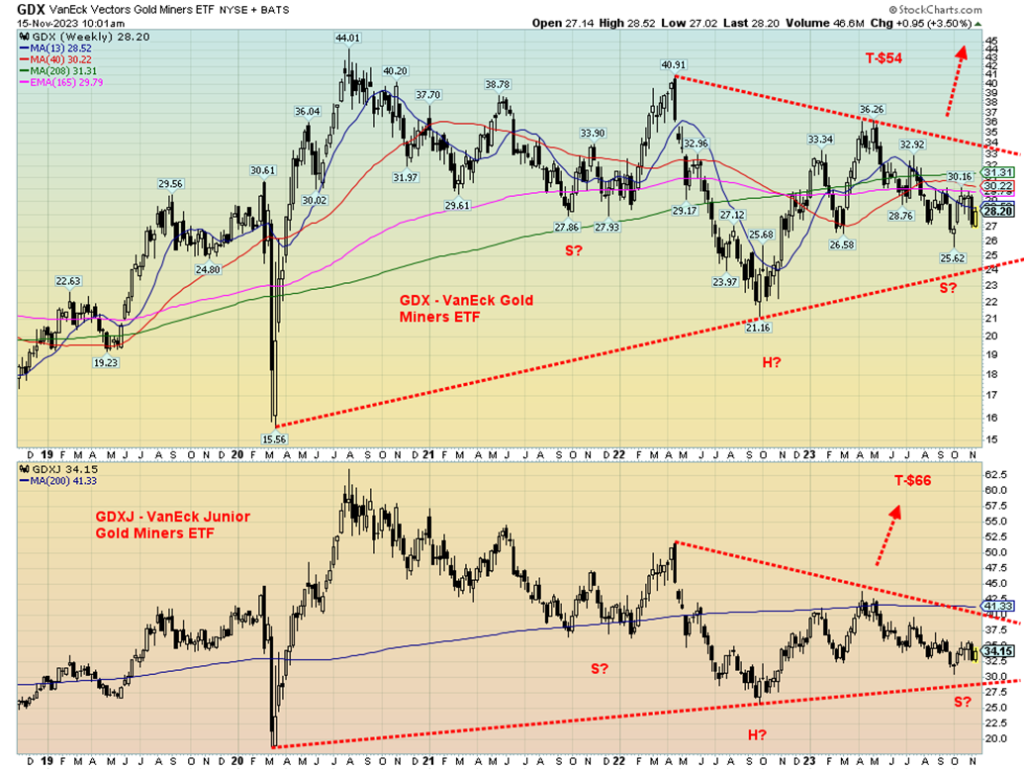
There are some potentially compelling technical patterns forming on the GDX (VanEck Gold Miners ETF) and the GDXJ (VanEck Junior Gold Miners ETF). Is that a potential continuation head and shoulders reversal pattern forming? This is by no means a perfect pattern. Our only real complaint is that the low of the right shoulder is below the low of the left shoulder. Usually, it is the other way around. Nonetheless, both have downward-sloping necklines, which is normal. We can only call it a potential continuation head and shoulders pattern because to confirm it we must break out over the neckline with volume.
We also need to leave the low of the right shoulder intact. In this case, GDX’s neckline is near $34, and for the GDXJ it is near $40. The right shoulder low for GDX that must hold is at $25.62, while for the GDXJ the right shoulder low that must hold is at $30.46. Breakdowns are lower. For GDX, it breaks down under $24 and for the GDXJ it breaks down under $29.
As to targets if the breakout of the neckline is successful the GDX projects up to $54 and the GDXJ up to $66 from current levels of $28.20 for the GDX and $34.15 for the GDXJ.
So, what is in the GDX and GDXJ? Both ETFs are managed by VanEck, a global investment manager with offices around the world. They have ETFs in numerous categories including equity, emerging markets, commodities, fixed income, and gold mining. GDX holds senior gold miners with some 56 diverse holdings from countries around the world including the U.S., Canada, Australia, China, South Africa, and more. GDXJ holds some 98 junior gold miners, also from numerous countries around the world.
Some key holdings of GDX include Newmont Mining (NEM), Barrick Gold (GOLD), and Franco Nevada (FNV). Some key holdings of GDXJ include Pan American Silver (PAAS), Kinross Gold (K), B2Gold (BTO), Alamos Gold (AGI), and Lundin Gold (LUG). They are weighted. By weight, the largest in GDX is Newmont Mining, representing about 9%, while Kinross Gold is the largest in GDXJ, representing 7.25%.
The GDX Gold ratio is about as low as it has ever been. Today, the GDX/Gold ratio is only 1.4. At its highs back in 2006 when GDX commenced, the GDX/Gold ratio was roughly 4.8. The same story holds for GDXJ. Today, the GDXJ/Gold ratio is 1.7, whereas back in 2010 the GDXJ/Gold ratio hit a high of 9.5. GDX and GDXJ are cheap compared to gold. The same holds for the Gold/HUI ratio or the Gold/TSX Gold Index (TGD) ratio. This is just another way of stating it.
The Gold Miners Bullish Percent Index (BPGDM) is currently 25.0%, which is still pretty low. That is still in oversold territory. Overbought has readings above 75%. BPGDM was 0 at the 2015 low and at the March 2002 pandemic low it was 7.7%. The only time we’ve seen the BPGDM at 100% was at the August 2020 top. It hit 93.3% at the September 2011 top. The most recent high was 75.9% hit in April 2023. In October 2022, BPGDM hit a low of 3.5%. The tool is useful for pinpointing potential tops and bottoms.
With gold and gold stocks entering their seasonal strength period, the accumulation of GDX and GDXJ appears prudent. However, remember these are potential targets and only if we break the neckline points, as we have noted.
Markets & Trends
| % Gains (Losses) Trends | ||||||||
| Close Dec 31/22 | Close Nov 17, 2023 | Week | YTD | Daily (Short Term) | Weekly (Intermediate) | Monthly (Long Term) | ||
| Stock Market Indices | ||||||||
| S&P 500 | 3,839.50 | 4,514.02 | 2.2% | 17.6% | up | up | up | |
| Dow Jones Industrials | 33,147.25 | 34,947.28 | 1.9% | 5.4% | up | up | up | |
| Dow Jones Transport | 13,391.91 | 14,932.30 | 3.5% | 11.5% | up | neutral | neutral | |
| NASDAQ | 10,466.48 | 14,125.48 | 2.4% | 35.0% | up | up | up (weak) | |
| S&P/TSX Composite | 19,384.92 | 20,175.77 | 2.7% | 4.1% | up | neutral | neutral | |
| S&P/TSX Venture (CDNX) | 570.27 | 530.50 | 4.0% | (7.0)% | neutral | down | down | |
| S&P 600 (small) | 1,157.53 | 1,171.16 | 5.1% | 1.2% | up | down (weak) | down | |
| MSCI World | 1,977.74 | 2,104.54 | 2.6% | 6.4% | up | down (weak) | down | |
| Bitcoin | 16,531.31 | 36,388.09 | (2.3)% | 120.1% | up | up | neutral | |
| Gold Mining Stock Indices | ||||||||
| Gold Bugs Index (HUI) | 229.75 | 218.79 | 4.3% | (4.8)% | up (weak) | down | down | |
| TSX Gold Index (TGD) | 277.68 | 267.47 | 3.3% | (3.7)% | neutral | down | down | |
| % | ||||||||
| U.S. 10-Year Treasury Bond yield | 3.88% | 4.44% | (3.9)% | 14.4% | ||||
| Cdn. 10-Year Bond CGB yield | 3.29% | 3.68% | (4.2)% | 11.9% | ||||
| Recession Watch Spreads | ||||||||
| U.S. 2-year 10-year Treasury spread | (0.55)% | (0.46)% | (7.0)% | (16.4)% | ||||
| Cdn 2-year 10-year CGB spread | (0.76)% | (0.79)% | (6.8)% | (4.0)% | ||||
| Currencies | ||||||||
| US$ Index | 103.27 | 103.79 | (1.9)% | 0.5% | down | up (weak) | up | |
| Canadian $ | 73.92 | 72.92 | 0.7% | (1.4)% | up | down | down | |
| Euro | 107.04 | 109.08 | 2.1% | 1.9% | up | neutral | down | |
| Swiss Franc | 108.15 | 112.85 | 1.8% | 4.4% | up | up (weak) | up | |
| British Pound | 120.96 | 124.62 | 2.0% | 3.0% | up | neutral | neutral | |
| Japanese Yen | 76.27 | 66.80 | 1.2% | (12.4)% | up (weak) | down | down | |
| Precious Metals | ||||||||
| Gold | 1,826.20 | 1,984.70 | 2.4% | 8.7% | up | up (weak) | up | |
| Silver | 24.04 | 23.85 | 7.1% | (0.8)% | down (weak) | neutral | down (weak) | |
| Platinum | 1,082.90 | 901.70 | 6.6% | (16.7)% | neutral | down | down | |
| Base Metals | ||||||||
| Palladium | 1,798.00 | 1,058.90 | 8.2% | (41.1)% | down | down | down | |
| Copper | 3.81 | 3.74 | 4.3% | (1.8)% | up | down | down | |
| Energy | ||||||||
| WTI Oil | 80.26 | 76.04 | (1.5)% | (5.3)% | down | down (weak) | neutral | |
| Nat Gas | 4.48 | 2.96 | (2.3)% | (33.9)% | down | up | down (weak) | |
New highs/lows refer to new 52-week highs/lows and, in some cases, all-time highs.
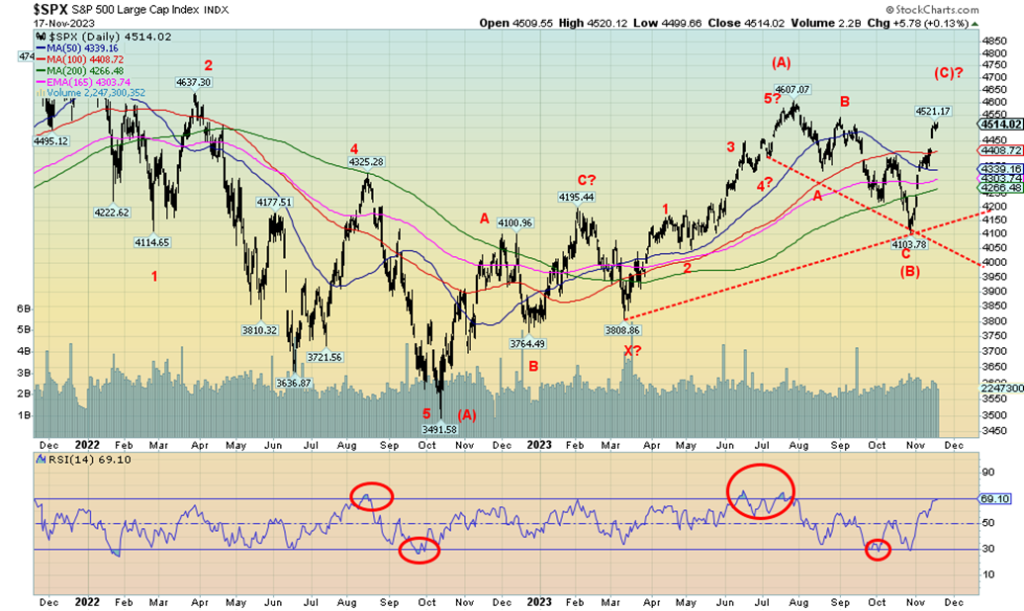
The rally continues. It continues so well that the S&P 500 (SPX) gapped higher this past week. The gap is between 4,459 and 4,421. If that gap is filled, then the odds are we have topped. The SPX RSI is at 69, approaching overbought levels. This could be our C wave higher from the bottom seen in October 2022. Our A wave topped in July 2023 at 4,607 while the B wave recently bottomed in October 2023 at 4,104.
On the week, the SPX gained 2.2%, the Dow Jones Industrials (DJI) was up 1.9%, the Dow Jones Transportations (DJT) gained 3.5%, while the NASDAQ was up 2.4%. While the DJT narrowed the gap with the DJI, it was not enough for us to declare that the potential divergence between the two is over. The S&P 400 (Mid) gained 4.0% while the S&P 600 (Small) was up 5.1%. The market appears to be broadening.
That is something that will get the bulls excited as all need to participate in the rally and the preference is that the Mid and Small caps lead the way. But that was only one week. The NY FANG Index was up 2.4% while the S&P 500 Equal Weight gained 3.2%. Again, that is against the grain of the divergence between the SPX and the SPXEW. Another sign the market is broadening. Despite the rise, the SPXEW remains well below its previous high even as the SPX is not far from its high.
In Canada, the TSX was up 2.7% while the TSX Venture Exchange (CDNX) gained 4.0%. In the EU, the London FTSE was up about 2.0%, the EuroNext gained 2.3%, the Paris CAC 40 was up 2.7%, and the German DAX gained 4.5%. Is Germany coming back? In Asia, China’s Shanghai Index (SSEC) was up 0.5%, the Tokyo Nikkei
Dow (TKN) gained 1.9%, while Hong Kong’s Hang Seng (HSI) gained 1.5%. The global MSCI World Index was up 2.6%.
We are on a mission to go higher. However, we continue to see this as the final wave up of a large corrective wave to the down move in 2022 when the SPX lost 21% in that decline, putting it in bear territory. As we have noted this may just be a short squeeze, a bear trap. SPX fell in five waves from January 2022 to its low in October 2022. This indicated to us that this is a primary wave to the downside.
The subsequent recovery hasn’t disappointed, as it appears to be unfolding in a classic ABC pattern. The larger A and B waves are complete. We are working on the C wave that admittedly could take us to new highs above the July 2023 top and even above the January 2022 top of 4,818. We have recouped enough to suggest that new all-time highs are a possibility. First, we need to take out that July 2023 high of 4,607.
Filling the aforementioned gap would be the first sign of trouble. A break under 4,340 would be negative and under 4,260 we could be entering a new bear. A firm break of 4,150 could set us on the path to new lows. In the interim, the trend is up but we are approaching overbought. The Fear and Greed Index is greedy. So, caution is advised from here in adding to new positions. Although that could be sector-selective. Many commodities (gold, metals, energy, etc.) still look cheap here.
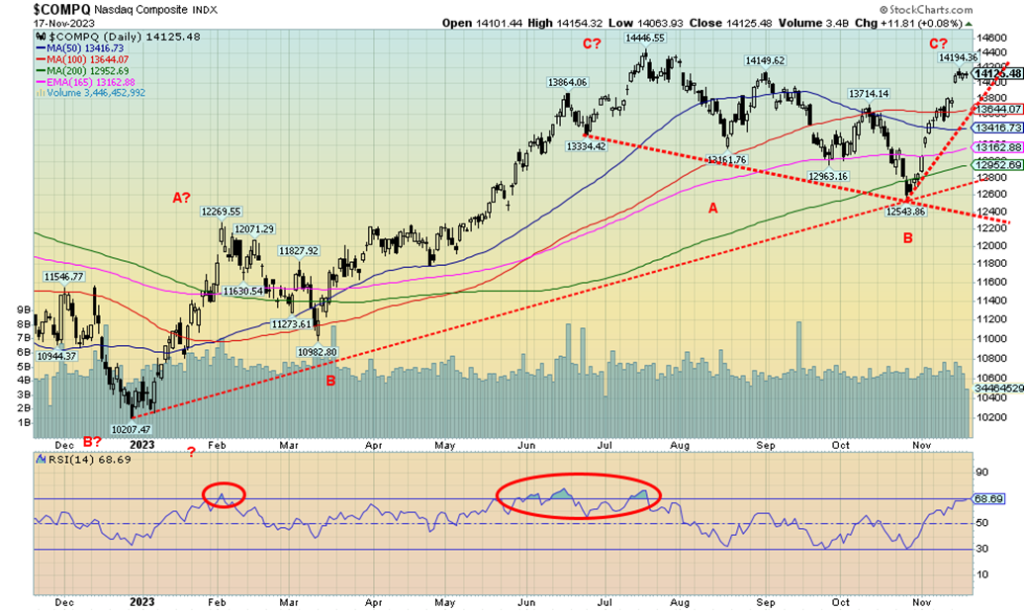
Thanks once again to surging FAANGs, the NASDAQ rose 2.4% this past week. The NY FANG Index was up 2.4% which was a surprise, given that three FAANGs made fresh 52-week highs. They were Meta (Facebook), Amazon, and, Microsoft. Two of the biggies posted gains, but they were not impressive. Apple gained 0.7% and Amazon was up 1.1%. The big winner was Tesla, up 9.1%. But will that hold, given controversies from Elon Musk and a failed launch of SpaceX and advertisers fleeing X (formerly Twitter)? Alibaba was the big loser, down 6.2% and the only loser. The NASDAQ has cleared above the 200-day MA and is now threatening the July high of 14,446.
We are also approaching overbought on the RSI as it closed at 68.6. Over 70 is considered overbought. We’ve gained 12.6% in a hurry and we are now only 2.2% below the July high. Our uptrend appears to have support at 13,640. Under there, we could fall to 12,950 and still maintain an uptrend. Like the S&P 500, we believe this is a C wave up. New highs above July are possible and new highs above the November 2021 high of 16,212 are possible. However, we have no evidence yet that this could happen. Above 14,800, the odds increase that the November 2021 high could fall. Note we gapped higher this past week, leaving a gap between 14,000 and 13,800. If that gap is filled, then the odds favor that we have topped.
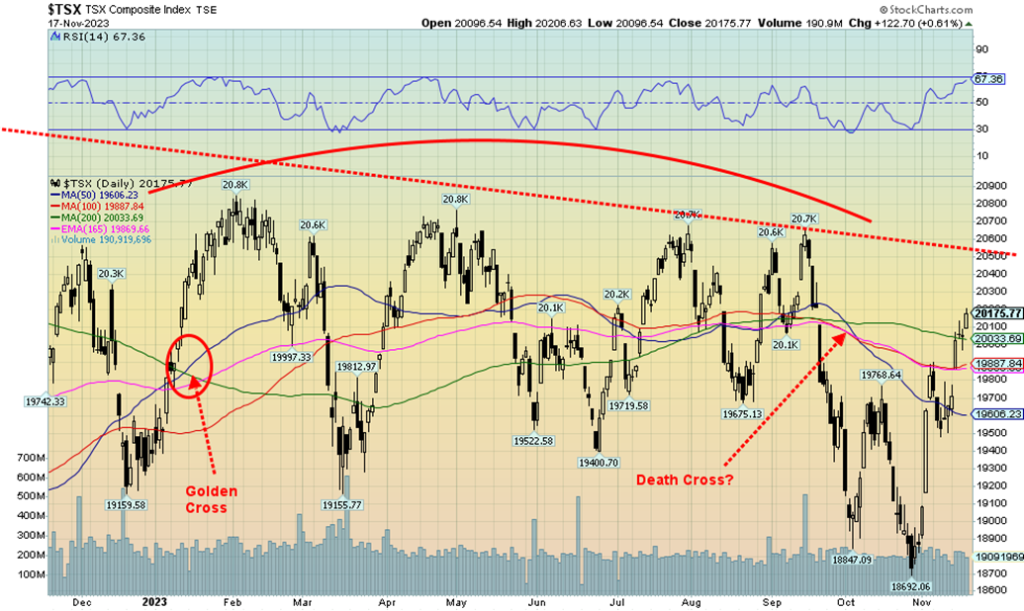
The TSX Composite joined the market up party this past week, gaining 2.7% and suggesting that 2023 could be a positive year. Thus far, the TSX is up 4.1% on the year. Even the much-maligned TSX Venture Exchange (CDNX) gained on the week, up 4.0%, but remains down in 2023 by 7.0%. We leaped over the 200-day MA this past week and now the solid line that has kept the TSX in check throughout 2023 looms above at 20,500. Could we break it? Or will this once again prove to be the failure zone? We’ve had four or five attempts at taking that line out this past year. Will the next one be successful?
Of the 14 sub-indices, only one, the Consumer Staples (TCS) fell on the week. TCS lost 1.7%. If the fear of a recession eases, we can only guess that holding staples fades. Leading the upward charge was Information Technology (TKK), up 5.1%, and making fresh 52-week highs. That’s the first one in some time to do that. Other good gains were seen for Income Trusts (TCM), thanks to lower interest rates as it rose 3.9%, Golds (TGD) was up 3.3%, Metals & Mining (TGM) gained 4.2%, Health Care (THC) was up 3.8%, Real Estate (TRE) was up 3.0%, and Utilities (TUT) gained 3.6%. TRE and TUT gained as they are interest rate sensitive, just like TCM.
All in all, a good week for the TSX. Only a breakdown now under 19,500 could end this. Meanwhile, 20,500 looms above and major resistance.
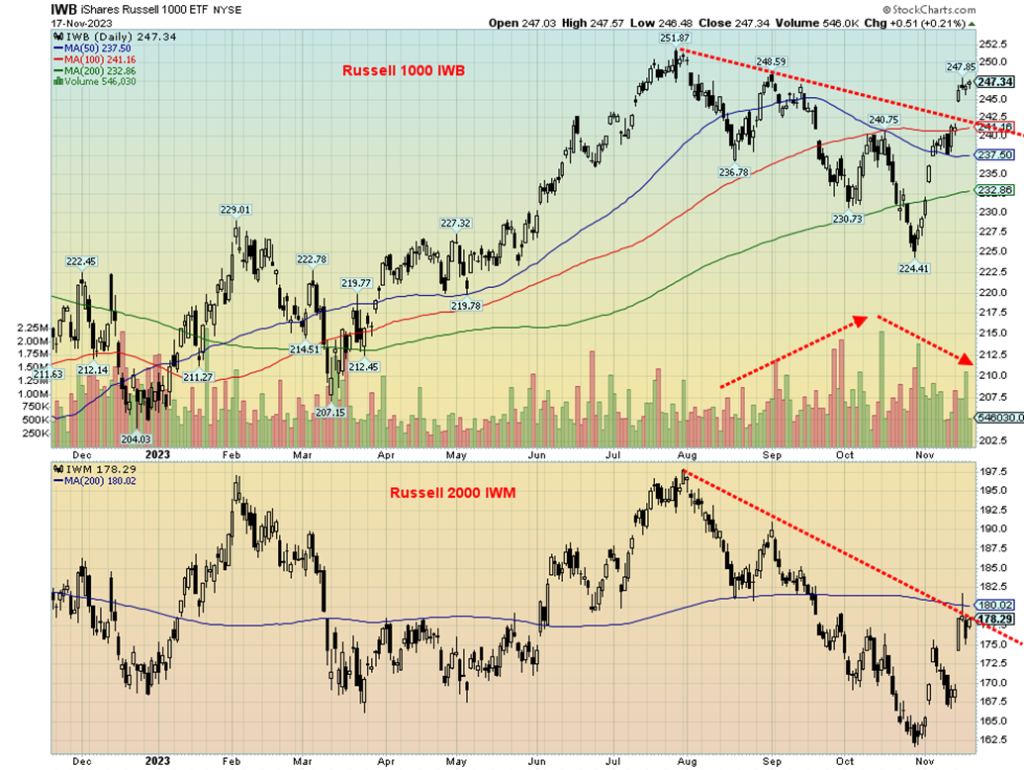
As we have noted, the iShares Russell 1000 ETF (IWB) (large cap) is diverging with the iShares Russell 2000 ETF (IWM) (small cap). The IWB has burst above its 200-day MA and is 10.2% above its recent October low. The IWM, on the other hand, has been unable to break above its 200-day MA, even as it is also 10.2% above its recent October low. But IWM remains 9.9% below its July high while the IWB is only 1.8% below its July high. The IWM is threatening to make new highs and could even make new all-time highs.
IWB is 5% below its all-time high set back in January 2022. The IWM, on the other hand, is 25% below its all-time high set in November 2021. These are significant divergences between the two and signal that all may not be well. Note as well that the volume on the IWB has fallen off even as it moves higher. Where’s the beef? Oddly, volume has picked up for the IWM as there is a rush back into small caps. Nonetheless, the two remain diverged and that is another sign that, yes, we are rallying but all is not well.
U.S. 10-year Treasury Bond/Canadian 10-year Government Bond (CGB)
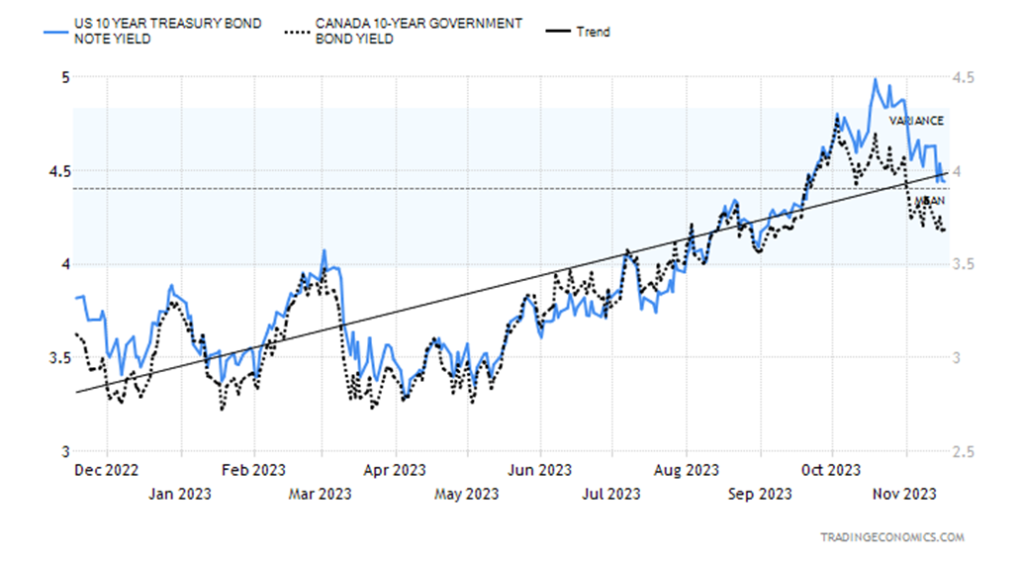
Bond yields fell once again this past week, thanks to a raft of weaker than expected economic numbers, especially because of the falling inflation numbers. As we have noted, many now believe the Fed could pause and many are even expressing thoughts that the Fed will cut rates in 2024. But we note as well the Fed tends to be reactive, not proactive. They may be poised to be disappointed. Many now believe the 10-year has topped (yield, prices bottom as prices move inversely to yields). The Canadian 10-year Government of Canada bond (CGB) also fell this past week to 3.68% from 3.84%. But the inverted yield curve widened once again. The U.S. 2–10 curve widened to 46 bp from 43 bp and the Canadian 2–10 widened to 79 bp from 74 bp.
All this points to the recession still being on. Since markets started watching the yield curve closely in the 1970s, there has been no period where there has not been a recession following a period of an inverted yield curve. And because this one was so inverted for such an extended period, it means the coming recession could be a hard landing, not the soft landing and even the “no landing” many are now purporting. However, bond analysts believe that the best part of the move is over and any declines from here could be more gradual. The 5% level for the 10-year proved to be a strong psychological level. With U.S. bond yields falling while other countries (EU) remain elevated, the shift is on from U.S. dollars to euros. No wonder the euro currencies rose this past week.
Given the weaker-than-expected CPI, weaker-than-expected retail sales, industrial production plus others pointing to a slowdown, the US$ Index cracked this past week, falling 1.9%. But the EU as the savior? The euro rose 2.1%, the Swiss franc was up 1.8%, the pound sterling was up 2.0%, and the Japanese yen gained 1.2%. Yes, even the put-upon Japanese yen rose. The Canadian dollar was the weakest, rising only 0.7%, largely because oil prices took another hit.
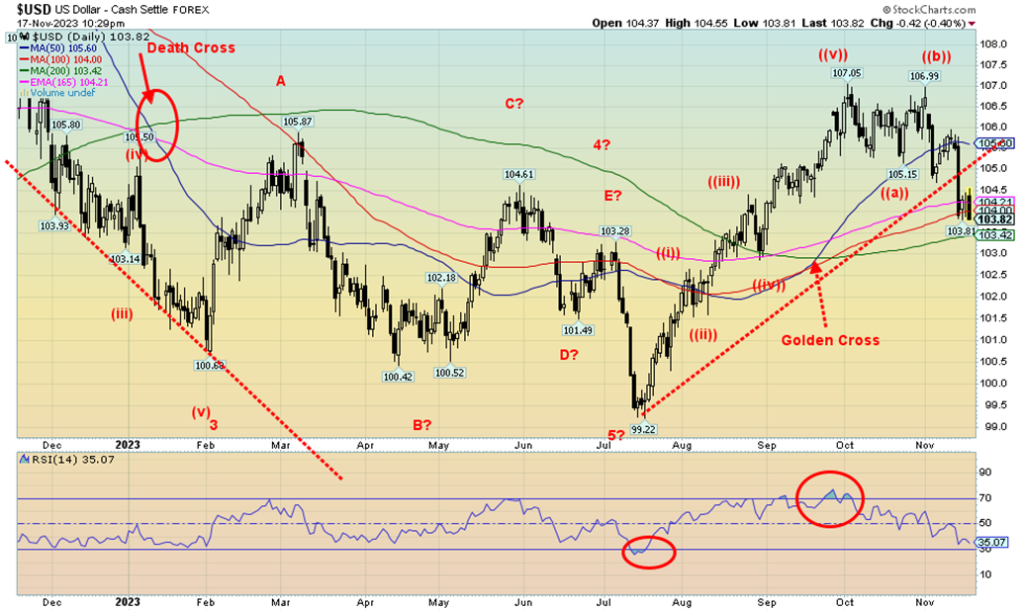
What the drop this past week does confirm for us is the US$ Index has most likely topped. But a more serious breakdown awaits. That could happen under 103. Potential downside targets currently are 103.25, but if that breaks, the next target could be 102.0. The U.S. is threatened with a very contentious 2024 election. Another speaker could soon be ousted as uncertainty would reign with the U.S. government. As well, the Israeli/Gaza war is becoming contentious with clashes taking place not just in the U.S. but the EU and Canada as well, as the supporters of either side become entrenched. The daily (short-term) trend has turned down and the weekly (intermediate) uptrend is weakening.
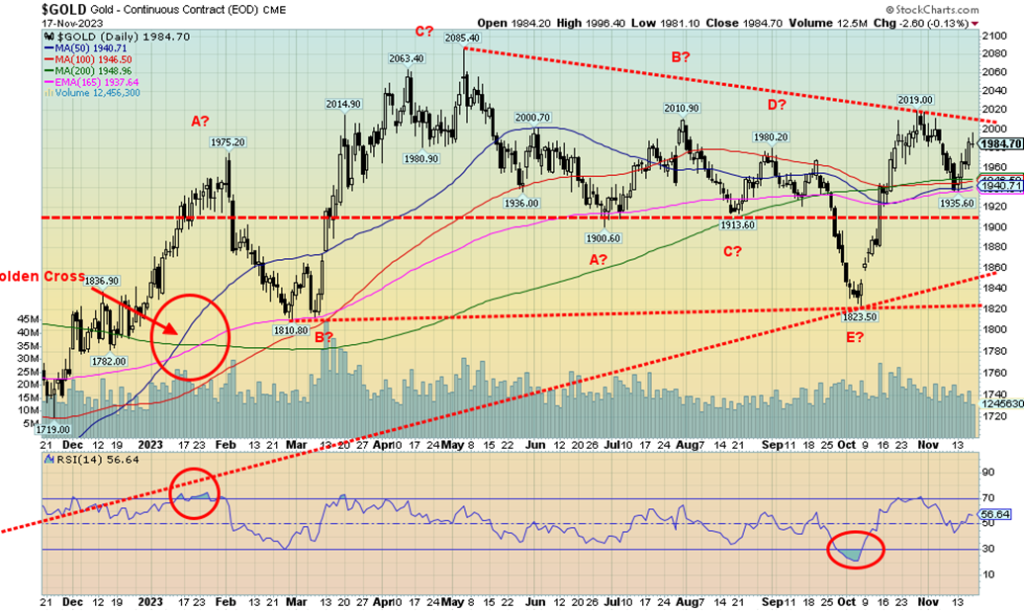
Gold put in an excellent week as it gained 2.4%. Silver did even better, up 7.1%. Other precious metals bounced back after hitting new lows the previous week. Platinum gained 6.6% while palladium was up 8.2%. Copper gained 4.3%. Were they all up in sympathy with the stock market or because of thoughts of a slowing economy and that the Fed is poised to pause? Or were they up because of thoughts of rate cuts in 2024 and a lower CPI? Maybe all of the above. Or is it just because gold is a safe haven as the wars rage in Russia/Ukraine and particularly the contentious Israel/Gaza war.
Gold took out one resistance level at $1,975/$1,980 this past week, but an even more important one at $2,000/$2,020 looms. Once over $2,020, the odds increase that we’ll once again challenge the highs up to $2,089. As we have noted, a number of times triple tops are extremely rare and odds favour a breakout above $2,100. The question is, will it happen in 2023 or do we have to wait for 2024? Either way, we should break it. Our targets then would be up to $2,400/$2,500. Buyers would most likely start to come in above $2,100. Given the gold market is small, no wonder some have described it like trying to push the water behind the Hoover Dam through a garden hose. The move could be explosive. But as we’ve often said, we can now only anticipate by accumulating, awaiting the move.
Could we be wrong? A break below that E wave $1,823 would be a drop-dead stop zone. However, we’d consider a drop under $1,900 to be negative.
An article on CNBC quotes hedge fund manager Ray Dalio of Bridgewater Associates as being very concerned about the rising debt levels of the U.S. government. With yearly interest payments approaching $1 trillion annually, threats of further debt downgrades, blockages in Congress that could spark a government shutdown, sloppy treasury auctions, and foreign buyers reluctant to buy U.S. treasuries, this contains all the ingredients for a disaster. Yet bond yields have recently improved. While U.S. government debt is a problem, bigger problems lie with corporate and consumer debt as both are at record levels.
In September, U.S. treasury numbers show that foreign buyers shed some $102 billion. That’s not good when the U.S. treasury needs all the buyers they can find. Japan fell $28.5 billion in September and China, which has been diligently dumping U.S. treasuries, saw its holdings fall another $27.3 billion. So, who is supporting the U.S. treasury market when auctions are sloppy and foreign holders are dumping? All this is potentially positive for gold. We keep hearing rumors that China will back the yuan with gold. That in turn could strengthen the yuan and the U.S. dollar falls.
We no longer believe will the gold market break out, but when will it break out? This year? Or next year? But it will break out. All signs are pointed that way. We suspect our long-term cycle lows of 7.83 years and 23.5 years is in.
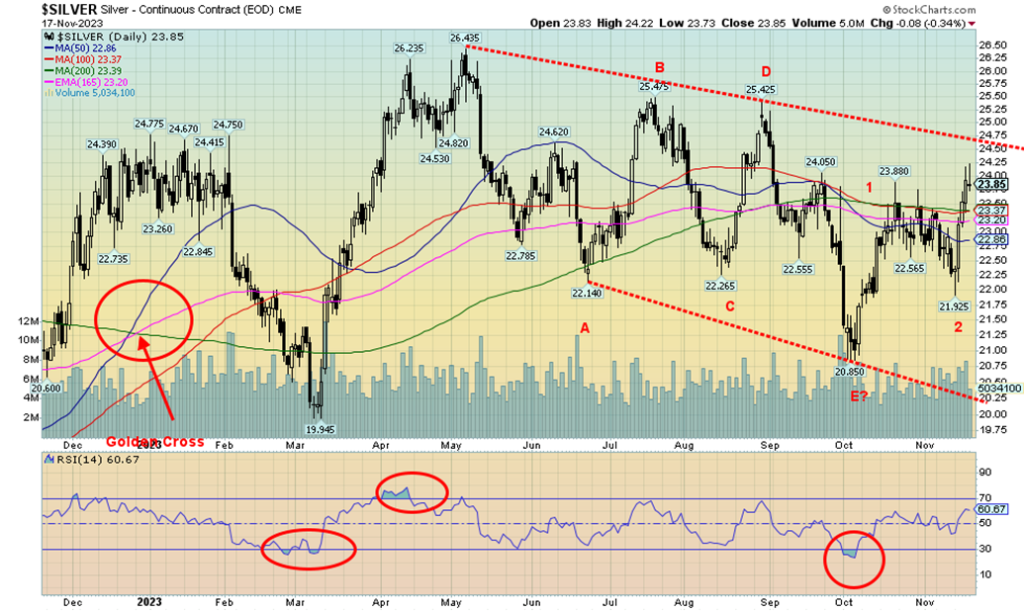
Silver prices enjoyed a strong up week, gaining 7.1%, the best performance in weeks. Is it sustainable? While we traded above $24, we failed to hold it in the end, confirming that the zone is resistant. Further resistance is seen up to $24.75, but above that level, things look better. A breakout over $25 would be quite positive and suggest that the high of April 2023 at $26.44 could be surpassed. We do have a potentially awkward-looking head and shoulders bottom. We didn’t label it.
The left shoulder would be the August low of $22.27, the head the October low of $20.85, and the potential right shoulder at the recent low of $21.93. Technically, we are over the neckline, which we calculate to be at $23.35. Potential upside targets are up to $28. On another positive note, the commercial COT is at 37% an improvement from the previous report of 35%. Buying silver on this rise is positive. If the low at $20.85 was the completion of what we see as an ABCDE-type correction, we could be starting on the third wave up. T
he third wave is often the best one. That potential $28 target could loom, especially once over $25. It was reported that India imported some 60 million ounces of silver in October. Interesting that silver bottomed in early October as the India buying got underway.
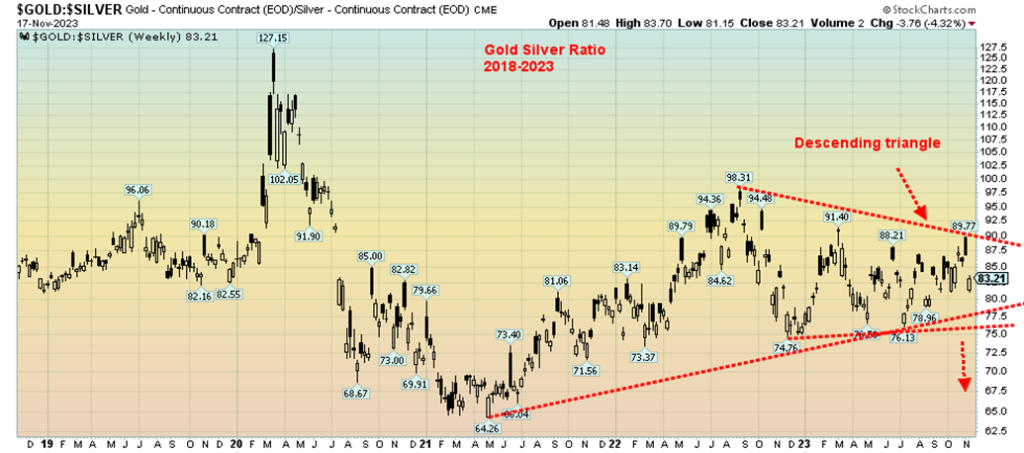
In the week, the gold/silver ratio fell 4.3% in favor of silver. The close was at 83.21. However, we need to break under 76.00 to suggest that the ratio is going to get even better in favor of silver. Since topping at 98.31 in August 2022, the gold/silver ratio has been forming what appears to be a descending triangle. The break of 76 could project down to a gold/silver ratio of 52.50. Watch the 76 zone carefully.
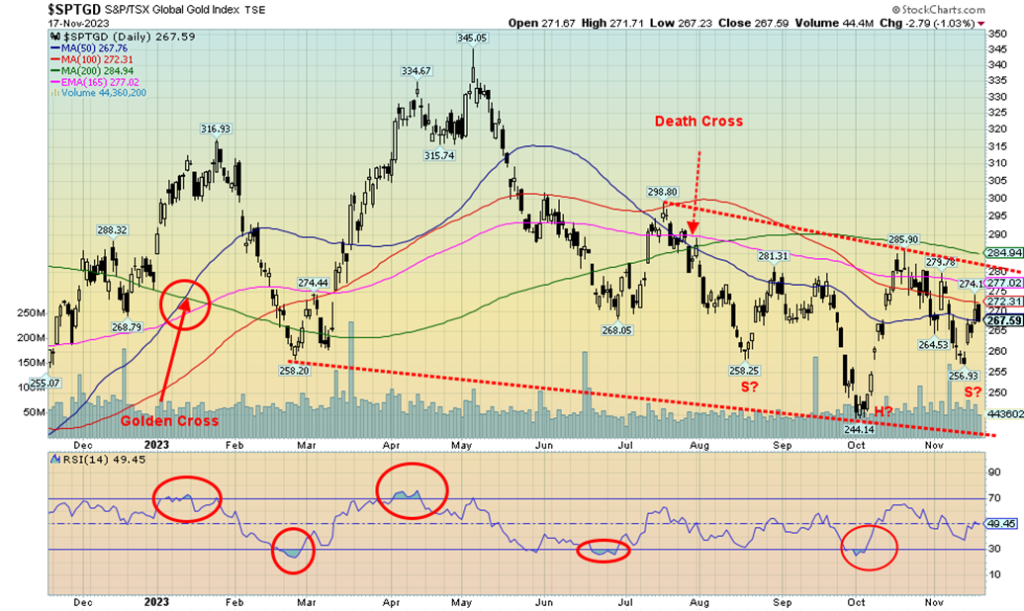
It was an up week for the gold stocks, despite Friday’s pullback. The TSX Gold Index (TGD) gained 3.3% on the week, while the Gold Bugs Index (HUI) was up 4.3%. Stronger gold and silver prices help. The small-cap TSX Venture Exchange (CDNX), where 50% of the companies are in mining—many of which are gold mining companies—gained about 4%, its best performance in weeks. Many junior gold mining companies have been having trouble raising cash as the winter drill season approaches. The TGD appears to be forming a potential head and shoulders bottom pattern, not unlike what we noted in our chart of the week for the GDX and GDXJ. It is unconfirmed.
A breakout over 280 on high volume would go a long way to confirm the low. Over 285, the TGD looks stronger. Potential targets for the H&S pattern are up to 335, which we note is just short of the May high of 345. However, above 321, the odds favour new highs above 345. A solid break of 257 would signal the TGD is headed lower. Under 254, new lows below 244 are possible. We like the positive technical patterns for the gold stocks, and we are moving into a seasonally strong period that often lasts until March for gold and silver. That in turn would help the gold stocks.
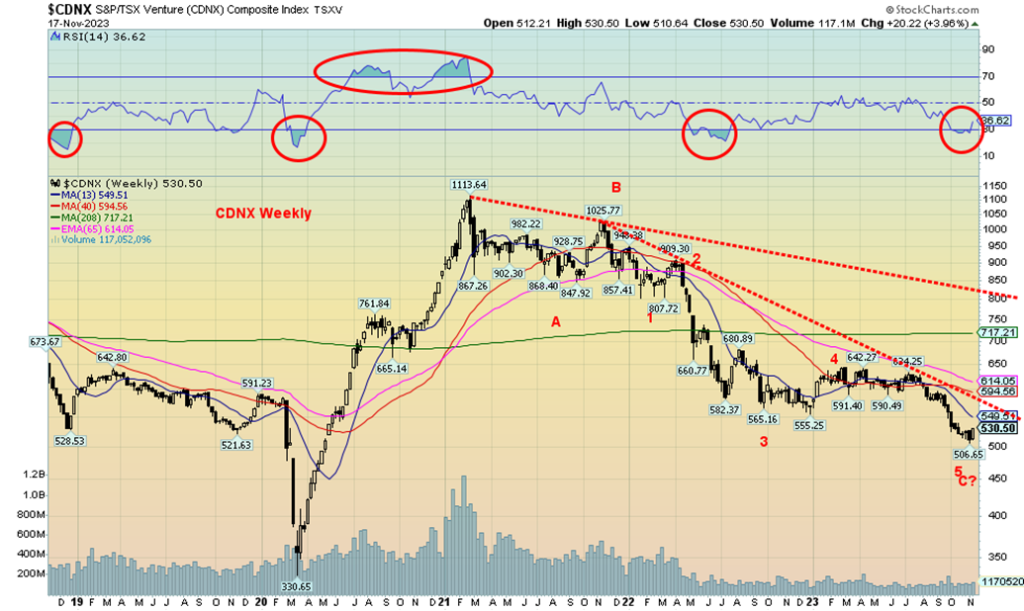
Above is a weekly chart of the TSX Venture Exchange (CDNX). As we noted, the CDNX is roughly 50% mining stocks, many of which are gold mining companies. They are the ones most likely to pull the market higher. There are 138 companies that make up the CDNX. The jump in prices this past week was the best seen in weeks. The CDNX is down 52% from that high seen in February 2021. Many individual components are down even more.
However, the first good sign of a low is nearby with that downtrend line from a high in November 2021. That currently lies 590 near the 40-week MA currently at 595. A firm break above 595 would most likely confirm a low for the CDNX. The CDNX is rising from oversold conditions that are diverging, with lows seen in the spring of 2022—meaning, we saw a lower low (price) but a higher RSI (indicator). The four-year MA is a way off at 717 and the breakout of the downtrend line from the high is at 800. But the rebound this past week was encouraging. What we need now is confirmation that this low is in.
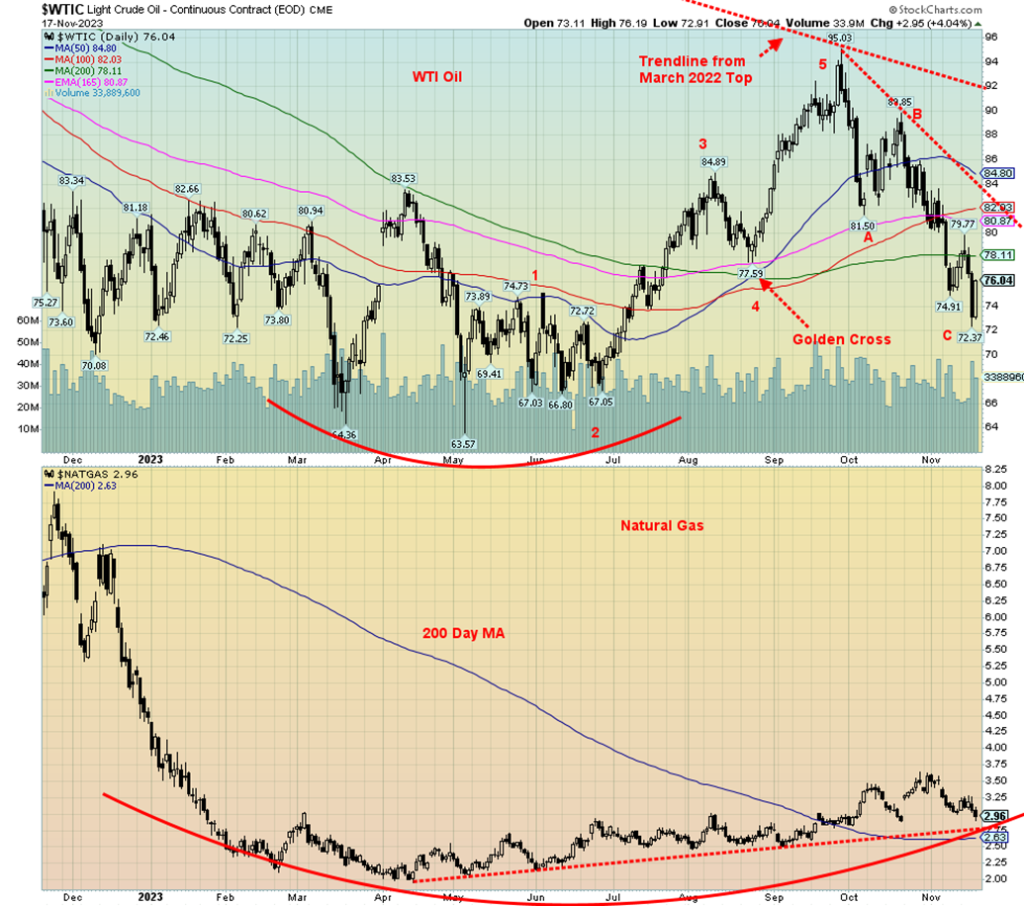
Fear of recession is overwhelming any thoughts of wars expanding in energy-sensitive zones such as the Middle East (particularly Iran) and Russia. Weaker-than-expected economic numbers this past week sent oil prices lower, leading to the fourth consecutive week of losses. All this despite a bounce-back on Friday. All this has resulted in the futures curve, which was in backwardation, now shifting into contango. Contango where future prices are higher than the spot/cash price is a normal curve. Backwardation where future prices are lower than the spot price is an inverted curve. That we are in contango means traders are expecting higher prices for oil further out.
Despite a big drop earlier in the week, oil prices rebounded on Friday but still left WTI oil lower on the week by 1.5% while Brent crude was down 1.0%. Natural gas (NG) wasn’t spared as NG at the Henry Hub fell 2.3% and NG at the EU Dutch Hub fell 3.4%. Warmer weather and suppressed demand helped push NG lower. The energy stocks didn’t seem to mind, however, as the ARCA Oil & Gas Index (XOI) rose 1.3% while the TSX Energy Index (TEN) rose a more modest 0.3%. The energy stocks may have been looking at the WTI oil curve returning to contango, thus looking at higher prices going forward.
Is it possible that WTI oil is in the process of creating a sharp ABC correction to the rise from that May low at $63.57 to the September high of $95.03? A Fibonacci 61.8% retracement, which is not unusual, is at $75.58. We surpassed that (low $72.37 or a 71% correction). The 76.4% retracement ((Fib 61.8% x Fib 23.6%) + Fib 61.8%)) is at $71. Below that, our expectations would be we could make new lows below $63.57. If we can regain $78 and hold above that level, then our argument might be that we are holding the 200-day MA (currently $78.11). Regaining back above $83 would be more positive and confirm that the low is in.
Our outlook for oil prices (and NG as well) remains positive as we enter the seasonally strong period for oil and gas. NG’s strongest period is February to June while oil’s strongest period is December to July. Possibly the return to a contango curve is helping thoughts we’ll be strong once again starting in December. The wild card is the Middle East, particularly Iran. If somehow Iran was dragged into this war, then analysts have stated oil prices could soar to $150 or higher.
NG has support down to $2.60, but under $2.55 prices could test lower. Our expectations are that the 200-day MA area, currently at $2.63, could provide sufficient support. The low of $1.95 was seen back in April 2023. We’d have to break under $2.35 to begin suggesting that new lows are possible.
__
(Featured image by sergeitokmakov via Pixabay)
DISCLAIMER: This article was written by a third party contributor and does not reflect the opinion of Born2Invest, its management, staff or its associates. Please review our disclaimer for more information.
This article may include forward-looking statements. These forward-looking statements generally are identified by the words “believe,” “project,” “estimate,” “become,” “plan,” “will,” and similar expressions. These forward-looking statements involve known and unknown risks as well as uncertainties, including those discussed in the following cautionary statements and elsewhere in this article and on this site. Although the Company may believe that its expectations are based on reasonable assumptions, the actual results that the Company may achieve may differ materially from any forward-looking statements, which reflect the opinions of the management of the Company only as of the date hereof. Additionally, please make sure to read these important disclosures.
Copyright David Chapman 2023
David Chapman is not a registered advisory service and is not an exempt market dealer (EMD) nor a licensed financial advisor. He does not and cannot give individualised market advice. David Chapman has worked in the financial industry for over 40 years including large financial corporations, banks, and investment dealers. The information in this newsletter is intended only for informational and educational purposes. It should not be construed as an offer, a solicitation of an offer or sale of any security. Every effort is made to provide accurate and complete information. However, we cannot guarantee that there will be no errors. We make no claims, promises or guarantees about the accuracy, completeness, or adequacy of the contents of this commentary and expressly disclaim liability for errors and omissions in the contents of this commentary. David Chapman will always use his best efforts to ensure the accuracy and timeliness of all information. The reader assumes all risk when trading in securities and David Chapman advises consulting a licensed professional financial advisor or portfolio manager such as Enriched Investing Incorporated before proceeding with any trade or idea presented in this newsletter. David Chapman may own shares in companies mentioned in this newsletter. Before making an investment, prospective investors should review each security’s offering documents which summarize the objectives, fees, expenses and associated risks. David Chapman shares his ideas and opinions for informational and educational purposes only and expects the reader to perform due diligence before considering a position in any security. That includes consulting with your own licensed professional financial advisor such as Enriched Investing Incorporated. Performance is not guaranteed, values change frequently, and past performance may not be repeated.


TopRanked.io Weekly Affiliate Digest: What’s Hot in Affiliate Marketing [Changelly Affiliate Program]
It's official. TikTok is (potentially) dead. And, if you believe the news, that's gonna destroy thousands of small businesses and...


Terre et Lac Launches Crowdfunding for a Photovoltaic Power Plant
Terre et Lac, a Lyon-based company, launches a crowdfunding campaign for a solar plant in Voreppe. Residents of Isère and...


Qonto, Ledger, and Younited Credit, Leading Trio of the French Fintech Ecosystem
Qonto emerges as the top fintech in the latest rankings after its successful Series D funding. The 2024 Fintech 100...


Cannabis Clubs: Germany Introduces Strict Regulations
Germany introduces new regulations aimed at tightening control over cannabis clubs, following recent reforms. The Cannabis Act (CanG) allows limited...


Merck Invests Over 300 Million Euros in a New Research Center in Germany
Merck invests over 300 million euros in a new biotech research center in Germany, part of a larger 1.5 billion...
 |
|
 |  |
 |
|
-

 Markets6 days ago
Tariffs Have Been Imposed by the U.S. Against a Growing Number of Countries
-
 Impact Investing2 weeks ago
Environmentalists and Consumers Denounce Repsol for Greenwashing
-

 Cannabis3 days ago
Cannabis in Canada: Trends, Statistics and Social Impact
-

 Impact Investing1 week ago
The World’s Largest Insurers Have ESG Blind Spots, According to ShareAction