Featured
Why an oil price crash could happen in 2018
With lower demand and other oil-producing countries flooding the oil market, an oil price crash could happen next year.

Oil prices have more than doubled since bottoming in early 2016. A barrel of crude oil trades at around $57.00 now, compared to $26.00 in early 2016. The question being asked is: How far could oil prices go?
This is a bold statement, but worth making: we could see oil prices crash in 2018.
Let’s ask another question: why did oil prices increase?
You see, geopolitical tensions were hands down the biggest reason that, all of a sudden, there was a rapid move in oil. It was Saudi Arabia’s Crown Prince Mohammad bin Salman arresting a few key decision makers in the country, as well as the warmongering going on in the Middle East.
Mind you, the Middle East is a key oil-producing region. If there’s ever uncertainty in the region, oil prices shoot higher.
With this in mind, one could ask: Tensions in the Middle East haven’t eased, so how could you make an oil price crash prediction for 2018?
If you follow the news and look closely, it looks like there’s been some ease in tension. We are hearing a lot of news suggesting that conditions may not be as bad as previously anticipated.
As this becomes mainstream, those who bought oil as a play on Middle East tensions could be looking to exit.
Supply glut could be possible again
Beyond this, keep the overall supply and demand situation in mind. The biggest reason oil prices started to crash in 2014 was on the supply side: too much oil, not enough demand.
It is important to understand one thing: although the Middle East remains a major oil-producing region, there are other players in the markets that shouldn’t be forgotten.
One oil-producing country that shouldn’t be ignored is the United States. We could see the oil market flooded again in 2018.
During the slump in oil between 2014 and 2016, U.S. oil production declined.
But, with a higher oil price, we are starting to see production pick up. In August, for example, oil production amounted to 9.2 million barrels per day. Production increased to 2015 levels very quickly. (Source: “U.S. Field Production of Crude Oil,” U.S. Energy Informational Administration, last accessed November 29, 2017.)
Now, if oil prices increase to $60.00 a barrel, it wouldn’t be shocking to see production soar even higher. All of a sudden, a lot of shale oil in the U.S. could become manageable to produce.
This could mean a supply glut again, however. With this, would oil prices be able to remain high? Also, won’t countries that were struggling due to low oil prices start producing again?
Charts tell a bearish tale for oil
Technical analysis is saying something very interesting about oil prices.
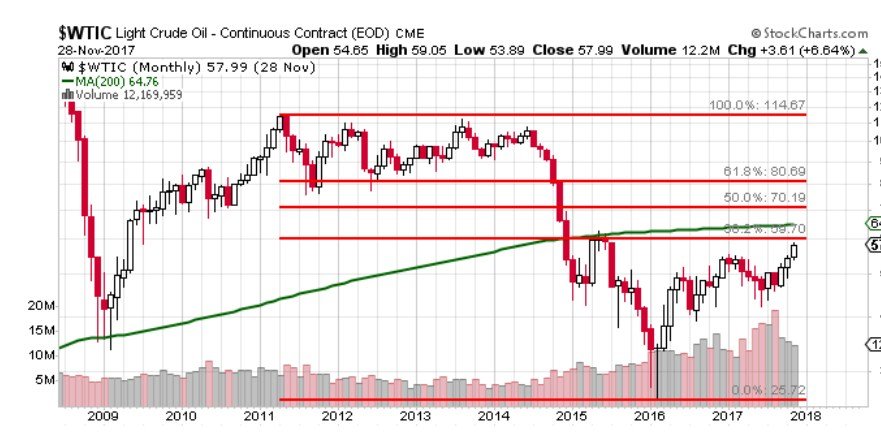
Please look at the chart below for the price of oil:

© Lombardi Letter
On this chart, two technical indicators are plotted: the Fibonacci retracement (red lines), and the 200-month moving average (green line).
The Fibonacci retracement essentially tells of a possible turning point for prices. Currently, oil prices stand awfully close to the 50% retracement level. Mind you, this level has acted as a resistance level twice, so you have to wonder if prices will drop from here.
The 200-month moving average is essentially a trend indicator. In 2015, this moving average acted as a resistance level. Prices dropped after they touched this moving average. And now oil is closing in on its 200-month moving average price once again. Will it act as a resistance level once more?
Oil prices outlook 2018: Sell-off a real possibility
Looking at all this, I can’t help but have a bearish take on oil prices. It wouldn’t be shocking if prices started to drop in early 2018 and we see a crash-like scenario again. It also wouldn’t be surprising to see oil fall back to around $40.00 a barrel if all of this plays out as expected.
What would change my outlook? If tensions flare in the Middle East again and countries don’t produce more oil as prices remain elevated.
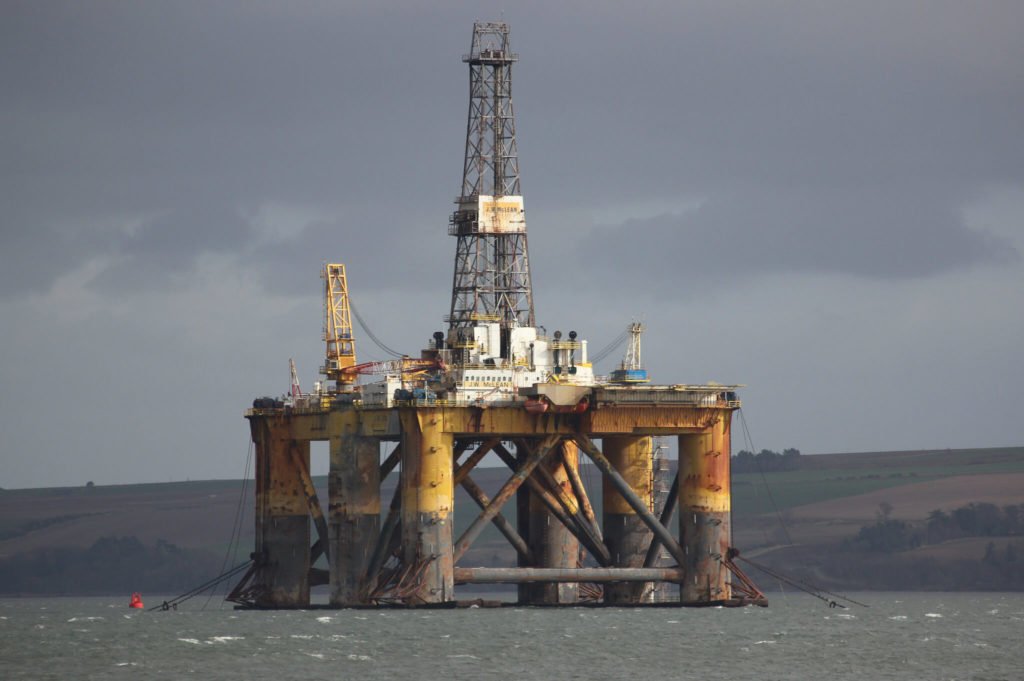
(Chart Courtesy of StockCharts.com.Featured image by Steven Straiton via Flickr. CC BY 2.0 )
—
DISCLAIMER: This article expresses my own ideas and opinions. Any information I have shared are from sources that I believe to be reliable and accurate. I did not receive any financial compensation in writing this post, nor do I own any shares in any company I’ve mentioned. I encourage any reader to do their own diligent research first before making any investment decisions.

-

 Crowdfunding2 weeks ago
Impatto+ 2025: Economic Independence Against Gender-Based Violence
-

 Business1 week ago
The TopRanked.io Weekly Digest: What’s Hot in Affiliate Marketing [Everygame Affiliate Program Review]
-

 Biotech4 days ago
Eli Lilly Enters Recombinase Gene Editing Through Strategic German Partnership
-

 Markets2 weeks ago
Soybean Markets Weighed Down by Rising Supplies and Bearish USDA Outlook


You must be logged in to post a comment Login