Markets
Oil Surges on U.S.–Iran Tensions as Global Markets Show Diverging Trends and Rising Risk Fears
Rising U.S.-Iran tensions expose a fragile agreement, likely pushing oil prices higher while pressuring stocks and gold. Markets show mixed signals, with large caps weakening and smaller stocks rallying. Gold’s correction may be temporary amid strong long-term drivers. Meanwhile, South Korea’s sharp market drop raises concerns about potential global financial contagion risks ahead

We and others have asked the question. If gold is a barbarous relic that generates no income and has no revenues, then why has gold been rising? And why have central banks accumulated gold while at the same time lowering their holdings of U.S. treasuries?
It was John Maynard Keynes who famously referred to gold as a barbarous relic. Back then, the world had been on a gold standard from the 1870s through to the 1920s, followed by a brief hiatus before returning to the gold standard from the late 1920s to 1932. Once again, the gold standard slipped, but it was revived and firmly put in place with Bretton Woods in 1944 where the price of gold was fixed at US$35/ounce.
That lasted until 1971 when Richard Nixon took the world off the gold standard due to its volatility and the constraints it put on governments, along with central banks coming to the U.S. to convert their holdings of U.S. treasuries into gold. The U.S. realized that their gold holdings could soon be wiped out.
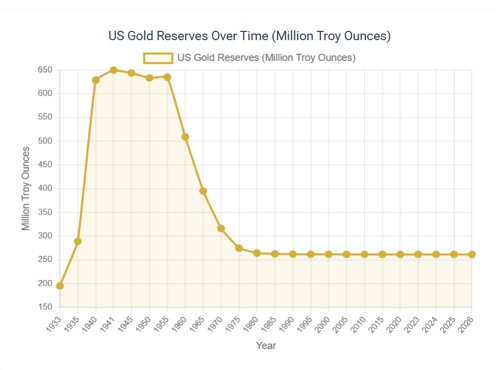
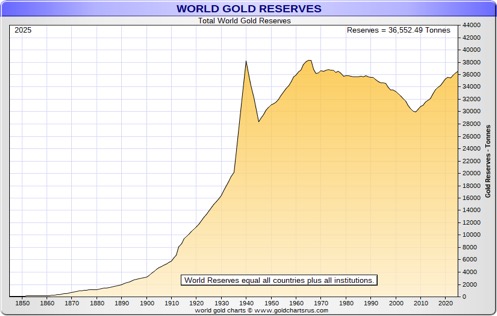
In 1940, the U.S. held 646.9 million ounces of gold (20,120 metric tonnes). By 1970, U.S. holdings had already fallen to 316.3 million ounces (9,838 metric tonnes) of gold. Today, the U.S. still has the largest gold reserves at 261.5 million ounces (8,133 metric tonnes). World gold reserves also went through a hiatus, peaking at over 38,000 metric tonnes in the 1960s, then falling to around 30,000 metric tonnes by the early 2000s.
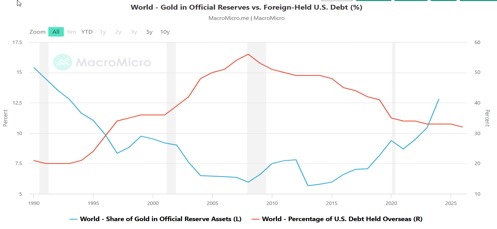
It was a period signified by a long decline in gold prices from a peak of around $875 in 1980 to around $250 by 2001. Since then, central bank gold reserves have climbed back over 36,000 metric tonnes as central banks have been replacing their U.S. treasury holdings with gold. The result is, we now see central banks holding more gold than they do U.S. treasuries.
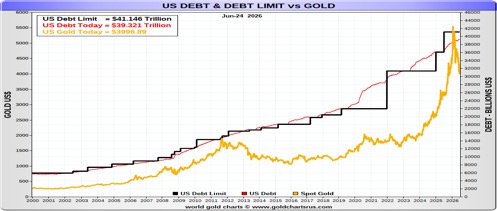
It is important to note that not only have gold reserves gone up, but gold reserves that are also held as percentage of reserves now exceed holdings of U.S. treasuries. Are central banks losing faith in the U.S., given its massive debt, the massive budget deficits, a debasing U.S. dollar, and its divided politics? U.S. government debt has climbed from $5.7 trillion in 2000 to $39.3 trillion today, a gain of 689%. All U.S. debt (government, corporate, household) has climbed from $26.2 trillion in 2000 to $112.4 trillion today, up 429%.
Interest payments on the debt now exceed $1 trillion annually, the third-largest expenditure behind Social Security and Medicare/Medicaid, even exceeding the defense budget. The U.S. budget deficit now represents 5.1% of GDP. In 2000 it was 2.2%. Grant you, we did go through the 2008 financial crisis and Great Recession of 2007–2009 as well as the COVID pandemic in 2020. But the reality is, no other period compares to this one. Few other countries have an annual budget deficit as high as the U.S. as a percentage of GDP.
Is it any surprise then that gold is up 1,300% since 2000, despite the recent pullback? The S&P 500 is up only 400%. Gold has been rising as the debt rises. The current debt limit is $41.1 trillion. Another debt limit crisis could hit by 2027.
Gold has fallen over 29% from the January peak of $5,608. That is somewhat comparable with its 2008 collapse of 33%. Gold is in an official bear market. Silver has been hit more, down 54% vs. 60% in the 2008 financial crisis collapse. However, in what must be a clear divergence, the major gold stock indices, the Gold Bugs Index (HUI), and the TSX Gold Index (TGD) are currently down only about 37% and 34% from their recent peaks, respectively. In 2008, the HUI fell 71% and the TGD dropped 61%.
Even the TSX Venture Exchange (CDNX) has fallen only 24% in 2026 vs. a decline of 76% in 2008. Given the drop for both gold and silver, the gold stocks have held up remarkably well. The CDNX is made up of roughly 50% junior mining companies, so it’s not an exact comparison with the HUI and TGD.
Despite the recent correction, the case for gold remains viable. Gold has no liability, unlike stocks and bonds. Gold is indestructible. Gold is not supposed to be the main asset in a portfolio (unless you are Eric Sprott, whose portfolio is 98% gold, silver, and gold and silver stocks). The usual recommendation is for 5%–15%. Then there is the growing unsustainable debt, the potential for a sovereign debt crisis, the unstable global politics, and the unstable domestic politics in the U.S. and elsewhere.
Finding gold is not easy and there are growing supply constraints. Challenges include rising bond yields and the US$ Index, plus unknown Federal Reserve policy. Nonetheless, gold has an essential place in portfolio management.
Performance Gold, S&P 500, Silver, NASDAQ, TSX, WTI Oil 2000–2026
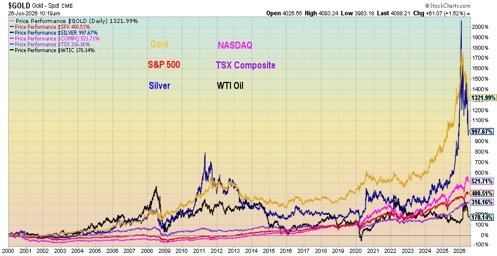
Chart of the week
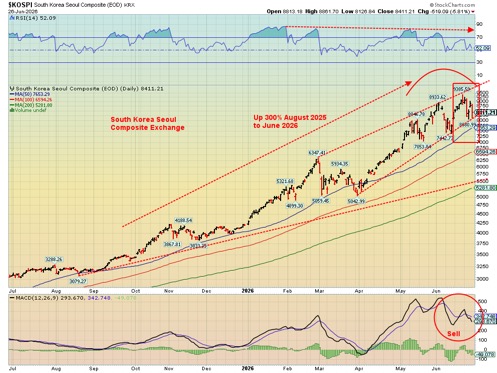
We don’t normally write about other exchanges; however, the mini crash on June 23, 2026, on the South Korea Seoul Composite Exchange (KOSPI) caught our attention and is worth noting. The exchange crashed by 10%. Notably, one of its key stocks that crashed was Samsung, down 12%. Okay, maybe it doesn’t rank up there with the Dow Jones Industrials (DJI) crash on October 19, 1987, when the DJI fell 22.6% or the DJI crash of October 24–29, 1929, when over a few days the DJI fell 25%. Still, it was significant.
The mini crash also brings to mind the 1998 Russian default/LTCM crash of October 1998, which required the combined efforts of the Federal Reserve plus the money center banks to bail out LTCM (Long-Term Capital Management L.P.) as its collapse threatened the entire banking system. We also harken to the September 2008 crash of Lehman Brothers. That also almost brought down American International Group (AIG), threatening the entire global banking system if the Fed and global central banks hadn’t been able to come to the rescue.
I was around on October 19, 1987, and I still remember what a nail-biting day it was, sitting on the international dealing desk of a major Canadian bank. The crash actually started over in Europe, and I can remember being on our trading desk at 4:00 am, desperately trying to get through to London to attempt to cover some vulnerable positions. All the lines were jammed. True, we didn’t have some of the communication methods available today or we might have been more fortunate.
Alas, we weren’t, and our dealing desk suffered a regrettable loss that we thought was a disaster until we learned of the losses on dealing desks elsewhere in the bank as well as at other banks that paled ours. Not a good day. Within a month or two, our head of equity trading was no longer with us. The rest of us were merely chagrined.
Notably, the DJI was up only 59% from August 1986 to August 1987, not the 300% the KOPSI was up in roughly the same time frame. The bigger the gain, the harder they fall? Is KOSPI’s mini crash over or just beginning to turn into something bigger? Following a two-day bounce back driven by Micron earnings, the KOSPI plunged another 8% on Friday. Of major companies in South Korea the most notable was Samsung falling some 12%.
South Korea is known for its manufacturing in electronics, automobiles and shipbuilding. On a more positive note, a mini-crash got underway in Asia in 1997 starting in Thailand with the collapse of the Thai Bhat. Initially, it looked serious enough that it could spread to other global markets. It didn’t and the damage was contained, allowing stock markets to continue the dot.com boom into 2000.
Initially, the KOSPI saw trading suspended, but after a 20-minute hiatus they reopened. The KOSPI was heavily retail-driven, not driven by the institutions that often drive today’s AI market. Forced liquidation hit a number of investors. Margin debt had risen to unheard-of levels. Notably, margin debt in the U.S. is also at unheard-of levels. High leverage equals big losses when the rug is pulled.
Not surprisingly, it had been noted that the huge rally had been driven by a narrowing number of stocks. Think of the MAG7 plus a few others that have dominated the U.S. markets. It seems that the Korean market just ran out of buyers, and then somebody pressed the panic button. Volatility had reached unprecedented levels as well. Regulators were circling, becoming increasingly concerned about the narrowing and the leverage in the market.
Apparently, the Korean market saw rising investor expectations into Micron earnings. Buy the rumour, sell the news? This mini crash may amount to nothing, and they’ll regroup to soar to even higher highs. However, following a two-day bounce on the Micron earnings, the index plunged another 6% on June 26. A break now under 8,000 could start a larger waterfall. Some believe the Korean stock market is undervalued, despite the huge gain over the past year. Those that got out on time are now pouring into the Korean property sector market, sparking another bubble that has regulators concerned. Plus ça change, plus c’est la même chose.
Stocks
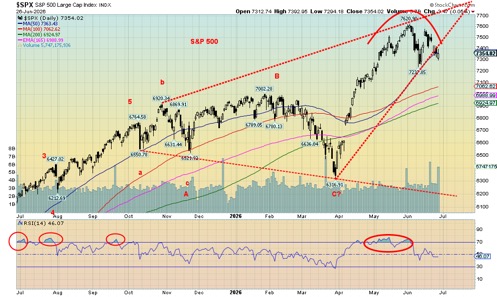
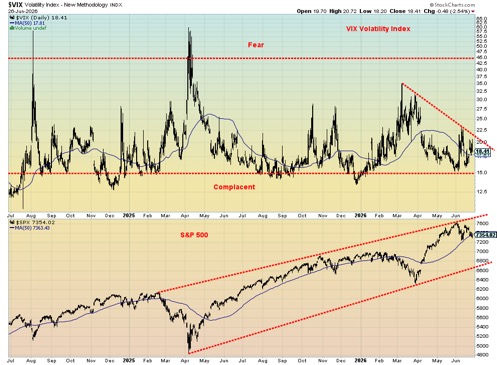
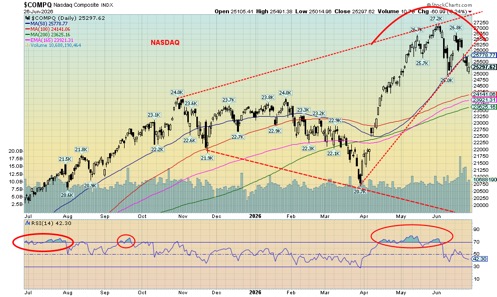
Is the party really over now? Both the S&P 500 and the NASDAQ were dragged down this past week by sell-off in the semiconductors. But then we look over the other way and see that the blue-chip Dow Jones Industrials (DJI) rose and the S&P 400 (Mid) and S&P 600 (Small) both made all-time highs and closed up on the week. The small cap Russell 2000 also made all-time highs and closed up on the week. The VIX Volatility Index, which normally goes up when the market goes down, remains under 20. All this suggests they are selling off semiconductors and reinvesting them in small cap stocks.
So, is this an end-of-cycle flight to risk taking? Or is this a broadening of the market and a sign the market will go up again to even greater heights? After all, a rising market for mid and small caps often signals the beginning of new bull. Small cap earnings have also been improving, thanks to an economy that’s still growing. It could also be a valuation catch-up. Naturally, all this remains to be seen.
The charts of the S&P 500 and the NASDAQ do not look good, given the rush to all-time highs, followed by a plunge, and then a return towards the highs that fails. The fail is not as yet confirmed. We need to break down under the previous low near 7,200 S&P 500 and 25,000 NASDAQ. If that happens, then potential swing-down targets become 6,850 S&P 500 and 22,800 NASDAQ.
On the week, the S&P 500 fell almost 2% and the NASDAQ was down 4.6%. The DJI was up 0.6% and the Dow Jones Transportations (DJT) was up 0.9%. The Mid rose 0.7% while the Small was up 3.0%. The S&P 500 Equal Weight Index made all-time highs, gaining 1.6%, a divergence with the weighted S&P 500. The NY FANG Index suffered, down 6.1%. Bitcoin resumed its drop, off 5.1%, and is now down 31.7% in 2026.
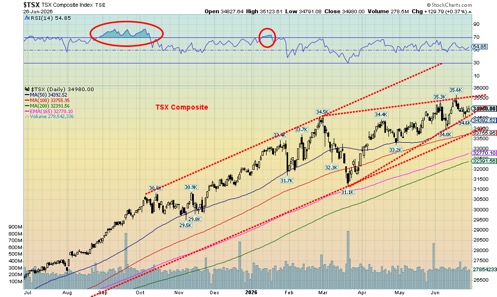
In Canada, the TSX Composite eked out a 0.4% gain, but the TSX Venture Exchange (CDNX) continues to suffer, down 6.2%. In the EU, the London FTSE rose 1.4%, the EuroNext dropped 1.5%, the Paris CAC 40 was off 0.4%, and the German DAX fell 1.3%. In Asia, China’s Shanghai Index (SSEC) fell 1.5%, the Tokyo Nikkei Dow (TKN) made all-time highs, then reversed and closed down 2.7%, Hong Kong’s Hang Seng (HSI) fell 5.2% to new 52-week lows, while India’s Nifty Fifty was up 0.2%.
We noted the Korean Stock Exchange (KOPSI) as our chart of the week. The KOSPI was down 7.1% on the week. The MSCI World Index ex U.S. made all-time highs, then reversed and closed down 2.7%. The sharp drop for the KOSPI, along with the reversals for the TKN and the MSCI World Index ex USA Index, are not positive signs.
All of the MAG7 closed down on the week, led by Google, off 8.9%, and Nvidia, down 8.4%. Broadcom fell 11.1% while Musk’s SpaceX fell 17.2%. SpaceX is still up 13.5% from its IPO price, but it’s now down 32% from the post-IPO surge. The big story was about Micron’s earnings, but at the end of the week Micron was actually down 0.2% after making all-time highs. Trump Media (DJT) was hammered, down 12.8% to new all-time lows.
Snowflake was a winner, up 6.9%, but most of the group we follow were down on the week. We had noted before that the huge IPO for SpaceX could signal a market top. So far, we have not been disappointed, but we await confirmation.
In Canada, nine of the 14 sub-indices were up on the week. Income Trusts (TCM), Financials (TFS), Consumer Staples (TCS), Industrials (TIN), and Utilities (TUT) all made all-time highs. The best was Consumer Staples (TCS), which went up 5.2%. It was the Materials (Golds (TGD), Metals (TGM), and Materials (TMT)) along with Energy (TEN) that dragged the TSX down. Metals & Mining (TGM) led the way, down 6.6%. Telecommunications (TTS) also fell 3.0% in the week.
We await confirmation on the S&P 500 and NASDAQ. Possibly the renewal of war tensions in the Persian Gulf will send markets lower this coming week.
Bonds
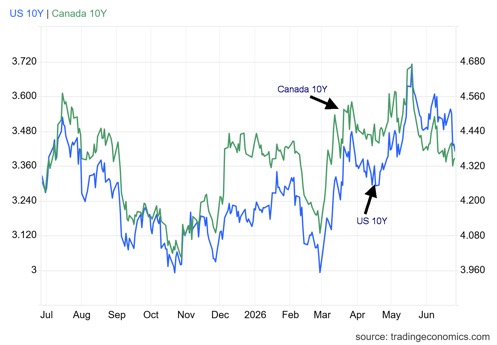
Writing about the bond market of late is a bit of a yawn. The bond market has been making only small incremental moves. This past week, the U.S. 10-year Treasury note fell 8 bp to 4.38% while in Canada the 10-year Government of Canada bond (CGB) was off only 1 bp to 3.39%. It seems that Fed Chair Kevin Warsh’s tough talk on inflation has the market thinking he’ll help push inflation back towards the 2% target.
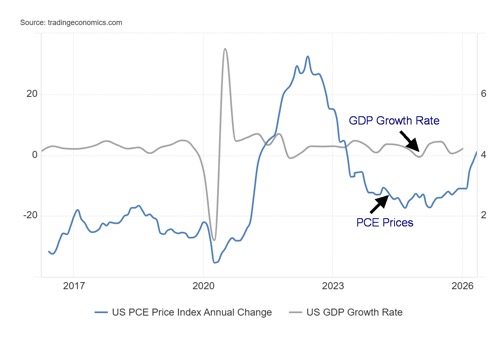
The latest Personal Consumption Expenditures (PCE), which is the preferred Fed inflation indicator, surged to 4.1% y-o-y, the highest level since 2023. However, the number was within expectations. Nonetheless, Warsh’s tough talk helped ease bond yields. Even the 2-year Treasury note eased by 9 bp this past week to 4.10%.
Tightening? No, the market is saying easing. And that is also despite the stronger than expected Q1 GDP that came in at 2.1%, up from 1.6% and up from 0.5% seen in Q4 2025. It seems that better than expected import growth helped the GDP number. Exports are positive for GDP while imports are negative.
GDP Growth Rate, PCE Prices 2016–2026
Also helping bond yields this past week were falling oil prices. But the threat to higher oil prices could push bond yields back up again. The market thinks that we will see a rate hike before year end, but they are also viewing it positively. It also helps that the Treasury has eased up on issuing longer-dated bonds, concentrating more on issuing short-term treasury bills and notes. Households have depleted their savings this year so that could soften retail sales going forward.
While the Q1 GDP number was good, it was not necessarily good news as the background continues to deteriorate. Consumer spending was down from previous reports, even as fewer imports helped boost the number.
Gold and silver
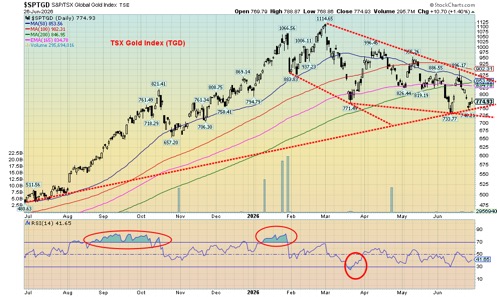
Gold bugs have had a miserable time of it lately. Gold is now down 5.6% in 2026. Silver is down 17.4%, the Gold Bugs Index (HUI) is off 6.9%, and the TSX Gold Index (TGD) is down 5.2%. But is the glass half full or half empty? Over the past year gold remains up 25%, silver is up 64%, the HUI up 60%, and the TGD also up 60%. We recently saw the RSI dip under 30 (oversold) for gold, silver, and the gold stocks, but this recent pullback is mostly seeing a higher RSI, even as they make new price lows (except for the TGD).
All have fallen under the 200-day MA. All are in official bear markets. The intermediate (weekly) trend has turned down, a sign that one should be shifting out of the precious metals. But as our main essay points out, the case for holding gold and precious metals remains strong. It is not unusual for powerful up moves to be followed by a nasty correction. Despite the recent pullback, gold is up 153% from its 2022 low, silver is up 237%, the HUI is up 277%, and the TGD is up 255%.
To us, it has all the earmarks of a nasty wave four correction from that 2022 low, the last significant low and a probable 7.8-year cycle low. Given the drop and timing, this is most likely a half-cycle 3.9-year cycle low. We are in the zone. Interestingly, Martin Armstrong of Armstrong Economics (www.armstrongeconomics.com), a well-known forecaster with uncanny accuracy because of his computer program (aptly named Socrates), is now calling for a low in the precious metals and a move eventually to new all-time highs.
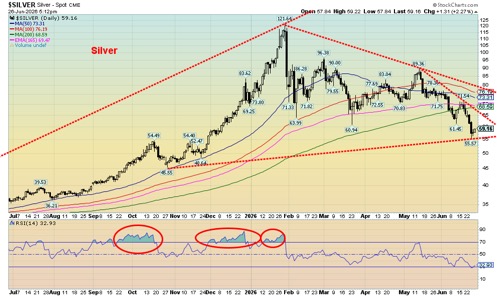
On the week, gold fell 3.4%, silver dropped 10.5%, platinum was off 5.1%, and for the near precious metals’ palladium fell 5.9% and even copper was down 3.9%. The stocks were hammered again, with the HUI down 7.2% and the TGD down 5.4%. A strong US$ index was a catalyst for gold to drop as it gained 0.6% to fresh 52-week highs. At the same time, some currencies were making 52-week lows.
Both the Canadian dollar and the euro had that distinction. Nonetheless, the case for a stronger US$ Index is not looking good. The large budget and external deficits continue to loom large. Central banks are still buying. That the stock markets were wobbling as were oil and energy stocks didn’t help. Thoughts remain that the Fed could hike interest rates because of rising inflation. The next FOMC is on July 28–29. In the interim, everything, it seems, was on sale.
All signs suggest that we may have put in an important low. However, we can’t celebrate until we confirm the low. For gold, a move back above $4,500 would be a positive sign. Above $4,800 and the low is confirmed. For silver, the points are $75 and $85, for the HUI they are 775 and 875, and for the TGD 900 and 1,000. Yes, we are down sharply from the all-time highs. But the case for gold remains strong, despite the sharp drop. Smart money is accumulating.
Oil and gas
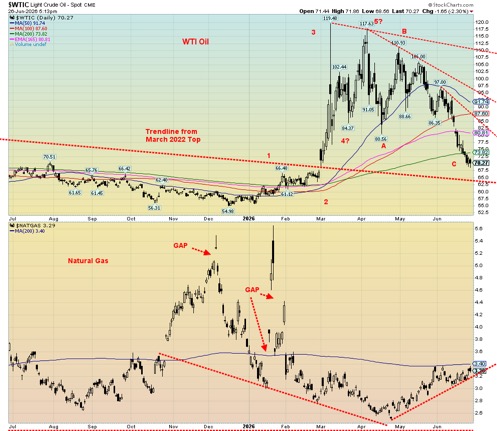
Where do oil prices go now with the Iranian attack on at least two ships in the Strait of Hormuz and retaliation from the U.S.? Is the Memorandum of Understanding (MOU) in trouble? The war back on? While the answer to all of this is still to be determined, the immediate reaction, we suspect, will be to see oil prices rise once again. Oil prices had been falling, even dipping under $70 for WTI oil as the war premium eased. Flows were showing signs of recovery. But not anymore? Naturally as we write this, markets for Monday are not yet open. But our suspicion is we’ll see higher oil prices.
Markets had become oversold with an RSI under 30. It doesn’t guarantee a bottom, but it’s a sign that selling should now be easing. Also, $70 would be a psychological number and a former area of resistance, thus making it an area of support. Other pressures remain with the U.S. strategic reserves trending at the lows of the five-year average.
On the week, it was it another nasty one for oil prices. WTI fell 9.4% while Brent crude dropped 9.8%. Natural gas (NG) avoided the oil carnage as NG at the Henry Hub rose 1.9%, but NG at the EU Dutch Hub was off 2.0%. NG was a sea of calm compared to oil. The energy stocks were not spared as the ARCA Oil & Gas Index (XOI) eked out a gain of 0.7% while the TSX Energy Index (TEN) fell 2.3%. Currently they are making higher lows even as WTI oil is making lower lows. A divergence?
WTI oil has fallen under the 200-day MA. It is also fast approaching the trend line that came down from the 2022 high. That is near $65, another area of support. Nonetheless, given the events on the weekend along with being at a key level of support, the odds favour a rise in prices this coming week. NG remains in a nice uptrend but has considerable work to do to break the 200-day MA near $3.40. Further resistance is seen at $3.60. A break of $3.20 would not be good and would suggest a drop to $3 or lower.
As has been the case since the start of the Iran/U.S./Israel war in late February, oil prices will be driven by the ongoing events in Iran and the Strait of Hormuz. Is the strait open or closed? The latter is again looking more likely, but then ceasefires seem to be an on-again, off-again yo-yo. Notably, despite the big sell-off for oil, down 41% from the March 2026 high, the energy stocks haven’t succumbed to the selling.
The XOI is off 14% from its high and this past week did not see new lows, despite WTI plunging to new lows. The TEN has fallen 17% and it too saw this week’s low above the recent low. Positive divergences? And a sign that the oil sell-off is most likely at its nadir for now.
Markets and trends follow
Markets and Trends
| % Gains (Losses) Trends | ||||||||
| Close Dec 31/25 | Close Jun 26/26 | Week | YTD | Daily (Short Term) | Weekly (Intermediate) | Monthly (Long Term) | ||
| S&P 500 | 6,845.50 | 7,352.98 | (2.0)% | 7.4% | down | up | up | |
| Dow Jones Industrials | 48,063.29 | 51,864.16 (new highs) * | 0.6% | 7.9% | up | up | up | |
| Dow Jones Transport | 17,357.19 | 21,822.39 | 0.9% | 25.7% | up | up | up | |
| NASDAQ | 23,241.99 | 26,297.62 | (4.6)% | 8.8% | down | up | up | |
| S&P/TSX Composite | 31,712.76 | 34,980.00 | 0.4% | 10.3% | up | up | up | |
| S&P/TSX Venture (CDNX) | 987.74 | 895.84 | (6.2)% | (9.3)% | down | down | up | |
| S&P 600 (small) | 1,467.76 | 1,797.11 (new highs) * | 3.0% | 22.4% | up | up | up | |
| ACWX MSCI World x US | 67.18 | 75.04 (new highs) * | (2.7)% | 11.7% | neutral | up | up | |
| Bitcoin | 87,576.98 | 59,794.56 | (5.1)% | (31.7)% | down | down | neutral | |
| Gold Mining Stock Indices | ||||||||
| Gold Bugs Index (HUI) | 701.49 | 653.23 | (7.2)% | (6.9)% | down | neutral | up | |
| TSX Gold Index (TGD) | 817.76 | 774.91 | (5.4)% | (5.2)% | down | neutral | up | |
| Bonds% | ||||||||
| U.S. 10-Year Treasury Bond yield | 4.17% | 4.38% | (1.8)% | 5.0% | ||||
| 3.3Cdn. 10-Year Bond CGB yield | 3.44% | 3.39% | (0.3)% | (1.5)% | ||||
| Recession Watch Spreads | ||||||||
| U.S. 2-year 10-year Treasury spread | 0.69% | 0.29% | 7.4% | (57.8)% | ||||
| Cdn 2-year 10-year CGB spread | 0.85% | 0.65% | 4.8% | (23.5)% | ||||
| Currencies | ||||||||
| US$ Index | 98.26 | 101.34 (new highs) | 0.6% | 3.1% | up | up | down (weak) | |
| Canadian $ | 72.87 | 70.50 (new lows) | (0.4)% | (3.3)% | down | down | down | |
| Euro | 117.48 | 113.88 (new lows) | (0.7)% | (3.1)% | down | down | up | |
| Swiss Franc | 126.21 | 123.52 | (0.6)% | (2.1)% | down | down | up | |
| British Pound | 134.78 | 131.99 | (0.1)% | (2.1)% | down | down | up | |
| Japanese Yen | 63.83 | 61.82 | (0.2)% | (3.2)% | down | down | down | |
| Precious Metals | ||||||||
| Gold | 4,311.97 | 4,069.02 | (3.4)% | (5.6)% | down | down | up | |
| Silver | 71.16 | 58.75 | (10.5)% | (17.4)% | down | down | up | |
| Platinum | 2,046.90 | 1,619.70 | (5.1)% | (20.9)% | down | down | up | |
| Base Metals | ||||||||
| Palladium | 1,619.50 | 1,212.50 | (5.9)% | (25.1)% | down | down | neutral | |
| Copper | 5.64 | 6.12 | (3.9)% | 8.5% | up | up | up | |
| Energy | ||||||||
| WTI Oil | 57.44 | 69.43 | (9.4)% | 20.8% | down | neutral | up (weak) | |
| Nat Gas | 3.71 | 3.29 | 1.9% | (11.3)% | up | neutral | neutral | |
Copyright David Chapman 2026
__
(Featured image by Ben Wicks via Unsplash)
DISCLAIMER: This article was written by a third party contributor and does not reflect the opinion of Born2Invest, its management, staff or its associates. Please review our disclaimer for more information.
This article may include forward-looking statements. These forward-looking statements generally are identified by the words “believe,” “project,” “estimate,” “become,” “plan,” “will,” and similar expressions, including with regards to potential earnings in the Empire Flippers affiliate program. These forward-looking statements involve known and unknown risks as well as uncertainties, including those discussed in the following cautionary statements and elsewhere in this article and on this site. Although the Company may believe that its expectations are based on reasonable assumptions, the actual results that the Company may achieve may differ materially from any forward-looking statements, which reflect the opinions of the management of the Company only as of the date hereof. Additionally, please make sure to read these important disclosures.
David Chapman is not a registered advisory service and is not an exempt market dealer (EMD) nor a licensed financial advisor. He does not and cannot give individualised market advice. David Chapman has worked in the financial industry for over 40 years including large financial corporations, banks, and investment dealers. The information in this newsletter is intended only for informational and educational purposes. It should not be construed as an offer, a solicitation of an offer or sale of any security. Every effort is made to provide accurate and complete information.
However, we cannot guarantee that there will be no errors. We make no claims, promises or guarantees about the accuracy, completeness, or adequacy of the contents of this commentary and expressly disclaim liability for errors and omissions in the contents of this commentary. David Chapman will always use his best efforts to ensure the accuracy and timeliness of all information. The reader assumes all risk when trading in securities and David Chapman advises consulting a licensed professional financial advisor or portfolio manager such as Enriched Investing Incorporated before proceeding with any trade or idea presented in this newsletter.
David Chapman may own shares in companies mentioned in this newsletter. Before making an investment, prospective investors should review each security’s offering documents which summarize the objectives, fees, expenses and associated risks. Although Artificial Intelligence (AI) may be deployed from time to time, AI output is monitored and adjusted, if necessary, for accuracy. David Chapman shares his ideas and opinions for informational and educational purposes only and expects the reader to perform due diligence before considering a position in any security. That includes consulting with your own licensed professional financial advisor such as Enriched Investing Incorporated. Performance is not guaranteed, values change frequently, and past performance may not be repeated.


Avant Devices Moves Toward Electric Wheelchair Kit Production with New Funding Drive
Murcia-based Avant Devices is seeking €260,000 in crowdfunding to launch mass production of its electric wheelchair conversion kit. The funds...


Legend Biotech: Growth Driven by CAR-T Innovation and Carvykti Expansion
Legend Biotech's stock reflects demand for innovative CAR-T cancer therapies. The US biotech focuses on commercializing Carvykti with partner Janssen...


Senegal’s Debt Strategy: Choosing Between Restructuring and Financial Innovation
Senegal’s upcoming choice of debt advisor, with Lazard reportedly leading the race, reflects a broader strategic decision. Rather than pursuing...


Pictet Raises $253 Million for Environmental Investment Fund
Pictet Group closed its Environment Co-Investment Fund I at $253 million, surpassing its $200 million goal. The Article 8 SFDR...


Virginia Cannabis Market Could Reshape Regional Competition
Virginia’s planned recreational cannabis market could reshape the Washington region’s economic landscape. With nine million residents, it may draw consumers...
 |
|
 |  |
 |
|
-

 Cannabis2 weeks ago
Virginia’s Cannabis Journey: A Lesson in Why Legalization Requires More Than a Law
-
 Impact Investing2 days ago
Pictet Raises $253 Million for Environmental Investment Fund
-

 Fintech1 week ago
Payhawk Reaches $100M ARR Milestone with AI-Driven Growth
-

 Cannabis2 weeks ago
Uruguay and Brazil Deepen Medical Cannabis Cooperation