Markets
U.S.–China Tensions, Market Turbulence, and Rising Global Financial Risks
Trump and Xi met; Xi raised the Thucydides Trap, warning conflict when a rising China challenges the U.S. Tensions span trade, technology, and Taiwan. Talks achieved little, markets reacted with higher oil and inflation concerns. Rising yields and debt risks heighten recession fears, while volatile stocks and gold signal potential financial instability ahead globally.

War has consequences and none more so than the war with Iran that got underway on February 28, 2026. U.S. gas prices at the pump are up some 47% since then, while in Canada gas prices have increased by roughly 40%. Pain at the pump. Screams to cut gas taxes resonate on both sides of the border. Not to be left out, gas prices have mostly increased everywhere as well – in the E.U., Asia, and elsewhere. Gas price increases have rocked parts of Asia where rationing is now in effect and protests against rising gas prices are up, particularly in the EU, parts of Africa, South America, and even North America.
It’s not as if this is the first time that inflation has soared in the Western economies. War tends to do that. As our long-term chart of inflation shows, inflation soared during World War I, World War II, during the 1970s due to the Arab/Israeli wars, the Arab oil embargo (1973), and during the Iranian hostage crisis (1979). More recently, inflation soared because of the post-pandemic hangover when governments flooded the financial system with money – i.e., massive fiscal stimulus – to help prevent a deep recession. However, the result was supply-chain disruptions and a surge in pent-up demand after the pandemic: supply of goods constrained vs. increased demand.
Left out on the chart were lesser spikes in inflation, including the post-World War II inflation and the Korean War in the late 1940s and early 1950s, the inflation sparked by the Vietnam War in the late 1960s and early 1970s, the first Iraq War (1990), and the surge in demand from Asia in the 2000s that sparked increased inflation, although subdued.
U.S. CPI Inflation, PPI Inflation vs. U.S. 10-Year Treasury Note 2016-2026
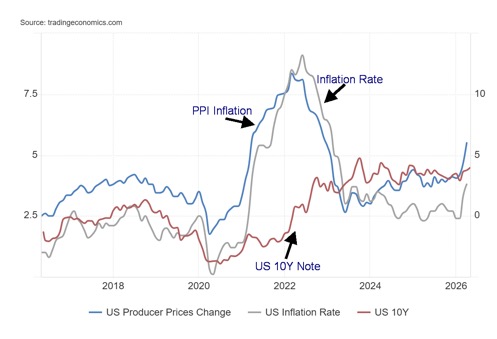
However, it is the here and now that concerns everyone – all against the backdrop of a war that does not appear to have a solution nor an end. The impact shows up most noticeably in bond yields, which have seen the U.S. 10-year Treasury note go from 3.95% to 4.49% and the U.S. 30-year bond yield up 40 bp to 5.10%. The move over 5.00% is of particular concern (check out the “Chart of the week”).
WTI oil has surged 58%, while Brent is up 50%. The S&P 500 500 is up about 8% since February 28, despite initially falling 8%, while gold has fallen 14%. Gold has not only been negatively impacted by rising bond yields but also by strength in the US$ Index, currently up only about 2% since the start of the war (initially it was up over 3%).
All this puts the Fed in a quandary as to what to do. Prevent a recession by lowering interest rates or continue to fight inflation by leaving rates unchanged or even hiking rates? The incoming Fed Chair Kevin Warsh has a dilemma. Lowering rates, particularly if it appears to be at the bidding of President Donald Trump, is problematic for the bond market and other central banks as Fed independence is paramount.
U.S. Inflation Rate 1915–2026
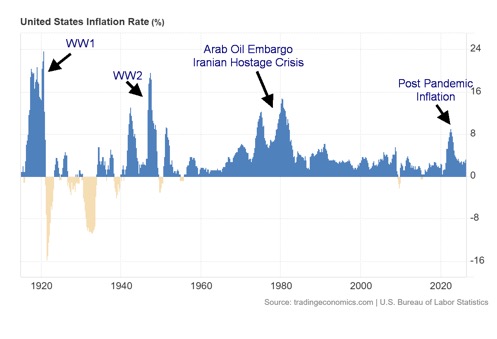
What’s interesting is what followed each spike in inflation. After World War I there was a recession in 1918–1919, followed by a short but steep depression in 1920–1921. The Great Depression came later. After World War II there were short recessions in 1945 and 1949, followed by a recession in 1953 after the Korean War. The recession of 1969–1970 came during the Vietnam War and the steep recessions of 1974–1975 and 1980–1982 came after the steep inflation of the 1970s.
A recession followed the first Iraq War and in 2007–2009, after a brief run-up in inflation and surging oil demand. Oil prices hit record highs. But it was the financial crisis that was at the heart of the 2007–2009 recession, known as the Great Recession. The pandemic sparked the steep but brief 2020 recession that was then followed by the inflation spike. The economy slowed in 2022–2023 but there was no recession.
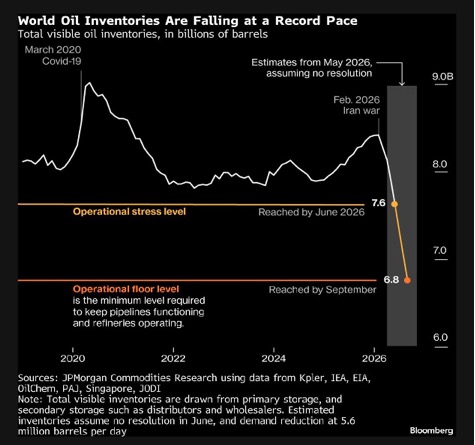
One thing to keep an eye on regarding oil prices is the deteriorating oil reserves. So far, the release of strategic reserves has helped keep a lid on oil prices. But oil reserves are being drawn down at an alarming rate, as noted in the chart from Bloomberg (www.bloomberg.com). Ultimately, this will put upward pressure on oil prices, even if the war with Iran ended today and the Strait of Hormuz opened. Even if the strait opened today, it would take weeks, months, or even longer to clean up the mess that has been the byproduct of this war.
Inflation is here to stay, and it is probably destined to go higher. Like the 1970s, this is the second leg up. What followed then were steep recessions.
The deteriorating fiscal crisis no one wants to talk about
Is the global market an accident waiting to happen? Many have asked that question. But there have been few answers. Answers might come from what we might call “Cassandras.” Cassandra, a figure from Greek mythology, was a Trojan princess who could foresee the future, but was so cursed no one believed her prophecies. Today’s Cassandras predict economic doom and gloom, yet many of their prophecies have yet to bear fruit.
A famous Cassandra is Michael Burry, an investor and hedge fund manager who was amongst the first to predict the subprime mortgage crisis that helped trigger the 2008 financial crisis. Not surprisingly, Burry has predicted that the AI stock market bubble will end badly.
It may not be surprising that 10% of the wealthiest Americans own 87% of the stock market with 1% estimated to own 50% of the market. Note the stock market is not the economy. Yet consumer sentiment is literally at the lowest level it has ever been, lower than during the 1980–1982 recession and the Great Recession in 2007–2009. The K economy. A rising stock market vs. plummeting consumer sentiment.
However, ignoring the risks, regardless of when or even if they might happen could be treated as having one’s head in the sand. Systemic risk is there, even if the proverbial stuff has not yet hit the fan. In many respects, we saw that in the 2008 financial crisis when the housing market bubble burst. Some early bankruptcies of companies no one had heard of were the start, which soon spread to hedge funds, and then the entire banking system, culminating in the collapse of Lehman Brothers in September 2008 and the bailout of American International Group (AIG).
The Great Depression was another event initially triggered by the stock market collapse of October 1929. It soon led to bank runs, the collapse of margin lending, a decline in consumer demand, and then was consumed by a global trade war that no one seemed capable of stopping. Also behind it was a huge build-up of debt that eventually ended in a sovereign debt crisis. The stock market collapse was merely a symptom, not the direct cause of the Great Depression.
Global debt is estimated to have increased some $29 trillion in 2025. A further increase is expected in 2026. Global debt today exceeds $350 trillion. Global debt was estimated to be around $173 trillion in 2008. It’s more than doubled in just 18 years. The biggest contributors have been the U.S., China, and the EU. Major countries that face deteriorating fiscal positions are the U.S., the U.K., and France, but the same could be said for a number of OECD (Organization for Economic Co-operation and Development) countries.
| Country | Government debt US$ trillions | Government debt to GDP % | Household debt to GDP % | Corporate debt to GDP % | Government credit rating S&P |
| U.S. | $39.2 | 123% | 68% | 73% | AA+ |
| U.K. | $4.6 | 94% | 74% | 59% | AA |
| Germany | $3.7 | 64% | 49% | 89% | AAA |
| France | $4.5 | 116% | 60% | 156% | A+ |
| Japan | $11.3 | 237% | 61% | 113% | A+ |
| Canada | $2.9 * | 111% * | 101% | 118% | AAA |
| Italy | $4.0 | 137% | 36% | 59% | BBB+ |
| China | $21.2 | 88% | 59% | 142% | A+ |
* Includes provincial debt
Is the debt crisis about to hit the proverbial fan? What are the vulnerable areas? Commercial real estate, hedge funds, the shadow banking system, developing nations, and, yes, even households. Potentially the most dangerous is the shadow banking system. Who are members? Quite an array. Hedge funds, money market funds, ETF funds, investment banks, private equity funds, private credit funds, securities brokers, finance companies, mortgage companies, structured finance (i.e., structured investment vehicles or SIVs), entities like Fannie Mae and Freddie Mac, and credit insurers who deal in credit default swaps (CDS). You can also add insurance companies, even pension funds. They all operate outside the regulatory banking system.
As no surprise, the largest countries where the shadow banking systems operate are the U.S., China, and the U.K. There are also many offshore havens. Many are highly leveraged, which is a vulnerability. Remember Long Term Capital Management (LTCM), the fund that collapsed after the Russian default of 1998 that almost brought down the banking system? They were highly leveraged with some $100 billion in assets and only $4 billion in equity. However, it was the $1.3 trillion (notional) in derivatives that were a big problem.
The shadow banking system is estimated to be between US$240–260 trillion. Of that, some US$65–90 trillion is considered systemically risky. Global GDP is estimated at US$115 trillion. There are those who monitor the system, but, overall, it is not well regulated. Remember American International Group (AIG)?
That was the company whose exposure to credit default swaps (CDS), in conjunction with Lehman Brothers, almost brought down the financial system during the 2008 financial crisis. AIG had some $1 trillion in assets against about $96 billion in equity. They had also underwritten some $500 billion of CDS. Most of their CDS were unhedged. Both AIG and Lehman were members of the shadow banking system.
A significant collapse in the shadow banking system could negatively impact banks, the stock market, real estate, the derivatives market, and even government debt markets. In 2008, the Fed along with the U.S. Treasury and a consortium of banks prevented a collapse. Do they still have the wherewithal to do it again?
We suspect not. With global debt rising at an alarming rate, the question seems to be when, not if the stuff hits the fan.
Chart of the week
US 30-Year Bond Yield 2021–2026
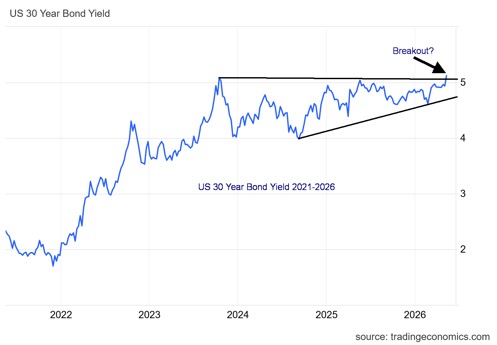
We suppose it was inevitable. The chart of the U.S. 30-year bond yield had the look of a rising or ascending triangle. Is it now being confirmed with the breakout of over 5% and even now taking out that high in 2023 at the height of the previous inflationary run-up? Probably yes. The rising triangle projects to a potential yield of 6.20%, a rise of over 100 bp. This puts both the incoming Fed Chair Kevin Warsh and the current Treasury Secretary Scott Bessent in a bind. You can’t lower interest rates, and you may have to hike them. Besides, the Fed only controls the short end of the market, not the bond market.
In theory, every 1% rise in interest rates adds another $400 billion in interest payments. Interest payments on the U.S. debt already exceed $1 trillion/year. Interest payments are now larger than the U.S. defense budget, making it the third-highest expense for the U.S. government, behind Social Security and Medicare/Medicaid.
Foreign investors are already becoming nervous about the state of the astronomical debt in the U.S. That the U.S. still has the world’s reserve currency means central banks still must buy U.S. treasuries. But there is over $9 trillion of U.S. treasuries held by foreigners in central banks, pension funds, and other funds. The largest holder is Japan, with some $1.2 trillion. Japan is under pressure from rising inflation and interest rates, along with a weak yen. The result? Sell U.S. treasuries, then buy yen-denominated securities to help maintain the Japanese yen.
There is also the problem of funds in the U.S. now holding an asset that’s falling in price. However, they can just hold it to maturity. New treasury issues could receive an icy reception, requiring the U.S. to pay up to sell the issue. There is also the question of other long-term rates that are based off U.S. treasuries. Mortgages and other lending vehicles could also see rates rise. Corporate debt is priced off of U.S. treasuries. It all feeds on itself.
Previous periods of rising long-term rates were often followed by a recession. Michael Burry may be right. Fasten your seatbelts – the road is about to become even rockier.
Stocks
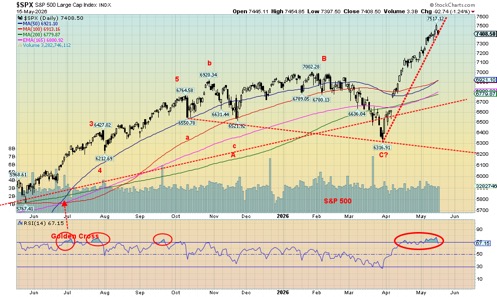
The stock market continues to amaze. The records keep falling. But eventually the law of gravity will catch up to this nearly straight-up move seen since March. Once again, the S&P 500 and the NASDAQ hit all-time highs. Joining them were the AMEX, the NASDAQ 100, the S&P 100 (OEX), the Russell 1000, and the NY FANG Index.
But emphasizing the growing divergence are the Dow Jones Industrials (DJI), the Dow Jones Transportations (DJT), both the S&P 400 (Mid) and S&P 600 (Small), the Dow Jones Composite (DJC), the Dow Jones Utilities (DJU), and, significantly, the S&P 500 Equal Weight Index, which did not make new highs. These are significant divergences.
The party was jolted by the end of the week with the leap in oil prices. Despite Friday’s pullback, the steep uptrend for the S&P 500 and the NASDAQ remains intact. At least until Monday.
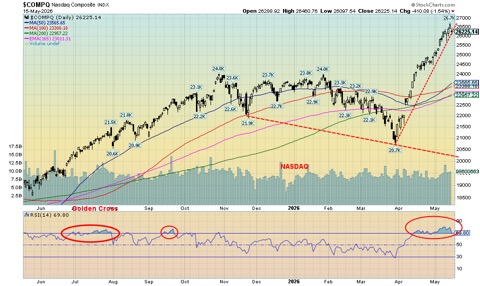
RSIs over 70 (overbought) are not unusual. Over 80 is rare and 85 is extremely rare. Yet we hit over 80 for the NASDAQ. We can rarely remember rises this steep. But we note and remind everyone that we saw steep rises in 1929, 1972–1973, 1999–2000, and in 2007 during the final stages of those bull markets. All ended badly. Is this time different? We doubt it.
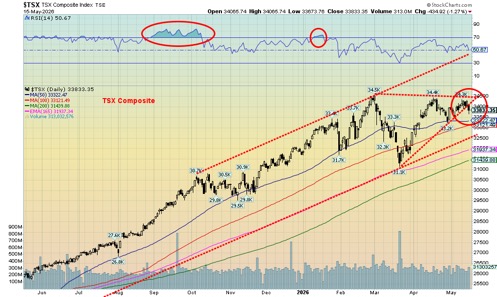
On the week, the S&P 500 rose 0.1% to new all-time highs. It was lonely, as it was the only one that we follow that ended up on the week. The DJI fell 0.2%, the DJT was off 0.3%, while the NASDAQ made all-time highs, reversed, and then closed down 0.1%. The NY FANG Index made all-time highs and closed down 0.3%. The S&P 500 Equal Weight fell 1.3%, the S&P 400 (Mid) was down 2.4%, and the S&P 600 (Small) fell 3.2%. In Canada, the TSX Composite fell 0.7% while the TSX Venture Exchange (CDNX) dropped 0.9%.
In the EU, the London FTSE fell 0.6%, the EuroNext was down 1.0%, the Paris CAC 40 dropped 2.0%, and the German DAX fell 1.6%. Over in Asia, China’s Shanghai Index (SSEC) fell 1.1%, the Tokyo Nikkei Dow (TKN) made all-time highs but ended down 2.1%, while Hong Kong’s Hang Seng (HSI) fell 1.6%. High oil prices and inflation bites. Will there be downside follow-through? The MSCI World Index (ex US) fell 2.8%. Bitcoin dropped 1.4%. Losses everywhere.
In Canada, only three of 14 sub-indices rose on the week, led by Energy (TEN), up 7.1%. Leading the downside was Golds (TGD), off 6.5%. Of the FAANG and MAG7 stocks, six made all-time highs: Apple, Google, Nvidia, Advanced Micro (AMD), Broadcom, and CrowdStrike. MAGS, the MAG7 ETF, made all-time highs. The biggest winner on the week was CrowdStrike, up 12.6%, while AMD was the biggest loser, off 6.8% after reaching an all-time high.
The rise for the S&P 500 has been so steep we need to see a break under 7,100 to suggest a high is in. For the NASDAQ, that’s under 24,500. The TSX Composite appears to have broken its uptrend and could be headed for the bottom of the triangle near 32,500.
We can’t say the party is over yet. But it might be winding down.
Schiller PE Ratio 1870–2026
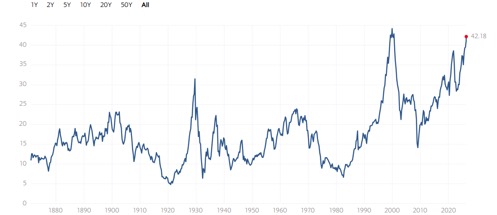
Another warning sign. The Schiller PE Ratio is at the second-highest level ever seen, approaching the high that was seen in 1999 the top of the dot.com bubble. Caveat emptor.
Bonds
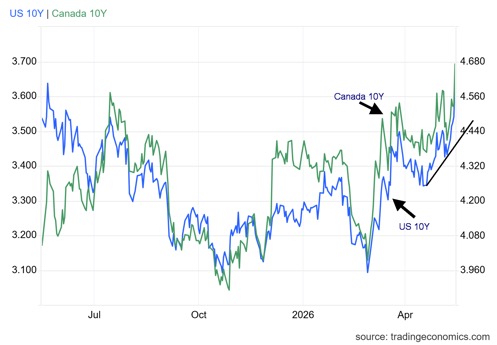
Ouch! The leap in oil prices this past week sparked a big jump in bond yields. The U.S. 10-year Treasury note jumped 25 bp or 10.6% to 4.61%. It’s the highest level seen since early 2025. A break over 4.60% suggests that the 2023 high of 4.92% could also fall. As we noted, the 30-year Treasury bond jumped over 5.00%. Canada, not be outdone, saw the 10-year Government of Canada bond (CGB) rise to 3.69% from 3.48%.
Interest rates worldwide jumped. The German 10-year bund was up 5.9%, the U.K. 10-year gilt was up 5.4%, while the Japanese 10-year JGB jumped 9.2% to the highest level ever seen. It’s the Japanese 10-year that is the biggest concern as they have held interest rates artificially down for years. Now these rates are leaping.
Rising interest rates are a concern as all others are priced off U.S. treasury yields, Mortgages, auto loans, and corporate debt are the most obvious. But it also pushes up interest on the debt, which now ranks only behind Social Security and Medicare/Medicaid.
Gold and silver
Inflation tensions are rising, and that’s bad for gold. It’s all because of the Middle East and the war with Iran. Things may be quiet for now, but they threaten to flare up again. The unresolved meeting between Xi and Trump went nowhere, spooking the oil market to the upside. As a result, bond yields rose, the US$ Index jumped while gold, silver, and the gold stocks were smacked to the downside. Yes, the stock market fell as well, but it was the metals that were hit harder.
On the week, gold fell 3.8%, silver was down 5.5%, and platinum dropped 4.2% while of the near precious metals, palladium fell 4.9% and copper hit new highs before succumbing, in the end down a modest 0.1%. Copper rules. The gold stocks were smacked, as we note on the next page. The junior developers and near producers were also beaten down after rising earlier. What goes up also comes down, sometimes harder and faster.
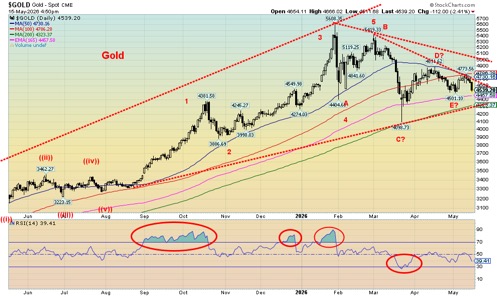
What’s concerning is that what we thought was our E wave down of a larger ABCDE-type correction may not yet be finished. If correct, that support at the recent low of $4,500 may not hold and we could fall further to $4,300. Below $4,300, we could be breaking down with a scary projection of a fall to $2,800. We doubt that will happen, but we need to point it out.
It wasn’t as if rising bond yields in the U.S. spelled a drop for gold prices, but bond yields were jumping worldwide. Crude oil prices are rising and threatening to break out. If gold in US$ fell 3.8%, we note gold in Cdn$ fell 3.2%, gold in euros fell 1.0%, gold in Swiss francs dropped 0.9%, gold in pound sterling was off 0.5%, and in Japanese yen down 1.8%. The stronger US$ helped buoy gold in other currencies.
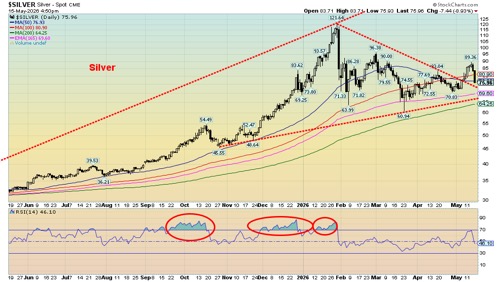
Silver, like gold, was smacked this past week. However, silver had appeared to break out. Now we are not so sure. A break back under $75 would be negative. A break under $64 would be quite negative; however, we expect that silver should test $64 but generally hold. We note on the recent run-up silver broke out, while gold did not. Silver made new highs for the current move; gold did not. A negative divergence? Nor did the gold stocks make new highs.
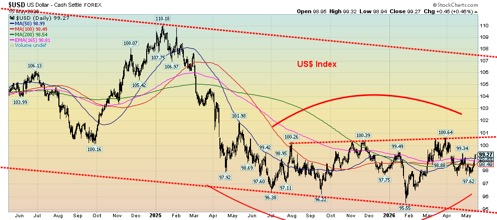
A concern is the US$ Index, which was up 1.5% this past week. Is it making a rounding top or a rounding bottom? The rounding bottom is more relevant to gold. A breakout above 101 could translate into a move to 106. A breakdown under 95 is favourable to gold, but there is a lot more work to do to see a break under 95 than a break above 101.
The reversal this week once again suggests our low may not occur until June or even July. Billionaire Eric Sprott has committed upwards of $3 billion, based on the assumption that gold will rise. He has a history of being right. Early maybe, but ultimately right. His potential targets? $200 for silver and $10,000 for gold.
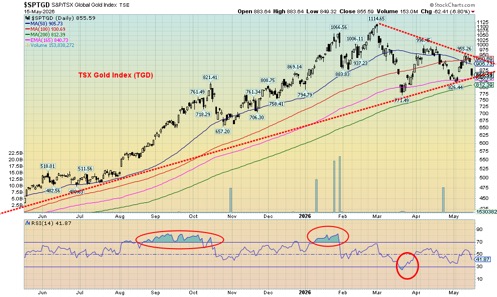
As with gold and silver, the TSX Gold Index (TGD) could be poised to break down. Under 850, things break down. Under 810, a bear market could get underway. It was not a friendly week for the gold and silver stocks. The TGD fell 6.5% while the Gold Bugs Index (HUI) dropped almost 7.0%. Since that top in January near 1,066 we note an A wave down, a B wave up to slightly new highs, a C wave down, and a D wave up, and we now appear to be working on what could be incomplete E wave down.
We thought we were preparing to break out to the upside. No longer. A breakdown now appears more likely. The triangular pattern projects down to 511, although we don’t believe that’s realistic. But a drop to the minimum of 770/775 is possible. Obviously, that recent low near 771 is important. We’d prefer not to see that taken out as it could signal more losses. Nonetheless, there is some support between 770 to 820. Only a break above 955 could set us on an upward trend once again.
Oil and gas
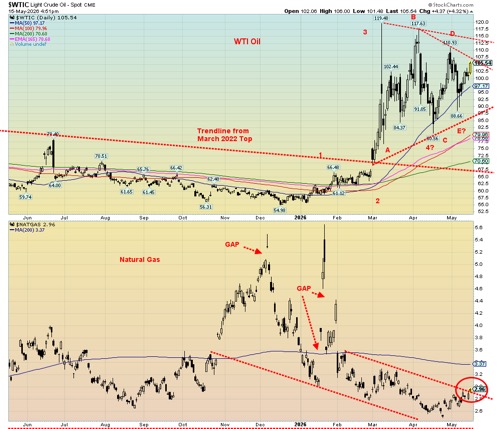
Xi and Trump met. Nothing was resolved. There was hope that their meeting might lead to normalization, but no such luck. Iran announced that it had no trust in the U.S. The odds of the Strait of Hormuz opening are slim to none. As a result, oil prices leaped over $17 in the week or 11.7%. Brent crude jumped almost $9 or 8.8%. No relief. No relief for natural gas (NG), either. Henry Hub NG was up a modest 8.0% while NG at the EU Dutch Hub jumped 16.2%. Energy stocks loved it as the ARCA Oil & Gas Index (XOI) was up 5.9% and the TSX Energy Index (TEN) up 7.1%.
None of this was helped by OPEC and the IEA by slashing their demand forecasts. What’s trapped behind the Strait of Hormuz outweighs demand cuts. Both are still looking at a rise in demand, just not as much as originally reported. How all this can be met against the backdrop of the closed Strait of Hormuz, gas rationing, and protests is anybody’s guess.
One of the biggest concerns is jet fuel supply. Stocks of jet fuel have fallen, and no replacements are in sight. This means airlines are scrambling. Cancellations and rising prices to fly are both leaping. It could be a difficult summer for travelers. Warnings of potential flight disruptions are rising.
As our chart shows, WTI oil has not yet broken out. We’ve noted that we need to get above $107.50 to suggest new highs. We need to get above $113 to fully break out. The triangle pattern that has been forming projects to $152 if we successfully clear $113. Support is at $97, then down to $90. Below $85, we could be breaking down with major support near $70. Under current circumstances a breakout to the upside is favoured. Gas prices at the pump have further to rise.
Markets and Trends
| % Gains (Losses) Trends | ||||||||
| Close Dec 31/25 | Close May 15/26 | Week | YTD | Daily (Short Term) | Weekly (Intermediate) | Monthly (Long Term) | ||
| S&P 500 | 6,845.50 | 7,408.50 (new highs) * | 0.1% | 8.2% | up | Up | up | |
| Dow Jones Industrials | 48,063.29 | 49,526.17 | (0.2)% | 3.0% | up | up | up | |
| Dow Jones Transport | 17,357.19 | 20,134.18 | (0.3)% | 16.0% | neutral | up | up | |
| NASDAQ | 23,241.99 | 26,225.14 (new highs) * | (0.1)% | 12.8% | up | up | up | |
| S&P/TSX Composite | 31,712.76 | 33,833.35 | (0.7)% | 6.9% | up (weak) | up | up | |
| S&P/TSX Venture (CDNX) | 987.74 | 988.81 | (0.9)% | 0.1% | neutral | up | up | |
| S&P 600 (small) | 1,467.76 | 1,629.28 | (3.2)% | 11.0% | up (weak) | up | up | |
| ACWX MSCI World x US | 67.18 | 73.69 | (2.8)% | 9.7% | up (weak) | up | up | |
| Bitcoin | 87,576.98 | 79,114.12 | (1.4)% | (9.7)% | up | down | neutral | |
| Gold Mining Stock Indices | ||||||||
| Gold Bugs Index (HUI) | 701.49 | 746.55 | (7.0)% | 6.4% | down (weak) | up (weak) | up | |
| TSX Gold Index (TGD) | 817.76 | 855.59 | (6.5)% | 4.6% | down | up (weak) | up | |
| Bonds% | ||||||||
| U.S. 10-Year Treasury Bond yield | 4.17% | 4.61% | 5.7% | 4.6% | ||||
| 3.3Cdn. 10-Year Bond CGB yield | 3.44% | 3.69% | 6.0% | 7.3% | ||||
| Recession Watch Spreads | ||||||||
| U.S. 2-year 10-year Treasury spread | 0.69% | 0.52% | 13.0% | (24.6)% | ||||
| Cdn 2-year 10-year CGB spread | 0.85% | 0.63% | 1.6% | (25.9)% | ||||
| Currencies | ||||||||
| US$ Index | 98.26 | 99.29 | 1.5% | 1.1% | up (weak) | down | down | |
| Canadian $ | 72.87 | 72.69 | (0.5)% | (0.3)% | neutral | up | neutral | |
| Euro | 117.48 | 116.22 | (1.4)% | (1.1)% | down (weak) | up | up | |
| Swiss Franc | 126.21 | 127.11 | (1.3)% | 1.1% | neutral | up | up | |
| British Pound | 134.78 | 133.16 | (2.3)% | (1.2)% | down | up | up | |
| Japanese Yen | 63.83 | 62.98 | (1.3)% | (1.3)% | neutral | down | down | |
| Precious Metals | ||||||||
| Gold | 4,311.97 | 4,538.39 | (3.8)% | 5.3% | down | up | up | |
| Silver | 71.16 | 75.94 | (5.5)% | 6.7% | up | up | up | |
| Platinum | 124.81 | 1,978.10 | (4.2)% | (3.4)% | down (weak) | up (weak) | up | |
| Base Metals | ||||||||
| Palladium | 1,619.50 | 1,426.50 | (4.9)% | (11.9)% | down | neutral | up | |
| Copper | 5.64 | 6.23 | (0.1)% | 10.4% | up | up | up | |
| Energy | ||||||||
| WTI Oil | 57.44 | 105.97 | 11.7% | 84.5% | up | up | up | |
| Nat Gas | 3.71 | 2.97 | 8.0% | (20.0)% | up | down | neutral | |
Copyright David Chapman 2026
__
(Featured image by sergeitokmakov via Pixabay)
DISCLAIMER: This article was written by a third party contributor and does not reflect the opinion of Born2Invest, its management, staff or its associates. Please review our disclaimer for more information.
This article may include forward-looking statements. These forward-looking statements generally are identified by the words “believe,” “project,” “estimate,” “become,” “plan,” “will,” and similar expressions, including with regards to potential earnings in the Empire Flippers affiliate program. These forward-looking statements involve known and unknown risks as well as uncertainties, including those discussed in the following cautionary statements and elsewhere in this article and on this site. Although the Company may believe that its expectations are based on reasonable assumptions, the actual results that the Company may achieve may differ materially from any forward-looking statements, which reflect the opinions of the management of the Company only as of the date hereof. Additionally, please make sure to read these important disclosures.
David Chapman is not a registered advisory service and is not an exempt market dealer (EMD) nor a licensed financial advisor. He does not and cannot give individualised market advice. David Chapman has worked in the financial industry for over 40 years including large financial corporations, banks, and investment dealers. The information in this newsletter is intended only for informational and educational purposes. It should not be construed as an offer, a solicitation of an offer or sale of any security. Every effort is made to provide accurate and complete information.
However, we cannot guarantee that there will be no errors. We make no claims, promises or guarantees about the accuracy, completeness, or adequacy of the contents of this commentary and expressly disclaim liability for errors and omissions in the contents of this commentary. David Chapman will always use his best efforts to ensure the accuracy and timeliness of all information. The reader assumes all risk when trading in securities and David Chapman advises consulting a licensed professional financial advisor or portfolio manager such as Enriched Investing Incorporated before proceeding with any trade or idea presented in this newsletter.
David Chapman may own shares in companies mentioned in this newsletter. Before making an investment, prospective investors should review each security’s offering documents which summarize the objectives, fees, expenses and associated risks. Although Artificial Intelligence (AI) may be deployed from time to time, AI output is monitored and adjusted, if necessary, for accuracy. David Chapman shares his ideas and opinions for informational and educational purposes only and expects the reader to perform due diligence before considering a position in any security. That includes consulting with your own licensed professional financial advisor such as Enriched Investing Incorporated. Performance is not guaranteed, values change frequently, and past performance may not be repeated.


Avant Devices Moves Toward Electric Wheelchair Kit Production with New Funding Drive
Murcia-based Avant Devices is seeking €260,000 in crowdfunding to launch mass production of its electric wheelchair conversion kit. The funds...


Legend Biotech: Growth Driven by CAR-T Innovation and Carvykti Expansion
Legend Biotech's stock reflects demand for innovative CAR-T cancer therapies. The US biotech focuses on commercializing Carvykti with partner Janssen...


Senegal’s Debt Strategy: Choosing Between Restructuring and Financial Innovation
Senegal’s upcoming choice of debt advisor, with Lazard reportedly leading the race, reflects a broader strategic decision. Rather than pursuing...


Pictet Raises $253 Million for Environmental Investment Fund
Pictet Group closed its Environment Co-Investment Fund I at $253 million, surpassing its $200 million goal. The Article 8 SFDR...


Virginia Cannabis Market Could Reshape Regional Competition
Virginia’s planned recreational cannabis market could reshape the Washington region’s economic landscape. With nine million residents, it may draw consumers...
 |
|
 |  |
 |
|
-

 Business7 days ago
Jobs Cooling Fast as a Cautious Fed Leaves Markets Without a Safety Net
-

 Business2 weeks ago
EU Budget for 2028–2034: Rising Pressures Drive Debate on New European Taxes
-

 Cannabis5 days ago
Cannabis Regulation in Germany and Switzerland Shows Early Benefits of Legalization Models
-
 Crypto2 weeks ago
Crypto Markets Shaken by Geopolitics and Industry Tensions