Markets
Markets Rally Amid Uncertainty and a Widening K-Shaped Economy
Markets hit new highs despite geopolitical uncertainty and shifting tensions in the Gulf. Liquidity and strong corporate profits drive gains, reflecting a widening wealth gap in a “K economy.” Stocks appear overbought and vulnerable to reversal if conditions change. Meanwhile, gold shows strength, silver and mining stocks gain favor, and oil remains volatile.
Peace in our time. Or so we are led to believe? Happy days are here again. The stock market is making all-time highs, again. All must be good. Yes, Iran and the U.S. are talking again and suggesting the ceasefire will be extended. Even the Strait of Hormuz is to be opened again. Or is it? At least until the end of the ceasefire. Even Lebanon/Israel are proposing a ceasefire. But without Hezbollah?
The U.S. has begun a blockade of the Strait of Hormuz and sends 10,000 more troops to the region. Build-up? Then they announce Iran had better sign the deal or else. Then it’s announced by Iran the strait will be open again. Then just as quickly it’s closed again. Which is it?
It’s war, but the stock markets keep going up
The war has been going on for some 50 days. The Strait of Hormuz is still closed – or maybe it’s open – depending on who one talks to. Billions of dollars of damage have been done to infrastructure and economies of countries in the Persian Gulf region. Refineries, storage depots, and gas facilities have all been damaged. Economic losses are also in the hundreds of billions. Structural damage is in the billions.
Even the tourism industry has been hit with cruise boats stuck behind the strait, and airlines have suffered considerable disruption with tourists no longer travelling. Even if all this were over tomorrow, the damage done will take months, maybe years to repair. And the impact of high oil prices will linger, whether or not there is peace in our time.
This time is different. Or so we are being led to believe. But a closer examination shows that the financial system, rather than being tightened and drained, is expanding again and all that money sloshing around must go somewhere. The stock market is supposed to be a barometer for the economy. Usually, we see the stock market falling in advance of an incoming recession. Not this time, it seems. The stock market is signaling that everything is just fine.
Even the recent declines were minimal. The S&P 500 fell 9.8%, not even in correction territory. Now it’s making new all-time highs. The others did fall into correction territory with the Dow Jones Industrials (DJI) down 10.7%, the Dow Jones Transportations (DJT) down 12.9% then roaring back to new all-time highs, and the NASDAQ falling 13.8%.
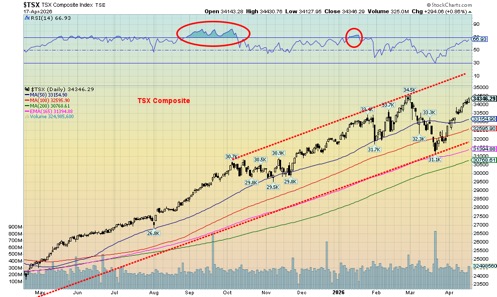
The TSX fell short, off 9.9% at its lowest. Now we are approaching overbought territory, so could we make what might be a double top for some? Or are we just going to charge higher? The DJI has been the weakest on this rebound. That’s a sign that this market has become more speculative.
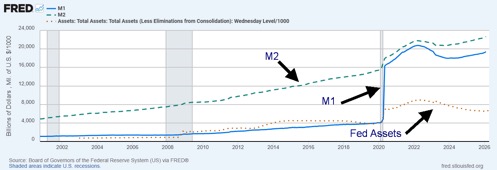
Money is sloshing around, with the residual effects of the 2020/2021 bailout of the financial system still being felt. Fed tightening vs. the inflation of 2022 did little damage to the money supply. Since 2025, M1 is up 5.5% as is M2. The Fed balance sheet contracted 2.3% but recently has started to grow again. That’s not tightening.
The money must go somewhere, so into the stock market it goes. Trading activities at the major bank dealer firms have led to huge profits. Q4 2025 saw record profits reported by U.S. corporations and banks. Maybe we won’t see the effects of this war until later. Or maybe we’ll never see its effects. Party on.
Money Supply M1, M2 plus Fed Assets 2000–2026
It’s no surprise that debt just keeps on rising as well. U.S. government debt is up 8% or $2.9 trillion. The U.S. is running budget deficits of upwards of $2 trillion annually. Margin debt is just below its all-time high, last reported at $1.25 trillion (its peak was $1.28 trillion). If the stock market is our barometer of the health of the economy, then we are doing great. Or are we? Check out our chart of the week.
Chart of the Week
The K Economy – S&P 500 vs. Michigan Sentiment Index 2016–2026
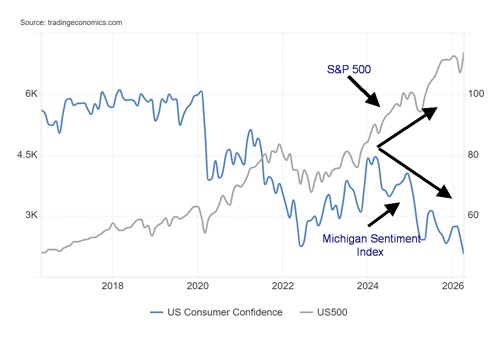
It’s the K economy: two different parts of the economy or different groups diverging from one another, thus forming what looks like a K. Our favourite and one we believe to be the most visible is the rising stock market, once again making new all-time highs even as consumer sentiment hits all-time lows. Either we have a booming economy, or a sinking economy. Can it be both?
If this chart was an illustration of a third-world economy where the wealthy hold most everything and everyone else barely survives, it might be normal. But this is the U.S. today. High-income and high-wealth households own stocks and real estate. They benefit from low interest rates, even inflation, that help raise asset prices and their spending power continues to be high.
Meanwhile, the middle- and lower-income groups with fewer assets often face higher debt in proportion to their income, are more susceptible to job losses, are more likely to face delinquency, and feel the impact of higher inflation on everyday items. As a result, their financial situation weakens, even as the economy appears to be still doing well. This is the situation today in the U.S. and to a lesser extent in other developed economies. In the U.S. today, credit card and student loan delinquencies are rising, as are mortgage defaults, auto loans, particularly subprime auto loans, and home equity loans. Canada too is facing a similar phenomenon.
Maybe it comes as a surprise, but the upper half, particularly the top 20%, are holding up consumer spending that helps GDP stay positive. As to the lower half, they are more frequently dipping into savings and using credit cards for everyday purchases. All this has been more pronounced, particularly since the pandemic. We also see it in the top industries of high-tech and finance that thrive while the retail and service sectors struggle. This growing inequality has been noted by central bank heads, including the U.S. Federal Reserve and the Bank of Canada.
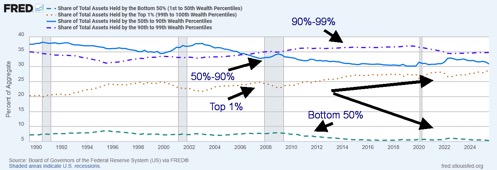
This is illustrated in the following chart that shows the share of total assets held by various percentiles. Since 2000, the share held by the 1% of households has gone up 4.4% points or 18%, the share held by the 90%–99% of households has gone up 1.4% points or 4.2%, the share held by the 50%–90% percentile has fallen 4% points or 11.5%, while the bottom 50% has seen their share fall 1.9% points or 26%. The rich get richer and everyone else feels poorer.
Depending on which percentile you are in, you have access to high-paying jobs, your wages are growing, and your assets are growing, thanks to a rising stock market and real estate. Despite the pullback in real estate, the top groups continue to grow. The chart shows how the share of assets of the 1% is rising, in contrast to the bottom 50% whose share is falling.
Share of Total Assets Held By – Top 1%, 90%–99%, 50%–90%, Bottom 50% (1989–2025)
While the chart shows the pronounced difference between the top 1% and the bottom 50%, note that the Forbes World’s Billionaires List (forbes.com/billionaires) lists 20 billionaires worth $100 billion or more. Leading the pack is Elon Musk, worth an estimated $839 billion. Soon to become the world’s first trillionaire?
According to Worldometer (www.worldometers.info), that would make Elon Musk the 23rd largest economy in the world, just behind Taiwan but ahead of Ireland. Other significant names on the list include Larry Page (Google), Sergey Brin (Google), Jeff Bezos (Amazon), Larry Ellison (Oracle), and Mark Zuckerberg (Meta). Yes, Warren Buffett (Berkshire Hathaway) is there too. President Donald Trump is listed as #645. There is a total of 3,332 billionaires listed or 0.004% of the world population.
U.S. Corporate Profits vs. U.S. Consumer Household Debt 2016-2026
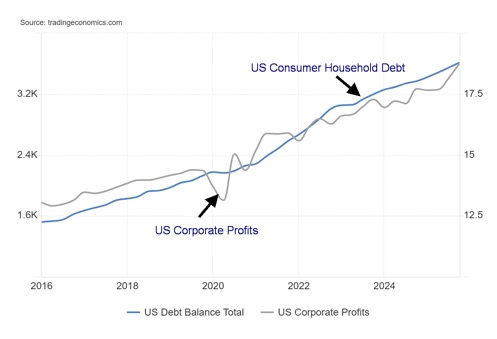
Corporate profits are at record highs. But consumer debt is also at record highs.
Stocks
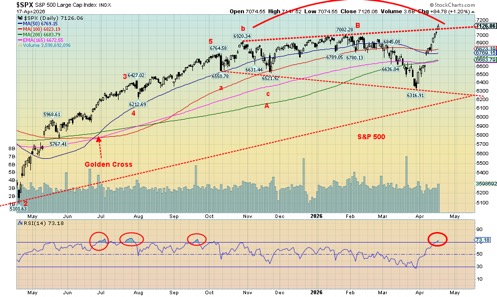
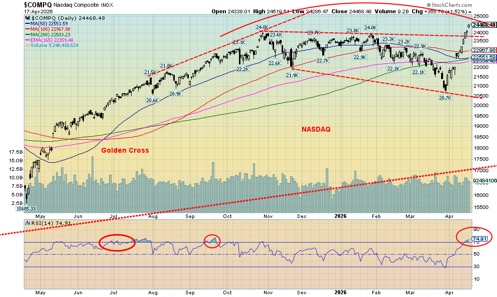
Everything is hunky dory. Happy days are here again. War in the Middle East? Rising oil prices? Piffle. Party like it’s 1999. The S&P 500, the NASDAQ, and the Dow Jones Transportations (DJT) all made all-time highs this past week, ignoring the chaos in the Middle East. It doesn’t matter. Corporate profits are at record highs. That’s the real issue. Also making all-time highs were the S&P 400 (Mid), the S&P 600 (Small), the Russell 1000, 2000, 3000, the NASDAQ 100, the S&P 100 (OEX), and the Dow Jones Composite (DJC). Notably, the Dow Jones Industrials (DJI) did not. A divergence?
It seems bizarre that we are here making all-time highs. The war has not ended, the Strait of Hormuz is still closed, valuations are elevated, and complacency remains high. The VIX Volatility Index closed at 17.48 on Friday. Anything under 20 is considered a complacent market. The long-term average is between 18–22. The CNN Fear & Greed Index is registering greed.
Ceasefires are not treaties. Already, things are starting to look like they may unravel in the Gulf. Markets tend to overreact at market lows and underreact at market highs. There is tension and things could quickly come apart. The market is overconfident. We saw that in 2007 as well. And while the focus is on the Middle East, the problems in the private equity/credit market are mounting.
On the week, the S&P 500 rose 4.5%, the DJI was up 3.2%, the DJT was up 10.2%, and the NASDAQ was up 6.8%. The S&P 400 (Mid) was up 3.5% and the S&P 600 (Small) gained 4.0%. The S&P 500 Equal Weight Index rose 3.3% but has not made new all-time highs. The NY FANG Index rose 7.1% but it too did not reach new all-time highs. Bitcoin rose 5.8% but remains down in 2026 by 11.5%, despite the recent gains.
In Canada, the TSX Composite rose 1.9% but no new highs. The TSX Venture Exchange (CDNX) was up 6.3%. In the EU, the London FTSE gained 0.6%, the EuroNext was up 2.7% to new all-time highs, the Paris CAC 40 was up 3.8%, and the German DAX gained 1.0%. In Asia, China’s Shanghai Index (SSEC) was up 2.0%, the Tokyo Nikkei Dow (TKN) gained 1.0% to new all-time highs, Hong Kong’s Hang Seng (HSI) was up 1.3%, while India’s Nifty Fifty made all-time highs, up 1.9%.
While many of the high-tech stocks including the MAG7 enjoyed a good up week, only one, Advanced Micro (AMD), made all-time highs. Tesla (TSLA) was a big winner, up 14.8%, adding to Elon Musk’s vast wealth. Even Trump Media (DJT) jumped 9.3% and MAGS was up 8.7%.
In Canada, two subindices made all time highs: Income Trusts (TCM), up 1.9%, and Financials (TFS), up 4.4%. The big winner on the week was Information Technology (TTK), up 13.7%, while the biggest loser was Energy (TEN) down 5.9%. Utilities (TUT) also lost down 2.3%. The TSX 60 made all-time highs, but the broader TSX Composite did not.
Is the stock market destined to go higher? We did break out of what appeared to be the formation of broadening pattern. These megaphone-type patterns are typically quite bearish. But does the breakout negate the pattern? Follow-through says yes. Failure to follow through suggests a possible false breakout. The RSI and other indicators are registering overbought. But the market can stay that way for a time. A move back under 7,000 for the S&P 500 would be negative. For the NASDAQ, a move back under 23,000 signals a possible top. Better is for the S&P 500 to drop back under 6,800 and the NASDAQ under 22,300.
This market looks calm on the surface. But underneath there is a lot of rot. Caveat emptor.
Bonds
Bond yields slipped this week on news of a possible opening of the Strait of Hormuz. Despite the drop, it is unclear whether bond yields have more downside potential. The 10-year U.S. Treasury note fell to 4.25% from 4.34% while the 10-year Government of Canada bond (CGB) fell to 3.45% from 3.47%. Resistance is now up at the recent highs of 4.44% for the U.S. 10-year and near 3.60% for the Canada 10-year. Regardless of these gyrations, the odds of a rate cut at the Fed meetings on April 28–29 is slim to none. The BofC also announces its decision on April 29. The odds of a cut are low, but we’ve heard the BofC might do it anyway. But they probably won’t raise rates either until they see more evidence to support that move.
The big story is the end of Jerome Powell’s tenure on May 15. Powell has made it clear he intends to stay on past May 15 if the criminal investigation into him and the Fed is still ongoing. President Trump wants to fire him even as he has no legal means to do so. Hearings for his replacement Kevin Warsh starts on April 21.
Already there is evidence that Warsh may have a difficult time getting confirmed. Any removal of Jerome Powell could set up a firestorm as markets would perceive it quite negatively. The Fed is by design an independent body. Anything that threatens its independence could set up a bond disaster as investors flee.
Gold and silver
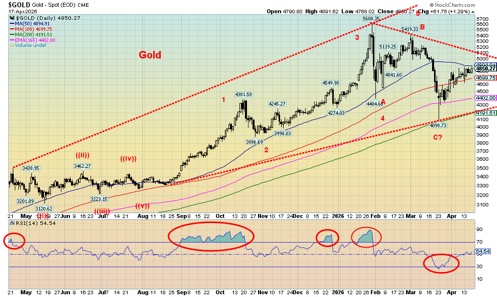
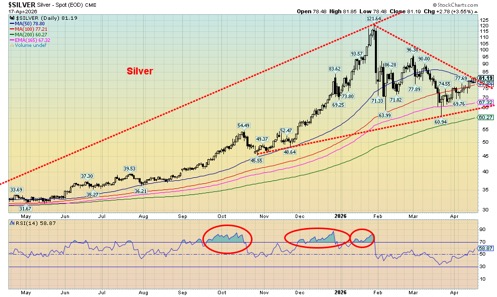
Gold is still working its way through a prolonged corrective phase. But gold is also being battered back and forth by the news from Gulf. The Strait of Hormuz is open: gold up. The Strait of Hormuz is closed: gold down. After bottoming out in March at $4,098, gold is up 18.3% but remains down 13.5% from the all-time high of $5,608. Silver the same – up 33.2% from the March low but still down 33.3% from the all-time high of $121.64. Is the glass half full, or half empty? Overall, the trend remains up.
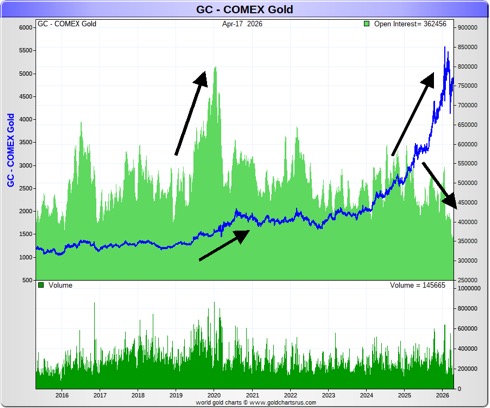
Also helping gold was a weaker US$ Index and slightly lower longer-dated bond yields. Then there’s the debt and the increasingly shaky private equity/credit market. Something else that is interesting is the open interest on the COMEX has been falling, even as gold prices have gone up. Usually, they go up in tandem. What this tells us is that gold prices are rising without the usual paper gold that drives speculation and leverage. If that is correct, then once we come out of this corrective period we should rise once again.
Physical buying is strong buying. Paper gold buying is normally speculative and for leverage. Volume needs to pick up as well. Right now, the speculators are hesitating, but gold is rising without them.
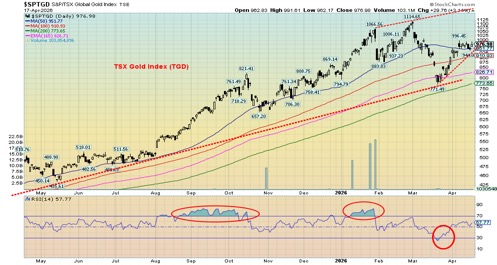
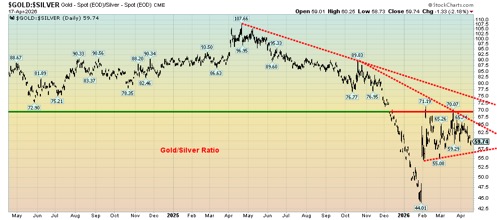
Another positive thing we see is that the gold/silver ratio has started to fall once again in favour of silver. If we are to go higher, then we need silver to lead. Ditto with the gold stocks where the Gold/HUI ratio is also falling in favour of the gold stocks. These are all positive signs, suggesting to us gold will resume its leadership and bull market once this corrective phase is over.
Comex Gold vs. Open Interest 2015–2026
On the week, gold rose 2.1%, silver was up 6.6%, and platinum rose 3.1%. Of the near precious metals, palladium was up 2.4% and copper is once again over $6 up 3.9% on the week. The gold stocks were mixed with the Gold Bugs Index (HUI) up 1.2% and the TSX Gold Index (TGD) down 0.1%. Most of the drop for the gold stocks was recorded early in the week, and then they struggled back to break-even.
Gold needs to break out over $5,100 to suggest a low is in and over $5,250 to suggest new highs. Silver could be on the cusp of breaking resistance at $62, but we need to get over $107.50 to suggest new highs. The TGD over 1,000 looks better and over $1,050 suggests new highs ahead.
Gold has endured a sharp correction that sent it into bear market territory. At its low gold was down 27%, silver down 50%, the HUI down 31.7%, and the TGD down 30.8%. Down over 20% is considered a bear market. None of it is unusual as in previous run-ups in 1976–1980 and in 2001–2011 we had numerous corrections, some of which slipped into bear market territory. We remain hopeful our read on the gold market is right and a new strong up wave is to come. Watch the gold/silver ratio. A break under 55 suggests we are on our way to new lows in favour of silver.
Gold/Silver Ratio
Oil and gas
Are we open, or are we closed? That is the question. The U.S. announces a blockade on the blockade. Iran says the Strait of Hormuz is open, but only until the ceasefire lasts (it ends this Wednesday, April 22). Markets rejoice. Oil plummets. Then that thought is barely in our minds when the U.S. says the blockade is still on, Iran closes the strait again, and stories of ships being fired upon emerge. The only thing certain is that whatever is said one moment is reversed the next. They could even extend the ceasefire, giving oil another tumble and markets an upward jolt.
It’s like the wild and woolly west – you never know what’s going to happen next. Oh yes, and the Strait of Hormuz may be open, but will any insurance company in their right mind ensure ships passing through. ^NOT likely.
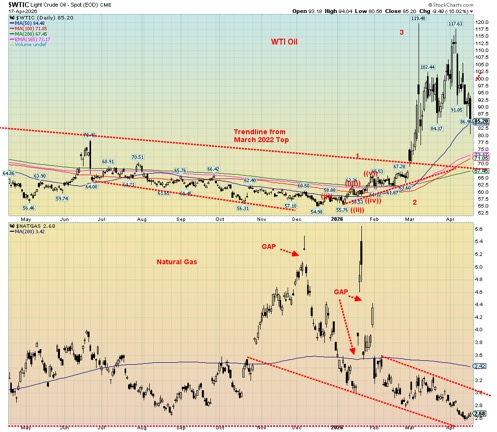
It’s a whipsaw market. Up one moment, reversed, and down the next. Despite all the craziness, the trend of oil prices is up. That is, until it isn’t. WTI oil fell a nearly 10% on Friday, thanks to Iran saying the Strait of Hormuz was open. WTI ended the week down 10.9%. Brent crude followed, down 7.6% on Friday, but managed to stay somewhat afloat, down only 3.9% on the week. Oil wasn’t the only craziness on the week as natural gas (NG) made 52-week lows but then managed to eke out a gain of 1.1%. Not so lucky was EU NG at the Dutch Hub that fell 10.5% on the week.
The energy stock indices threw their hands up in despair as the ARCA Oil & Gas Index (XOI) fell 4.8% while the TSX Energy Index (TEN) dropped 5.9%. However, the Gold/Oil ratio benefitted, jumping 15.7% as gold outpaced oil.
Friday’s drop for WTI saw it rebound off the 50-day MA. Will it act as support? Given all the news of the Strait of Hormuz open vs the Strait of Hormuz closed, the likelihood is we will rebound off the 50-day MA. The trend is still up. Damage in the Gulf region will take billions of dollars and months to years to repair. Insurance companies are not likely to rush back in. They may say the strait is open, but in reality, it is closed, no matter how many times they say open.
The ceasefire ends Wednesday. Then what? The president is vociferous that a deal is at hand. Iran initially silent, then indicates a deal is nowhere near. The U.S. accuses Iran of breaking the ceasefire. The odds of deal, we believe, is slim to none.
As it stands now, a rebound that takes us back over $100 could most likely signal another wave up. If the 50-day MA fails (50-day MA closed on Friday at $84.48. WTI closed at $85.20), then we could fall to $80. Don’t count on it. NG has a lot more work to do. First, it must hold the lows at $2.65, and then on a strong rebound take out $3.00. Even then, we need to get above $3.50 to convince us NG is on the way up again.
Oil may be wild and woolly for traders, but for investors the message is: stay long. This ain’t over by any stretch.
Markets and Trends
| % Gains (Losses) Trends | ||||||||
| Close Dec 31/25 | Close Apr 17/26 | Week | YTD | Daily (Short Term) | Weekly (Intermediate) | Monthly (Long Term) | ||
| S&P 500 | 6,845.50 | 7,126.06 (new highs) * | 4.5% | 4.1% | up | Up | up | |
| Dow Jones Industrials | 48,063.29 | 49,447.43 | 3.2% | 3.9% | up | up | up | |
| Dow Jones Transport | 17,357.19 | 22,422.08 (new highs) * | 10.2% | 29.2% | up | up | up | |
| NASDAQ | 23,241.99 | 24,468.08 (new highs) * | 6.8% | 5.3% | up | up | up | |
| S&P/TSX Composite | 31,712.76 | 34,346.29 | 1.9% | 8.3% | up | up | up | |
| S&P/TSX Venture (CDNX) | 987.74 | 1,054.91 | 6.3% | 6.8% | up | up | up | |
| S&P 600 (small) | 1,467.76 | 1,648.19 (new highs) * | 4.0% | 12.3% | up | up | up | |
| ACWX MSCI World x US | 67.18 | 74.47 (new highs) * | 3.0% | 10.9% | up | up | up | |
| Bitcoin | 87,576.98 | 77,522.09 | 5.8% | (11.5)% | up | down | neutral | |
| Gold Mining Stock Indices | ||||||||
| Gold Bugs Index (HUI) | 701.49 | 855.71 | 1.2% | 22.0% | up | up | up | |
| TSX Gold Index (TGD) | 817.76 | 977.36 | (0.1)% | 19.5% | up | up | up | |
| % | ||||||||
| U.S. 10-Year Treasury Bond yield | 4.17% | 4.25% | (2.1)% | 1.9% | ||||
| 3.3Cdn. 10-Year Bond CGB yield | 3.44% | 3.45% | (0.6)% | 0.3% | ||||
| Recession Watch Spreads | ||||||||
| U.S. 2-year 10-year Treasury spread | 0.69% | 0.54% | 1.9% | (21.7)% | ||||
| Cdn 2-year 10-year CGB spread | 0.85% | 0.65% | (4.4)% | (23.5)% | ||||
| Currencies | ||||||||
| US$ Index | 98.26 | 98.18 | (0.5)% | (0.1)% | down | neutral | down | |
| Canadian $ | 72.87 | 73.09 | 1.1% | 0.3% | up | up | neutral | |
| Euro | 117.48 | 117.68 | 0.3% | 0.2% | up | up | up | |
| Swiss Franc | 126.21 | 127.98 | 1.0% | 1.4% | up (weak) | up | up | |
| British Pound | 134.78 | 135.17 | 0.4% | (0.1)% | up | up | up | |
| Japanese Yen | 63.83 | 63.05 | 0.5% | (1.2)% | neutral | down | down | |
| Precious Metals | ||||||||
| Gold | 4,311.97 | 4,850.27 | 2.1% | 12.5% | neutral | up | up | |
| Silver | 71.16 | 81.19 | 6.6% | 14.1% | neutral | up | up | |
| Platinum | 124.81 | 2,119.00 | 3.1% | 3.5% | up (weak) | neutral | up | |
| Base Metals | ||||||||
| Palladium | 1,619.50 | 1,576.00 | 2.4% | (2.7)% | neutral | up (weak) | up | |
| Copper | 5.64 | 6.08 | 3.9% | 7.8% | up | up | up | |
| Energy | ||||||||
| WTI Oil | 57.44 | 85.20 | (10.9)% | 48.3% | neutral | up | up | |
| Nat Gas | 3.71 | 2.68 (new lows) | 1.1% | (27.8)% | down | down | down (weak) | |
__
(Featured image by RDNE stock project via Pexels)
DISCLAIMER: This article was written by a third party contributor and does not reflect the opinion of Born2Invest, its management, staff or its associates. Please review our disclaimer for more information.
This article may include forward-looking statements. These forward-looking statements generally are identified by the words “believe,” “project,” “estimate,” “become,” “plan,” “will,” and similar expressions, including with regards to potential earnings in the Empire Flippers affiliate program. These forward-looking statements involve known and unknown risks as well as uncertainties, including those discussed in the following cautionary statements and elsewhere in this article and on this site. Although the Company may believe that its expectations are based on reasonable assumptions, the actual results that the Company may achieve may differ materially from any forward-looking statements, which reflect the opinions of the management of the Company only as of the date hereof. Additionally, please make sure to read these important disclosures.
Copyright David Chapman 2026
David Chapman is not a registered advisory service and is not an exempt market dealer (EMD) nor a licensed financial advisor. He does not and cannot give individualised market advice. David Chapman has worked in the financial industry for over 40 years including large financial corporations, banks, and investment dealers. The information in this newsletter is intended only for informational and educational purposes. It should not be construed as an offer, a solicitation of an offer or sale of any security. Every effort is made to provide accurate and complete information.
However, we cannot guarantee that there will be no errors. We make no claims, promises or guarantees about the accuracy, completeness, or adequacy of the contents of this commentary and expressly disclaim liability for errors and omissions in the contents of this commentary. David Chapman will always use his best efforts to ensure the accuracy and timeliness of all information. The reader assumes all risk when trading in securities and David Chapman advises consulting a licensed professional financial advisor or portfolio manager such as Enriched Investing Incorporated before proceeding with any trade or idea presented in this newsletter.
David Chapman may own shares in companies mentioned in this newsletter. Before making an investment, prospective investors should review each security’s offering documents which summarize the objectives, fees, expenses and associated risks. Although Artificial Intelligence (AI) may be deployed from time to time, AI output is monitored and adjusted, if necessary, for accuracy. David Chapman shares his ideas and opinions for informational and educational purposes only and expects the reader to perform due diligence before considering a position in any security. That includes consulting with your own licensed professional financial advisor such as Enriched Investing Incorporated. Performance is not guaranteed, values change frequently, and past performance may not be repeated.


Morocco’s Budget Execution June 2026: Deficit Narrows to 20.2 MMDH
Morocco’s Finance Law execution at end-June 2026 shows a reduced budget deficit of 20.2 billion dirhams, down from 24.9 billion...


Tilray Brands Hits Multi-Year Lows as Cannabis Investors Await Regulatory Clarity
Tilray Brands shares have fallen 57% this year amid cannabis sector weakness and uncertainty over US regulatory reform. While potential...


Ethereum Between ETF Inflows, Price Risks and a Strong July
Ethereum faces mixed signals as ETF inflows and a strong July performance support recovery, while technical resistance and downside risks...


Mercedes-Benz Accelerates EV Decarbonization With Recycled Aluminum
Mercedes-Benz expands its partnership with Hydro to accelerate supply chain decarbonization. Future electric vehicles will use Hydro CIRCAL aluminum containing...

Evotec and BioGaia Boost Biotech, while Vitrolife Disappoints
European stocks moved on earnings and broker actions. Evotec, BioGaia, Plus500, Pharming, Inwido, Amundi and Julius Baer rallied on upgrades,...
 |
|
 |  |
 |
|
-

 Cannabis5 days ago
Namibia Cannabis Activists Seek Political Path After Legal Setbacks
-
 Crypto2 weeks ago
Bitcoin, and Ethereum Rise, While Cardano Enters Transition
-

 Crowdfunding2 days ago
Urbanitae Drives Spain’s Real Estate Crowdfunding Boom with Record Growth and Investor Returns
-

 Impact Investing1 week ago
Swisscanto Launches Catastrophe Bond Fund for Portfolio Diversification