Markets
Stock Markets Soar Despite War, Echoing Past Market Peaks
The Persian Gulf war is driving volatility in oil and gold, while stock markets surge toward record highs, raising concerns of a melt up. Strong US jobs data contrasts with weaker Canada figures and underlying weakness. Historical parallels suggest risk, as similar rallies ended poorly. Divergence in Dow and suspicious oil trades add uncertainty overall.

War one day. Peace the next. Welcome to the new world of volatility. One day ships are being guided through the Strait of Hormuz, the next day it’s all off, pending a peace deal. Trump says a deal is close. Iran is pondering. It’s a war of attrition. Threaten one day, then back off the next. This is the situation right now as we are stuck between war and peace. It could shift either way on any given day.
But the reality is that since February 28, 2026, when this war broke out, WTI oil is up almost 42%, while Brent crude is up 40%. Not to be outdone, natural gas (NG) is up by 37% at the EU Dutch Hub but at the U.S. Henry Hub it’s down roughly 5%. The EU is more dependent on NG from the Gulf whereas the U.S. and North America have ample supplies of NG.
As a result of all of this, gas prices at the pump have jumped sharply. U.S. gas prices are up at least 40% since the war broke out while in Canada, they’re up around 42%, depending on where you live. War and the closing of the Strait of Hormuz have consequences. Not to be overlooked are food prices. Food inflation was last recorded for March 2026 year over year (y-o-y) as up 2.7% in the U.S. and up 4.4% in Canada. That is mostly in line with the rise in the CPI, last reported as 3.3% y-o-y for the U.S. and 2.4% for Canada.
Canada imports some 30% of its foods, particularly fruits, vegetables, and processed goods. The U.S., despite having major food-growing regions, still imports some 20%. Key U.S. imports include fruits, vegetables, seafood, and coffee. Food faces numerous issues including increased production costs due to fuel, fertilizers, and labour. Another threat is climate change that sparks droughts, floods, and frost. Input costs, besides rising prices for fuel and fertilizers, also include equipment.
Then there are supply chain disruptions and rising shipping costs. Also playing a role are currency fluctuations along with tariffs, particularly in the U.S. Corporate profits play a role too, particularly in Canada where five large chains dominate the landscape: Weston’s (Loblaws), Empire (Sobeys), Metro, Costco, and Walmart.
The following chart shows how much certain energy and agricultural products have gone up since February 28, when the Iran war started. The energy and agricultural products are components of the CRB Index. The CRB Index alone is up 28% with energy, which comprises 39% of the index, leading the way. All that is left out of the chart is metals (gold, silver, copper, aluminum, and nickel) which comprise 20% of the index.
| Commodity | Gain (Loss) since February 28, 2026 (as of May 6, 2026) |
| CRB Index | 28% |
| Energy | |
| WTI Oil | 42% |
| Brent Crude | 40% |
| Henry Hub Natural Gas | (5)% |
| EU Dutch Hub Natural Gas | 37% |
| Heating Oil | 46% |
| Gasoline | 50% |
| Agricultural | |
| Coffee | 2.5% |
| Cocoa | 43% |
| Corn | 4% |
| Cotton | 27% |
| Lean Hogs | (4.3)% |
| Live Cattle | 9% |
| Orange Juice | (2.8)% |
| Soybeans | 2% |
| Sugar | 6% |
| Wheat | 1.2% |
The Bloomberg Grains Sub Index is shown on the next page. Since February 28, the index is up 7% but from that low in August 2025 the index has gained almost 26%. That feeds directly into food inflation. The index is in a clear uptrend, although it could face periodic pullbacks towards that uptrend line. A break from it would be more meaningful.
Food inflation is a problem. Generally, the cost of food has increased some 35% since the pandemic. Food is an essential. Rising prices create uncertainty, insecurity, and reduced affordability. As well, rising fuel and processing costs ensure that food prices stay high. Grocery prices are generally outpacing the rate of inflation. That reduces purchasing power, which has already been hit by sharply rising fuel prices.
It’s not just Canada and the U.S. that have been hit by this problem – it’s a global issue and in some developing countries a bigger problem than here in North America. As a result, diets change, not necessarily for the better, and searching for deals in food stores becomes an endless quest.
Food inflation is here to stay.
Bloomberg Grains Spot Sub Index 2025–2026
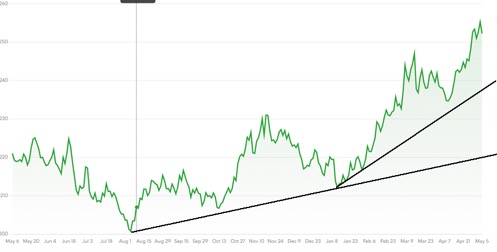
Chart of the week
US Jobs Report
Employed Persons vs. Unemployed Persons (2016–2026)
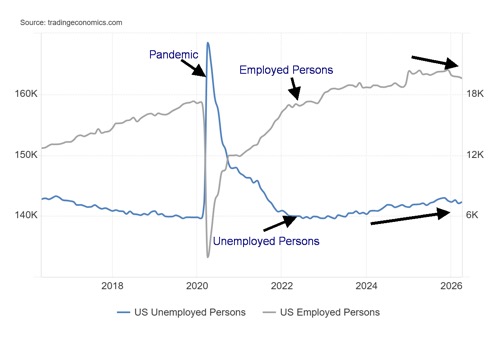
The U.S. labour market continues to surprise on the upside. But dig a little deeper and things aren’t quite as rosy. The reason lies in the difference between the establishment survey, which publishes the non-farm payrolls by counting payroll records, with the household survey, which contacts people.
The April nonfarm payrolls were reported as a gain of 115,000. That’s interesting, considering the civilian labour force reported a loss of 92,000 people. The gain added to the strongest two-month gain since 2024. The previous month, nonfarm rose by an upward revised 185,000, where the market had expected a gain of only 62,000.
The employment level fell by 226,000 with full-time employment down 224,000, while part-time employment rose 123,000. The unemployment level rose 134,000. That alone seemed to fly in the face of the rosy nonfarm payrolls. As no surprise, the labour force participation rate fell to 61.8% from 61.9% and the employment population ratio fell to 59.1% from 59.2%.
Finally, while the unemployment rate (U3) was steady at 4.3%, the U6 unemployment rate (total unemployed, plus all persons marginally attached to the labour force, plus total employed part-time for economic reasons, as a percent of the civilian labour force, plus all persons marginally attached to the labour force) rose to 8.2% from 8.0%.
Go figure. Jobs (nonfarm) increased, even as the labour force contracted (illegals deported?), and the employment level also contracted while the number of the unemployed rose. This is also shown through the drop in the labour force participation rate and the employment population ratio, which indicates fewer people are actually working. Adding to this, we note that the number for those not in the labour force rose 650,000 (this includes retirees, disabled people, and full-time students). We also note the number of multiple job holders rose 77,000.
All this is against the backdrop of a population level (those 16 and over) rising by 97,000. The population level does exclude those in penal institutions, mental facilities, and homes for the aged, or non-active-duty military personnel.
If there was any good news, it was that the average weeks unemployed fell to 24.4 weeks from 25.3 and median weeks unemployed also fell to 12.7 weeks from 12.8. The number for those unemployed 27 weeks or longer fell by 65,000.
On the surface, the report was good (nonfarm rose), but underneath the rot continues. The establishment survey appears to be good, but the household survey suggests otherwise.
Canada Jobs Report
Canada Employed Persons vs. Unemployed Persons (2016–2026)
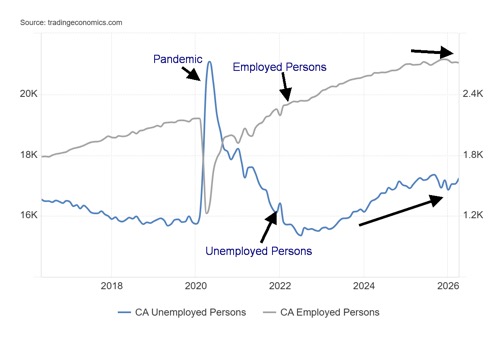
Canada is on a bit of a losing streak. Last month employment fell 17,700. They had expected a gain of 14,100. Full-time employment fell 46,700 while part-time employment gained 29,000. The number of unemployed persons rose 50,000 in the month. Both were well above expectations. The unemployment rate rose to 6.9% from 6.7%.
However, the R8 unemployment rate (plus discouraged searchers, waiting group, portion of involuntary part-timers) fell to 9.4% from 9.6%. All this was the result of more people looking for jobs. The labour force participation rate rose to 65% from 64.9%. However, the employment population ratio went the other way, falling to 61% from 61.8%.
Year over year, Canada’s employment increased by 67,000 but for the first four months of 2026 it has fallen 62,300. Fallout from Trump’s tariffs has played a significant role. The ongoing war against Iran hasn’t helped.
All this is uncertainty for the Bank of Canada (BofC). It could call for another rate cut, but rising inflation could rule against it.
Canada’s labour market continues to show signs of slowing whereas the U.S. shows some strength but behind the scenes things are not quite as rosy. It also leaves the Fed in the same bind as the BofC. A softening labour force says to cut rates, but rising inflation says to hold or even hike rates.
Stocks
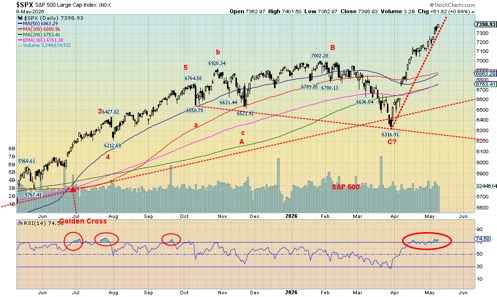
Are we in a bubble? It certainly looks like it. Since that low in March 2026 the S&P 500 has leaped over 17%. Still, we have seen an even better leap. From May 1929 to September 1929 the Dow Jones Industrials (DJI) in its last throes rose 30%. Do we have further to go? That’s speculation. However, many feel we are in a bubble or more politely a melt-up. Call it the AI bubble.
Just like the 1920s bubble, the Nifty Fifty bubble (1972–1973), the dot.com bubble (1998–2000), and the housing bubble (2006–2007). As we noted, we rose 30% in the last hurrah of the 1920s bubble. For the Nifty Fifty bubble, its last hurrah was from October 1972 to January 1973, up 16%. For the dot.com bubble it was from October 1999 to January 2000, up 18%, and for the housing bubble it was from August 2007 to October 2007, up 13.5%. History doesn’t repeat but it does rhyme.
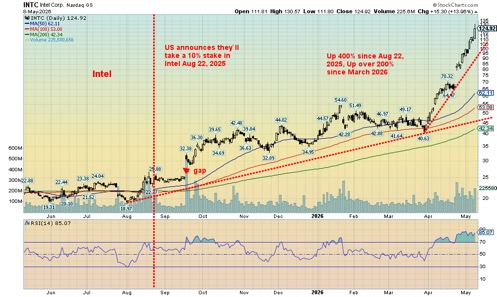
Even more spectacular has the been the rise of Intel since the U.S. government announced they would take a 10% stake in the company back in August 2025. Since then, Intel is up over 400%. But the big move started in March 2026 and since then Intel is up over 200%. The 1929 bubble remains the largest, but, oddly, the last few – Nifty Fifty, dot.com, and housing – bear some resemblance to each other. Will we end the same with a crash? We know what followed the
September 1929 top. But the January 1973 top, the January/March 2000 top, and the October 2007 top all ended in grief as well. Buying up here with RSIs consistently over 70 could be dangerous to your portfolio. But we also can’t say this is over. The bears say raise cash and buy gold. The wild card is oil and the conflict between the U.S./Israel and Iran. We also note a weakening economy, despite the supposed rosy job numbers for April.
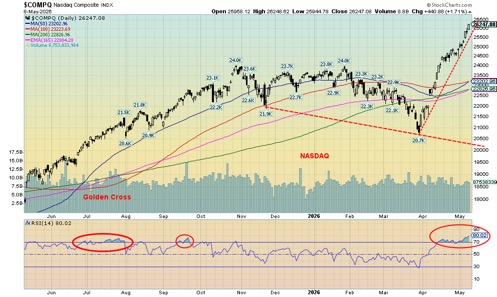
The bubble continues. This past week, hitting new all-time highs were the S&P 500 and the NASDAQ. They rose 2.3% and 4.5% respectively. Not to be outdone, the S&P 400 (Mid) +1.7% and the S&P 600 (Small) +0.6% also hit new all-time highs. So did the S&P 500 Equal Weight Index, up 0.6%, and the NY FANG Index, up 5.4%. Also hitting new all-time highs were the Russell 1000 +3.5%, Russell 2000 +4.9%, and Russell 3000 +9%.
Others joining the party were the S&P 100 (OEX) +3.0% and NASDAQ 100 +5.5%. Notably, not making new all-time highs was the DJI +0.2% and the Dow Jones Transportations (DJT), down 1.9%. A divergence? If so, a significant one but not yet confirmed.
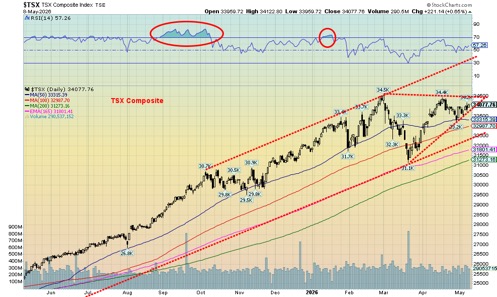
In Canada, the TSX Composite did not make new highs but gained 0.6%. The TSX Venture Exchange (CDNX) was up 0.3%. In the EU, things did not go as well with the London FTSE down 1.3%, the Paris CAC 40 flat, the
German DAX up 0.2%, and the EuroNext up 0.9%. In Asia, China’s Shanghai Index was up 1.6%, the Tokyo Nikkei Dow (TKN) gained 5.4% to new all-time highs while Hong Kong’s Hang Seng (HSI) was up 2.4%. India’s Nifty Fifty was up 0.7%. North America up, Asia up, and the EU mixed.
Of the MAG7 and FAANGs, we note Apple, Amazon, Google, Advanced Micro (AMD), and Broadcom all made all-time highs. AMD was the star, up 26.3%. MAGS also made all-time highs, but Trump Media fell 4.9%. In Canada, only the TSX Financials (TFS) made all-time highs. Ten of the 14 sub-indices were up on the week while four fell. Gold’s (TGD) led, up 9.1%, while Energy (TEN) was the biggest loser, down 3.6%.
It’s been a straight-up move, so it’s hard to tell when this will break down. Greed is still driving the market. For the S&P 500, a break under 7,300 could signal the start of something. Under 7,000 we could be breaking down. For the NASDAQ, the break points are 25,500 and 24,000. The TSX is not making all-time highs but does break under 32,200.
From here on, it’s caveat emptor.
Bonds
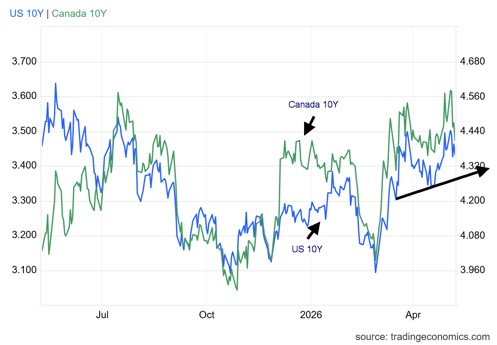
Bonds don’t know which way to go. Oil up usually means bond yields up. But oil down means bond yields down. This past week, oil was down so bond yields fell. The U.S. 10-year Treasury note dropped to 4.36% from 4.38% while the Canadian 10-year Government of Canada bond (CGB) fell to 3.48% from 3.53%. Spreads were largely unchanged although they eased a bit. Also helping bonds were the stronger than expected job numbers that helped push yields up, while the sinking Michigan Sentiment Index put downward pressure on bond yields. Bonds don’t know which way to go, but the trend is towards higher bond yields and that’s negative for the economy.
Adding to the woes for the treasury market is a surge in corporate bonds. Corporate bonds have a higher yield than treasuries and rising demand for corporate bonds puts pressure on treasury bonds due to the shrinking pool of money. The 10-year breaks out above 4.50% while the Canadian 10-year breaks out above 3.60%. Support is at 3.45% for Canada and 4.30% for the U.S.
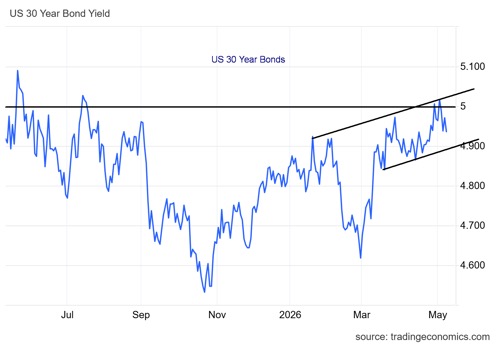
Of interest is the 30-year U.S. Treasury bond. It has been flirting with breaking over 5.00%. Many bond dealers consider 5.00% a line in the sand. We are close. 4.90% is support. Not helping the bond market is the need by many to sell U.S. treasuries to raise cash for their own needs. We are seeing this from Gulf countries and in particular Japan, which is facing rising inflation and as a result rising bond yields. They need money to defend the yen, which usually means selling U.S. treasuries and buying Japanese Government bonds (JGBs).
The Fed is in a quandary. Do you hike rates, leave them unchanged, or lower them? The pressure is to lower rates, but inflation says hold or hike. As well, we note that Kevin Warsh has not yet been confirmed as the new Fed chair. Powell is due to officially retire on May 15; however, he is staying on as a governor as he is allowed to. The trouble is, the DOJ dropped the case against him and the Fed, but Trump wants to reopen it. If that happened, then Powell is more likely to remain Fed chair, sparking all sorts of conflict. None of this is good for bond yields.
Gold and silver
Gold continues to be battered by the ever-changing oil market. Oil up, gold down, stocks down, US$ Index up; oil down, gold up, stocks up, US$ Index down. This week oil was down so gold, silver, and the gold stocks enjoyed a good up week. Gold gained 2.2%, silver appears to be breaking out up 6.6%, while the gold stocks were up on the week with the Gold Bugs Index (HUI) up 8.3% and the TSX Gold Index (TGD) up 9.1%. That sounds great, but it could all reverse this week if oil prices soar once again. Other metals also gained with platinum up 3.3% and copper breaking out up 5.5%. Only palladium waffled, losing 2.5%.
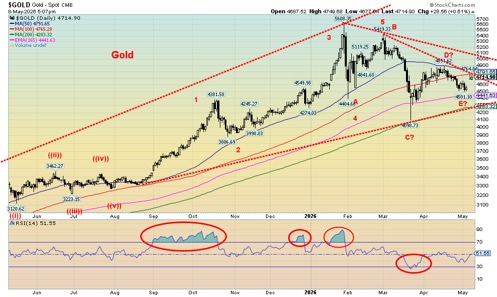
We find the pattern on gold intriguing. Since that peak on January 29, 2026, we appear to have made an A wave down, a B wave up, a C wave down, a D wave up, and an E wave down. We closed at or near a converging 50-day and 100-day MA. A break of $4,800 would be helpful. Above $5,000, we could be breaking out. Above $5,300, new highs are possible. Below $4,300 there’s trouble and under $4,100 new lows lie ahead and the gold bull market becomes questionable.
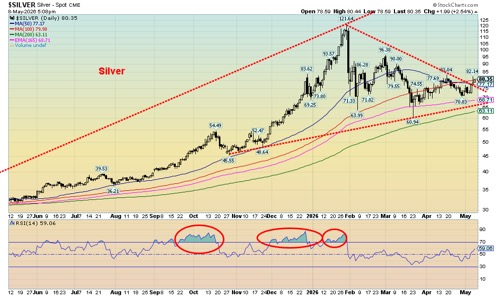
It’s the same with silver. Silver appears to be breaking out above a downtrend line. We’d feel more comfortable with a break and close above $83. Support is at $71, $66, and $61. Below $61, a more serious bear could follow. Above $107.50, new highs are possible.
Gold seems to be uncertain as to which way to turn. Stronger than expected jobs data puts upward pressure on bond rates. But sinking consumer sentiment puts downward pressure on bond rates. Bond rates up, gold down. Bond rates down, gold up.
All that puts the Fed in a quandary, no matter who is in charge, whether it’s Powell or Warsh. A push to lower rates most likely pushes gold higher. The war in Iran also impacts gold. Logically, one would think that the war should be positive for gold. But oil prices have the perverse effect of oil up, gold down, oil down, gold up. All this continues to suggest that one should continue to hold gold, even through all this volatility. The patterns on gold, silver, and the TGD and HUI all suggest we should break higher. Typically, this is a weak period with lows usually seen in June or July before another strong up run gets underway into September.
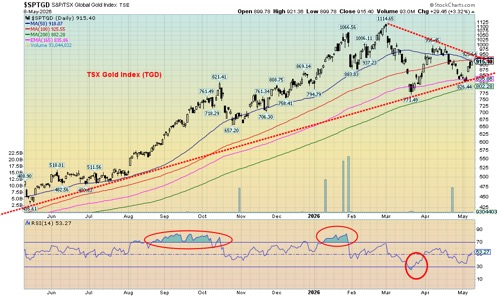
That run into January 2026 was quite spectacular. We believe it ended as third wave up. If that’s correct, this is the fourth wave correction with a fifth wave to come that could take gold to $6,000 or even $7,000. Some think even higher, but we wouldn’t want to get ahead of ourselves. The pattern forming suggests anywhere from $6,300 to $6,500. Silver to around $135 to $140. The TGD to 1,200 to 1,300. But just in case, always keep the downside break points in mind.
Gold remains a safe-haven asset, despite the recent correction. The U.S. debt is huge and vulnerable. Inflation is sticky and could become stagflation. On a net basis, central banks are still buying and the purchase of real assets is growing, not shrinking. Of course, you’d never know it with the stock market at record prices.
Oil and gas
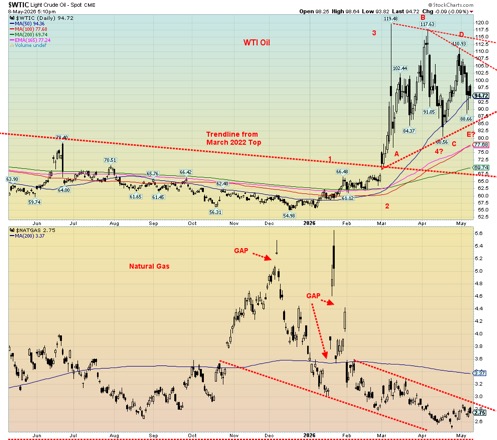
The missiles are still flying (even though there is a ceasefire). The Strait of Hormuz is still closed. The U.S. still seizes ships. Iran still attacks ships. But peace is at hand, according to President Trump. Or, at least, that’s what he wants everyone to believe. Whipsaw city – up one week and down the next. This past week down, as WTI oil fell 7.6% and Brent crude was down 7.5%. Since that peak back on March 9, 2026, the oil market has been battered and moves like a yoyo. Where does one turn?
Many are considering this to be the worst oil crisis ever. And we may not even have hit the worst point in the crisis. Inventories are falling. Inventories are the buffer, with China holding the largest. There are still a lot of inventories, but they’re dwindling. The crunch may not come until over the next month or two. We are now some 70 days into this conflict. The real crunch comes after 90 days. If that happens, then oil prices may no longer be subject to the whims of the president. Buying into oil and volatility still seems to be the way.
Intriguingly, WTI oil may be forming a giant flag or pennant. From that March peak we can count an A wave down, a B up, a C wave down, a D wave up, and we may be working on the E wave down. We could just waffle through, making yet another technical formation. The current breakout points are above $107.50 and especially above $115. Breakdown? It’s under $85 and $80. We await that, but right now we’re leaning towards a breakout, not a breakdown.
Natural gas (NG) is still waffling as Henry Hub NG fell 1.4% while the EU Dutch Hub NG was off 3.6%. The West is in a better position than the EU and Asia, given ample local NG supplies. But in the EU and especially parts of Asia, rationing is breaking out over oil, as well as conflict and clashes. Could that come to the West as well?
The energy stocks didn’t fare well this past week as the ARCA Oil & Gas Index (XOI) fell 5.3% while the TSX Energy Index (TEN) dropped 3.6%. Relatively speaking, the energy stocks are holding up well. That’s a sign that manipulation can take place in the oil market but not so much in the stock market. Owning stocks not dependent on the situation in the Strait of Hormuz may be the wiser plan.
Regardless, all this feeds into the inflation narrative. And that puts the Fed and other central banks in a quandary. The market seems to want to treat the problem as contained, but that may be wishful thinking.
Next, a possible insider trading scandal.
An Insider Trading Scandal?
Source: www.investinglive.com
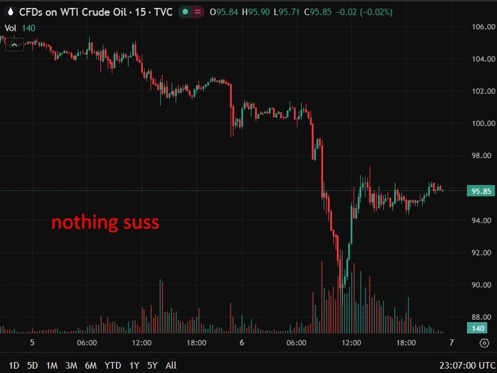
This is not the first time. The phenomenon has appeared before in April. Roughly an hour before the release of news that a peace deal between the U.S. and Iran may be at hand as announced by Axios www.axios.com, someone(s) purchased an estimated 17,300 of WTI Oil futures of shorts valued at more than $1.7 billion.
Also found here.
We have copied a summary of Investing Life’s report which itself was taken from Dow Jones MarketWatch www.marketwatch.com. This report, we note, was noted elsewhere as well. The full article is available.
Summary:
- Roughly 17,300 front-month WTI crude futures contracts valued at more than $1.7 billion changed hands in the hour before an Axios report on a potential U.S.-Iran peace framework sent oil prices lower at around 4:50 a.m. Eastern time on Wednesday, according to Dow Jones Market Data via MarketWatch
- Multiple oil market experts told MarketWatch the early-morning volume spike looked consistent with someone trading on advance knowledge of the report, with the bulk of activity occurring before 4:10 a.m. Eastern, before the Axios story was published
- Gregory Brew, senior analyst at Eurasia Group focused on energy markets and Iran, told MarketWatch the volume was unusual for that hour and described the activity as suspicious, per the MarketWatch report
- Ilia Bouchouev, former president of Koch Global Partners and a leading energy trading expert, told MarketWatch the pattern of suspicious activity was continuing, though he noted Wednesday’s trades were marginally less conspicuous than an episode on April 7 that preceded London morning hours, according to the same report
- Bloomberg previously reported that the Commodity Futures Trading Commission was examining a broader pattern of suspicious oil market activity around market-moving Truth Social posts and media reports, per MarketWatch; a CFTC representative told MarketWatch the agency does not confirm or deny investigations
- Two anonymous energy traders told MarketWatch the activity was suspicious enough to undermine market confidence, while noting that proving insider knowledge behind specific trades would be difficult, per the report
Because in stock markets, information is everything. Whoever gets it first usually wins biggest. Was this smart positioning or something much bigger? Profits on a play of that size could exceed $125 million.
Markets and trends follow
Stock Markets and Trends
| % Gains (Losses) Trends | ||||||||
| Close Dec 31/25 | Close May 8/26 | Week | YTD | Daily (Short Term) | Weekly (Intermediate) | Monthly (Long Term) | ||
| S&P 500 | 6,845.50 | 7,398.93 (new highs) * | 2.3% | 8.1% | up | Up | up | |
| Dow Jones Industrials | 48,063.29 | 49,609.16 | 0.2% | 3.2% | up | up | up | |
| Dow Jones Transport | 17,357.19 | 20,198.74 | (1.9)% | 16.4% | up | up | up | |
| NASDAQ | 23,241.99 | 26,247.08 (new highs) * | 4.5% | 12.9% | up | up | up | |
| S&P/TSX Composite | 31,712.76 | 34,077.76 | 0.6% | 7.5% | up | up | up | |
| S&P/TSX Venture (CDNX) | 987.74 | 997.29 | 0.3% | 1.0% | neutral | up | up | |
| S&P 600 (small) | 1,467.76 | 1,683.38 (new highs) * | 0.6% | 14.7% | up | up | up | |
| ACWX MSCI World x US | 67.18 | 75.79 (new highs) * | 2.9% | 12.8% | up | up | up | |
| Bitcoin | 87,576.98 | 80,201.85 | 2.4% | (8.4)% | up | down | neutral | |
| Gold Mining Stock Indices | ||||||||
| Gold Bugs Index (HUI) | 701.49 | 802.35 | 8.3% | 14.4% | neutral | up | up | |
| TSX Gold Index (TGD) | 817.76 | 915.22 | 9.1% | 11.9% | neutral | up (weak) | up | |
| Bonds% | ||||||||
| U.S. 10-Year Treasury Bond yield | 4.17% | 4.36% | (0.5)% | 4.6% | ||||
| 3.3Cdn. 10-Year Bond CGB yield | 3.44% | 3.48% | (1.4)% | 1.2% | ||||
| Recession Watch Spreads | ||||||||
| U.S. 2-year 10-year Treasury spread | 0.69% | 0.46% | (6.1)% | (33.3)% | ||||
| Cdn 2-year 10-year CGB spread | 0.85% | 0.62% | 5.1% | (27.1)% | ||||
| Currencies | ||||||||
| US$ Index | 98.26 | 97.86 | (0.4)% | (0.4)% | down | down | down | |
| Canadian $ | 72.87 | 73.08 | (0.7)% | 0.3% | up | up | neutral | |
| Euro | 117.48 | 117.86 | 0.6% | 0.3% | up | up | up | |
| Swiss Franc | 126.21 | 128.78 | 0.7% | 2.0% | up | up | up | |
| British Pound | 134.78 | 136.31 | 0.4% | 1.1% | up | up | up | |
| Japanese Yen | 63.83 | 63.82 | 0.2% | flat | up | down | down | |
| Precious Metals | ||||||||
| Gold | 4,311.97 | 4,715.87 | 2.2% | 9.4% | neutral | up | up | |
| Silver | 71.16 | 80.33 | 6.6% | 12.9% | up | up | up | |
| Platinum | 124.81 | 2,064.70 | 3.3% | 0.9% | up (weak) | up (weak) | up | |
| Base Metals | ||||||||
| Palladium | 1,619.50 | 1,499.50 | (2.5)% | (7.4)% | neutral | neutral | up | |
| Copper | 5.64 | 6.24 | 5.5% | 10.6% | up | up | up | |
| Energy | ||||||||
| WTI Oil | 57.44 | 94.88 | (7.6)% | 65.2% | neutral | up | up | |
| Nat Gas | 3.71 | 2.75 | (1.4)% | (25.9)% | neutral | down | down (weak) | |
__
(Featured image by Jakub Zerdzicki via Unsplash)
DISCLAIMER: This article was written by a third party contributor and does not reflect the opinion of Born2Invest, its management, staff or its associates. Please review our disclaimer for more information.
This article may include forward-looking statements. These forward-looking statements generally are identified by the words “believe,” “project,” “estimate,” “become,” “plan,” “will,” and similar expressions, including with regards to potential earnings in the Empire Flippers affiliate program. These forward-looking statements involve known and unknown risks as well as uncertainties, including those discussed in the following cautionary statements and elsewhere in this article and on this site. Although the Company may believe that its expectations are based on reasonable assumptions, the actual results that the Company may achieve may differ materially from any forward-looking statements, which reflect the opinions of the management of the Company only as of the date hereof. Additionally, please make sure to read these important disclosures.
David Chapman is not a registered advisory service and is not an exempt market dealer (EMD) nor a licensed financial advisor. He does not and cannot give individualised market advice. David Chapman has worked in the financial industry for over 40 years including large financial corporations, banks, and investment dealers. The information in this newsletter is intended only for informational and educational purposes. It should not be construed as an offer, a solicitation of an offer or sale of any security. Every effort is made to provide accurate and complete information.
However, we cannot guarantee that there will be no errors. We make no claims, promises or guarantees about the accuracy, completeness, or adequacy of the contents of this commentary and expressly disclaim liability for errors and omissions in the contents of this commentary. David Chapman will always use his best efforts to ensure the accuracy and timeliness of all information. The reader assumes all risk when trading in securities and David Chapman advises consulting a licensed professional financial advisor or portfolio manager such as Enriched Investing Incorporated before proceeding with any trade or idea presented in this newsletter.
David Chapman may own shares in companies mentioned in this newsletter. Before making an investment, prospective investors should review each security’s offering documents which summarize the objectives, fees, expenses and associated risks. Although Artificial Intelligence (AI) may be deployed from time to time, AI output is monitored and adjusted, if necessary, for accuracy. David Chapman shares his ideas and opinions for informational and educational purposes only and expects the reader to perform due diligence before considering a position in any security. That includes consulting with your own licensed professional financial advisor such as Enriched Investing Incorporated. Performance is not guaranteed, values change frequently, and past performance may not be repeated.


Virginia Cannabis Market Could Reshape Regional Competition
Virginia’s planned recreational cannabis market could reshape the Washington region’s economic landscape. With nine million residents, it may draw consumers...


Bitcoin’s Price Drops as Investors Turn to Layer 2 Solutions
Bitcoin fell toward $63,000 after leveraged liquidations erased recent gains, while geopolitical tensions between the US and Iran pressured risk...


Emily.AI: Personalized Oxygen Therapy Earns Global AI Recognition
Emily.AI, Quirónsalud’s explainable AI medical device, became a global finalist at the AI for Good Summit 2026 after competing with...


Advanced Blockchain Under Pressure Amid Crypto Market Shifts
The crypto market shows diverging trends: Advanced Blockchain faces heavy pressure despite restructuring, weak finances, and ongoing transformation, though analysts...


Cannabis Regulation in Germany and Switzerland Shows Early Benefits of Legalization Models
Germany and Switzerland’s cannabis reforms suggest regulated access can reduce criminalization without increasing consumption. Germany saw fewer cannabis-related prosecutions, while...
 |
|
 |  |
 |
|
-

 Markets1 week ago
Rice Prices Rise as Supply Outlook Tightens and Demand Stays Mixed
-
 Cannabis14 hours ago
Virginia Cannabis Market Could Reshape Regional Competition
-

 Biotech7 days ago
BIP Sells BIC Incubator to Innova, Refocuses on Core Innovation Areas
-
 Markets2 weeks ago
Markets on Borrowed Time Amid Economic Cracks and Global Uncertainty