Markets
Stock Markets Everywhere Were Mostly Down to Start the New Year
Our theme this week is the conflict in the Red Sea and its potential for disrupting global trade. The world’s choke points are gaining more and more attention as the world is increasingly divided into two camps – the west led by the G7 and the east/south led by the BRICS. But the conflict in the Red Sea is not the only chokepoint. We note them and attempt to note the volume of world trade, oil, LNG etc that flows through them.

Welcome to 2024. It promises to be a year of chaos, dysfunction, and volatility. Conflict at home and abroad. Can it be avoided? Stock markets started off on a down note. Not a surprise, really, given that 2023 was a banner year and after tax-loss selling is over for 2023, so that money managers can step in to take their profits in 2024. In the first few days of 2024 we’ve already had an earthquake, an assassination in Lebanon of a high-ranking Hamas official, an Iranian war ship in the Red Sea, and a mysterious attack at a memorial service in Iran. Conflict, it seems, is not going to disappear.
For a world in conflict the hotspots don’t disappear. They just pop up somewhere else. We can ramble off the conflicts that are ongoing, In Africa, we see conflict in the Sahel, Mali, Niger, Burkina Faso, Tunisia, the Sudan, Ethiopia, Somali, DR Congo, Nigeria, and Libya. In Asia: conflict in Myanmar, Afghanistan, Turkey/Kurdish, Indo-Pakistani wars, Papua, Bangladesh, Philippine’s drug wars, Armenia/Azerbaijan, Iraq, the Middle East in the Syrian civil war, the Yemen civil war, plus the ongoing Israel/Hamas war threatening to widen to Israel/Hezbollah of Lebanon.
In North America, it’s the Mexican drug cartels, Haiti, Honduras, El Salvador, Colombia, and Venezuela/Guyana. Europe has the ongoing conflict between Ukraine and Russia. Plus, there is brewing trouble in Kosovo. No doubt we missed a few. But outside of Israel/Hamas/Hezbollah and Russia/Ukraine none of them really make front page news. Nor do they seem to have any major ongoing economic impact or stock market impact on North America and Europe. At least, not yet.
The conflict that gets the biggest front-page news is the ongoing conflict between Russia and Ukraine in Europe and Israel and Gaza/Hamas in the Middle East. However, a new one is brewing that could have a significant economic impact. That is the conflict in the Red Sea that impacts the Bab-El-Mandeb Strait and the Suez Canal.
Currently, container ships are being attacked regularly, with anti-ship missiles and drones from the Houthis, who are Iranian proxies in Yemen. The area accounts for some 12% of global trade, 30% of global container ship traffic, 7–8% of global oil, and 8% of global LNG. Some ships are rerouting around the Cape of Good Hope. However, that lengthens the journey by days and raises the costs of shipping substantially, not to discount as well the additional oil that is required. The attacks are allegedly in support of Gaza/Hamas in their conflict with Israel.
The U.S. quickly moved into the Red Sea, along with a few other Western allies to combat the Houthis. But the U.S. is being attacked elsewhere as well. Iranian militias in Syria and Iraq have stepped up attacks on U.S. bases in those countries. The aim? Allegedly to push the U.S. out of the Middle East completely. The Iraqi government had already asked/told the U.S. to leave.
Some have noted that it could go further than that and potentially undermine the 1916 Sykes-Pigot Agreement whereby, after the fall of the Ottoman Empire, the map of the Middle East was redrawn in the image of the European colonial powers Great Britain and France. Since then, the region has been in constant conflict, experiencing coups, wars, and revolts.
The Straits of Bab-El-Mandeb and the Suez Canal are not the only potential choke points that could have a significant impact on global trade. There are other readily identifiable choke points that are significant for world trade of goods, oil, LNG, grains, and more. The Straits of Hormuz that links the Persian Gulf and Gulf of Oman to the Indian Ocean lies between Iran on one side and the United Arab Emirates (UAE) and an enclave of Oman.
Nearby are Saudi Arabia, Bahrain, and Qatar. Some 30% of global oil passes through these straits, along with roughly 25% of global LNG. Bahrain is a U.S. ally that hosts the U.S. Navy’s fifth fleet. The Straits of Malaca are a route between the Indian Ocean and the Andaman Sea to the South China Sea and the Pacific Ocean. Through there flows some 25% of global trade and over 20% of global oil.
The world is dependent on globalization and global shipping is key. Block these important routes and the world economy could take a significant hit. Yet, more and more, the world is dividing into two camps that could result in global conflict not seen since World War II. On one side is the West, led by the U.S., and on the other side is East and South led by China. Another way of describing it is the West is led by the G7 (U.S., U.K., Germany, France, Japan, Italy, and Canada) while the East/South is led by the BRICS (Brazil, Russia, India, China, and South Africa).
In terms of GDP, the G7 leads with combined GDP of roughly $46.3 trillion vs. the BRICS at $25.8 trillion. But the BRICS is expanding to bring in Saudi Arabia, Iran, Ethiopia, Argentina, and the UAE, although Argentina’s new government has now pulled out. That adds an additional $2.7 trillion, but it includes some significant countries, particularly Saudi Arabia and the UAE, as both have roles in the Red Sea and the Persian Gulf. Indonesia is a key for the Strait of Malaca.
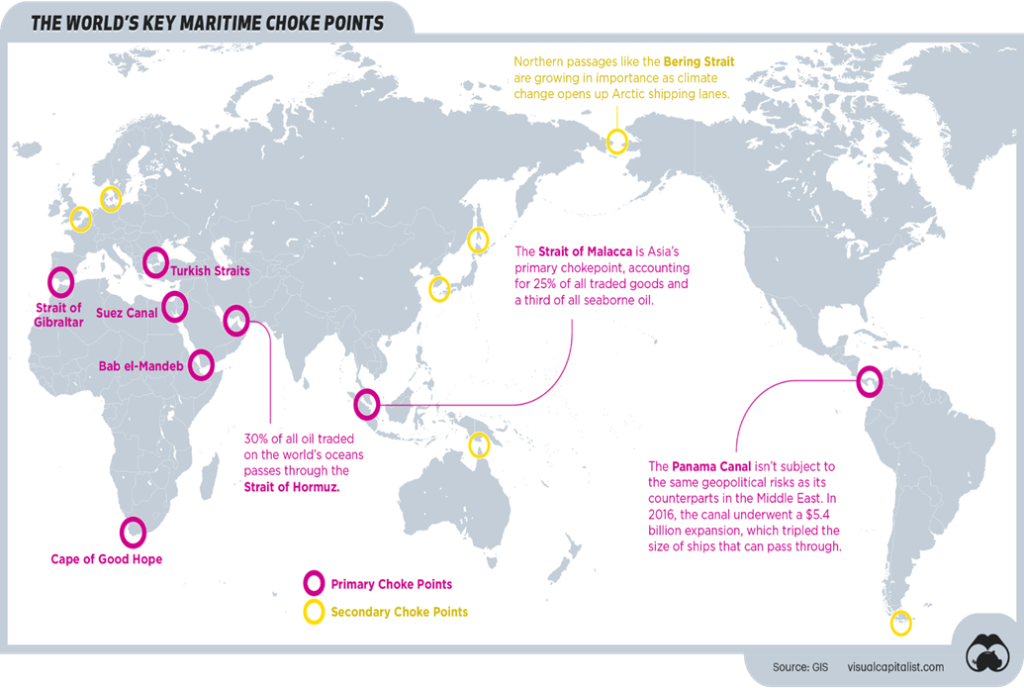
The above-mentioned global choke points are not the only ones of importance. The Panama Canal connects the Atlantic and Pacific Oceans through Panama. Some $270 billion worth of goods goes through there every year. While not an area of conflict, the canal is in a region undergoing a major drought that has negatively impacted the depth of the canal, forcing ships to load less than they normally would.
The alternative is the Straits of Magellan around Argentina/Chile between the Atlantic and the Pacific Oceans. It’s a treacherous route with storms, fog, high waves, and rocks. Shipping via that route adds considerably to costs and time, not unlike the Cape of Good Hope. It is noteworthy as well that the Mississippi River in the U.S. and the Rhine River in Europe are also undergoing serious drought conditions that impact the shipment of goods along these important trade routes. Barges have been grounded.
The Turkish Straits, which includes the Bosphorus and the Dardanelles, is an important route from the Black Sea to the Mediterranean. Turkey is on both sides of the straits. The Dardanelles was an important battle during World War I as the Allies tried to take the route from the Ottoman Empire (they failed).
| High-Risk World Choke Points | Trade | Location | Major Danger, Risks |
| Panama Canal | 5% global trade, 40% of U.S. container traffic | Panama, Atlantic Ocean, Pacific Ocean | Drought, floods, disrepair |
| Suez Canal | 12% of global trade, 30% of global container ship traffic, 7-8% global oil, 8% global LNG | Egypt, Red Sea, Mediterranean Sea | Storms, haze and fog, terrorist attacks, unforced delays |
| Strait of Malaca | 25% of global trade, 20%+ global oil | Indonesia, Malay Peninsula, Andaman Sea, Indian Ocean, South China Sea, Pacific Ocean | Piracy, haze and fog, |
| Strait of Hormuz | 30% of global oil, 25% of global LNG | Iran, UAE, Oman, Saudi Arabia, Bahrain, Qatar, Persian Gulf, Gulf of Oman | Piracy, conflict |
| Strait of Bab-El-Mandeb | 12% of global trade, 30% of global container ship traffic, 7–8% global oil, 8% global LNG | Yemen, Eritrea, Djibouti, Red Sea, Gulf of Aden, route to Suez Canal | Piracy, terrorist attacks, conflict |
| Turkish Straits | 3% of global oil, 25% of global grain exports, | Turkey, Dardanelles, Bosphorus, Black Sea, Mediterranean Sea, Aegen Sea | Storms, haze and fog, conflict |
| Dover Strait | 40% of global trade, busiest shipping lane in the world, 22% U.K. imports, 30% U.K. exports, | U.K., France, English Channel, North Sea | Storms, haze and fog, unforced delays |
| Cape of Good Hope | Historical route for trade between Europe, Africa, Asia, about 5% global oil | South Africa, Indian Ocean, Atlantic Ocean | Storms, fierce winds, high waves, rocky outcrops, heavy traffic |
Lesser points but still important are the Dover Straits between the U.K. and Europe (France) via the English Channel. While not subject to conflict, the route is important and is one of the busiest shipping lanes in the world. Others include the Oresund Straits between Sweden and Denmark, which is an important route between the North Sea and the Baltic Sea. It enables Russia, Poland, the Baltic States, and Germany to access international shipping. It is particularly important to Russia.
Lesser ones, but nonetheless important are the Straits of Gibraltar between Europe and Africa that link the Mediterranean Sea and the Atlantic Ocean. Equally important is the Saint Lawrence Seaway that links the Great Lakes in North America to the Atlantic Ocean. Potentially important for the future as ice recedes because of global warming is the Bering Strait between Russia and the U.S., linking the Pacific Ocean with the Arctic Ocean and the Northwest Passage to the Atlantic Ocean.
A few others are worth mentioning. They include the Tsushima Strait between Japan and South Korea, the La Perouse Strait between Japan and Russia, and the Torres Strait between Australia and New Guinea. We might also mention the Taiwan Strait between China and Taiwan, linking the South China Sea to the East China Sea. The Taiwan Strait is currently a part of the conflict between the U.S./Taiwan and China. However, it is not known as a global trade route.
The conflict in the Red Sea is important for other reasons. Egypt controls the Suez Canal and earns revenue on transit fees of upwards of $10 billion/year. Egypt has debt problems, plus the growing refugee crisis on the
Gaza border that could spill over into Egypt’s Sinai.
The West and Egypt need to keep the Suez Canal open. Shipping around the Cape of Good Hope is not only costly and lengthy, but it also means a rise in demand for oil for the ships. A Western coalition has entered the Red Sea to combat the Houthis but, maybe not unsurprisingly, both Saudi Arabia and the UAE are not participating and instead are urging restraint. Adding to the challenge is the presence now of an Iranian warship.
Some have even noted that the U.S. could find itself in the Thucydides Trap whereby lesser powers are challenging the major power (U.S.). But where is China in this? Blockage of the Red Sea via the Strait of Bab-El-Mandeb is, in the end, in BRICS’ interests, not the U.S.’s or the EU’s. Freeing it up is in the West’s interests. Egypt is a key as both the West and BRICS led by China and Russia vie for favours, with Russia and China both offering direct economic and financial support. The West needs to open the sea lanes. The economic costs to the West are too great.
Baltic Dry Index 2002–2023
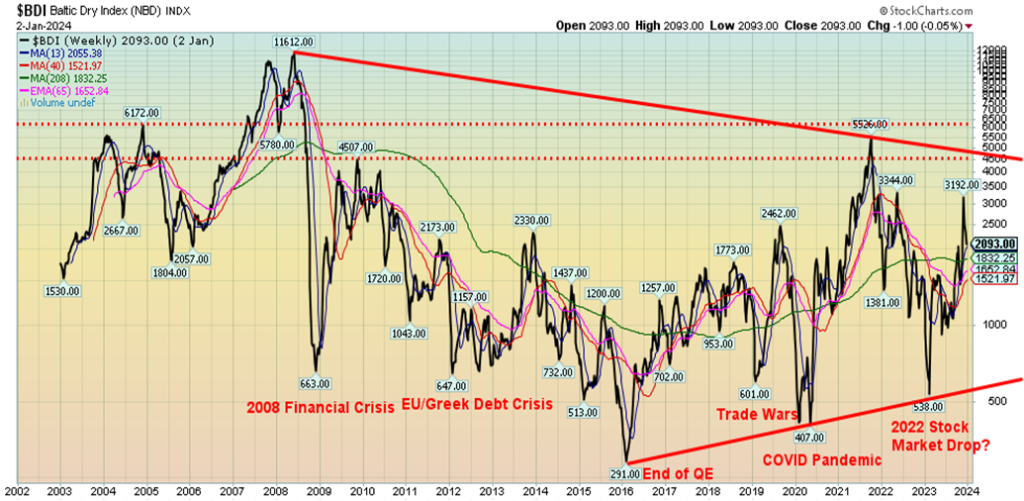
Global shipping is too important to the world. Blockages have a negative impact on globalization and could lead to higher inflation. Already insurance costs are soaring. And it is probably no surprise to see the Baltic Dry Index (BDI), which is the price of moving raw materials by sea, starting to fall. The BDI is a major indicator of supply and demand and economic activity. Previous lows in the BDI have largely coincided with major economic events such as the COVID pandemic of 2020. The last big drop came in 2022 as global stock markets roiled and it was thought a global recession would develop.
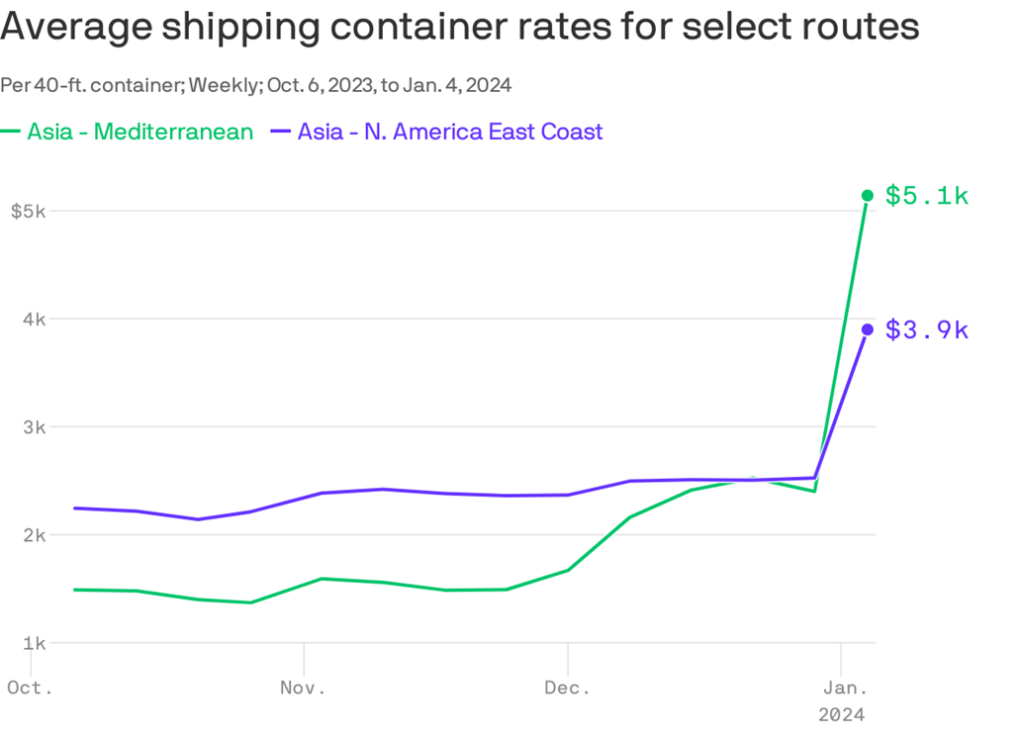
As the chart of average shipping container rates shows, the costs have jumped over the past number of weeks, thanks to the ongoing attacks in the Red Sea. North America freight shipping is rising as well, thanks to the drought conditions in the Panama Canal and the Mississippi River. That leaves two of the most important shipping routes in high doubt. For Red Sea shippers, a trip around Cape of Good Hope adds 13–15 extra days. Calculate costs plus increased oil demand. Similarly, the route around the Strait of Magellan is not overly viable, so to move things from New York to Asia they might instead also go around the Cape of Good Hope.
None of this takes into account extreme weather events that are happening with greater frequency. An example was the Western Canada wildfires of 2023, where shipments were delayed or just didn’t happen. Add in hurricanes, storms, and more and the risks are rising, not falling. Some have ranked extreme weather as the number one reason for shipping delays going into 2024. https://www.everstream.ai/special-reports/2024-supply-chain-annual-risk-report/?utm_source=newsletter&utm_medium=email&utm_campaign=newsletter_axiosmarkets&stream=business
A number we picked up saw, during the 1980s, an inflation-adjusted extreme weather event every four months. Today that number is one every three weeks, according to the Everstream report.
There are few alternatives to shipping via sea. There are few alternatives that are low cost if blockages develop at the world’s major choke points. The key ones are the Strait of Bab-El-Mandeb/Red Sea/Suez Canal, the Strait of Hormuz/Persian Gulf/Gulf of Oman, the Panama Canal/Atlantic Ocean/Pacific Ocean, and the Strait of Malaca/Indian Ocean/South China Sea. Others are important as well but are generally not in an area of conflict. Global choke points are just one amongst other potential chaotic, dysfunctional, and volatile points of contention as we head into 2024.
None of this is to suggest that anything untoward is going to happen. However, it is important to understand the importance and role of each of these major choke points and their potential impact on global trade and oil prices in particular. Blockages could have serious economic fallout that could help plunge the world into a steep recession. An outbreak of war in, say, the Straits of Hormuz could see oil prices soar by 20% or more. It could send the world, particularly the West, into a steep recession. Yet, negotiations to end these conflicts seem remote.
Chart of the Week
US Job Numbers
Employed Persons, Unemployed Persons 2019–2024
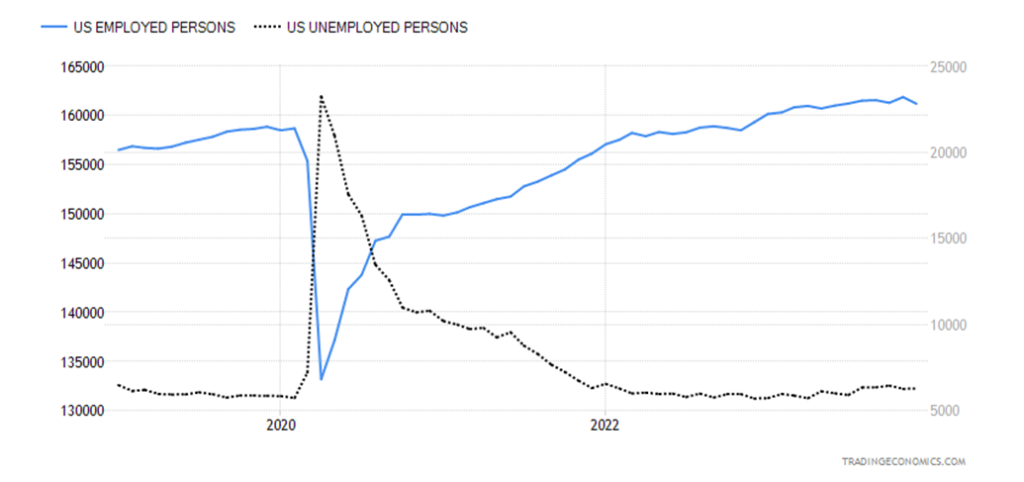
Well, don’t you just like surprises. Yes, that monthly furor over the job numbers. Nonfarm payrolls for December rose by 216,000, above the expected 170,000 and above November’s gain of 173,000. The market’s reaction was predictable. Stocks fell, gold fell, the US$ Index rose, and bond yields rose. Both stocks and gold bounced back later. Sounds great. Except dig deeper and maybe it wasn’t so great. Private sector employment rose by 164,000 while the government sector added 52,000. Most of the private sector jobs added were in leisure and hospitality, health care, and social assistance. The government sector added also in health care.
Rather than getting excited, a closer look revealed an economy that, instead of growing, is slowing. The civilian labour force fell by 676,000 while the total employment level dropped 683,000. The result was the labour force participation rate dropped to 62.5% from 62.8%. The employment population ratio fell to 60.1% from 60.4%. Fewer people working and indeed dropping out meant the unemployment rate (U3) was steady at 3.7%. Makes things sound better.
No surprise then that the number for those considered not in the labour force rose by 845,000. But the U6 unemployment rate (which represents the total unemployed, plus all persons marginally attached to the labour force, plus total employed part-time for economic reasons, as a percent of the Civilian Labour Force, plus all persons marginally attached to the labour force) rose to 7.1% from 7.0%. And the Shadow Stats unemployment number (U6 plus all those defined out of the labour force in 1994) rose to 25.6% from 25.4% as the number of discouraged workers surged.
Other numbers were also indicative of slowdown, not growth. The number employed full-time fell 1,531,000 while the number employed part-time rose 762,000. Multiple job holders also grew. They actually rose to a record high. Part-time multiple job holders rose 83,000 while full-time (those holding two full-time jobs) rose 36,000 to 399,000.
The total unemployed level only rose by 6,000. All these different numbers do seem to diverge, depending on whether it was the establishment survey or the household survey. Most come from the household survey while the nonfarm payroll number comes from the establishment survey. We rely more on the household survey rather than the establishment survey. Hence, the volatility in the nonfarm payrolls and revisions.
Private sector job growth averaged only 169,000 in 2023 vs. 376,000 in 2022. Most jobs are concentrated in government plus private sector leisure and hospitality and healthcare. The median weeks unemployed fell to 9 weeks vs. 9.3 weeks, but the average weeks unemployed rose to 22.3 weeks vs. 19.5 weeks. The figure for those unemployed for more than 27 weeks was up 25,000. Average weekly hours fell to 34.3 vs. 34.4, while average weekly earnings rose to 4.1% from 4.0%. It seems given that, with wage growth still strong and weekly hours falling, employers are not shedding as much as they might but keeping people on, just working fewer hours. Will that change going forward? (Note: All numbers are sourced from www.stlouisfed.org)
Yes, things are still positive, but despite the higher-than-expected nonfarm payrolls, all other numbers are pointing to a slowing. Still, we believe it eases thoughts of a rate cut in Q1.
Canada Job Numbers
Employed Persons, Unemployed Persons 2019–2024
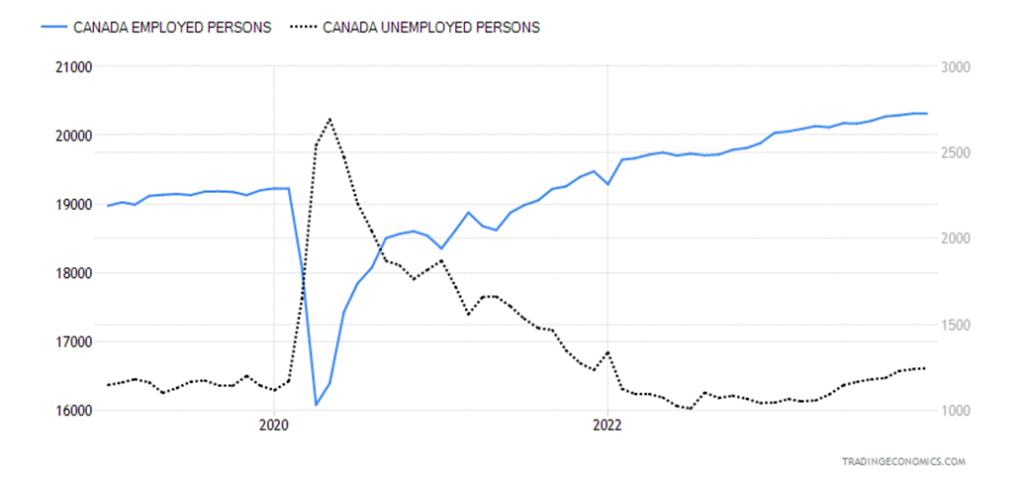
If the U.S. surprised to the upside, Canada surprised to the downside. Employment in Canada rose by only 100 in December vs. 24,900 in November. The market had expected a rise of 13,500. The number of people unemployed rose to 1,245,000 in December from 1,240,400 in November, a rise of 4,600. The labour force participation rate fell to 65.4% vs. 65.6%. Fewer people working or at least looking for work meant the unemployment rate was steady at 5.8%. The employment rate fell to 61.8% vs. 61.9% in November. The R8 unemployment rate, which is the highest noted by Statistics Canada (which includes discouraged searchers, waiting group, portion of involuntary part-times) rose to 7.3% from 7.2%.
Wages, however, continued to rise. For permanent employers, they were up 5.7% when the market only expected a rise of 5.4%. In November it was up 5.0%. It is the strongest pace in three years. All this comes in the face of a fast-rising labour force helped by immigration. Population growth in December of those 15 and over was up 74,000 vs. average monthly population growth in 2023 of 79,000. Canada was adding an average of 36,000 jobs a month in 2023, yet the unemployment rate rose 0.8%, strictly because of population and labour force growth.
The average work week in Canada rose 0.4% in December. Full-time employment fell 23,500 in December while part-time employment was up 23,600. All in all, we see hours worked and wages rising while employment and participation drop. As well, more are working part-time vs. full-time. Rate cut first quarter? Hardly. Rates are not coming down any time soon. Maybe late Q2?
Markets & Trends
| % Gains (Losses) Trends | ||||||||
| Close Dec 31/23 | Close Jan 5, 2024 | Week | YTD | Daily (Short Term) | Weekly (Intermediate) | Monthly (Long Term) | ||
| Stock Market Indices | ||||||||
| S&P 500 | 4,769.83 | 4,697.24 | (1.5)% | (1.5)% | up | up | up | |
| Dow Jones Industrials | 37,689.54 | 37,466.11 | (0.6)% | (0.6)% | up | up | up | |
| Dow Jones Transport | 15,898.85 | 15,508.67 | (2.5)% | (2.5)% | up | up | up | |
| NASDAQ | 15,011.35 | 14,524.07 | (3.3)% | (3.3)% | up | up | up | |
| S&P/TSX Composite | 20,958.54 | 20,937.55 | (0.1)% | (0.1)% | up | up | up | |
| S&P/TSX Venture (CDNX) | 552.90 | 551.34 | (0.3)% | (0.3)% | up | down | down | |
| S&P 600 (small) | 1,318.26 | 1,270.66 | (3.6)% | (3.6)% | up | up | up (weak) | |
| MSCI World | 2,260.96 | 2,222.74 | (1.7)% | (1.7)% | up | up | up (weak) | |
| Bitcoin | 41,987.29 | 43,694.57 | 4.1% | 4.1% | up | up | up | |
| Gold Mining Stock Indices | ||||||||
| Gold Bugs Index (HUI) | 243.31 | 232.98 | (4.3)% | (4.3)% | up | neutral | down (weak) | |
| TSX Gold Index (TGD) | 284.56 | 275.93 | (3.0)% | (3.0)% | neutral | neutral | down (weak) | |
| % | ||||||||
| U.S. 10-Year Treasury Bond yield | 3.87% | 4.05% | 4.7% | 4.7% | ||||
| Cdn. 10-Year Bond CGB yield | 3.11% | 3.26% | 4.8% | 4.8% | ||||
| Recession Watch Spreads | ||||||||
| U.S. 2-year 10-year Treasury spread | (0.38)% | (0.35)% | 7.9% | 7.9% | ||||
| Cdn 2-year 10-year CGB spread | (0.78)% | (0.79)% | (1.3)% | (1.3)% | ||||
| Currencies | ||||||||
| US$ Index | 101.03 | 102.43 | 1.4% | 1.4% | down (weak) | down (weak) | up (weak) | |
| Canadian $ | 75.60 | 74.91 | (0.9)% | (0.9)% | up | up (weak) | down | |
| Euro | 110.36 | 109.42 | (0.9)% | (0.9)% | up | up (weak) | down (weak) | |
| Swiss Franc | 118.84 | 117.61 | (1.0)% | (1.0)% | up | up | up | |
| British Pound | 127.31 | 127.18 | (0.1)% | (0.1)% | up | up | neutral | |
| Japanese Yen | 70.91 | 69.10 | (2.6)% | (2.6)% | up (weak) | neutral | down | |
| Precious Metals | ||||||||
| Gold | 2,071.80 | 2,049.80 | (1.1)% | (1.1)% | up (weak) | up | up | |
| Silver | 24.09 | 23.32 | (3.2)% | (3.2)% | down | down (weak) | neutral | |
| Platinum | 1,023.20 | 971.80 | (5.0)% | (5.0)% | up | neutral | neutral | |
| Base Metals | ||||||||
| Palladium | 1,140.20 | 1,037.10 | (9.0)% | (9.0)% | down (weak) | down | down | |
| Copper | 3.89 | 3.81 | (2.1)% | (2.1)% | neutral | up (weak) | down (weak) | |
| Energy | ||||||||
| WTI Oil | 71.70 | 73.81 | 2.8% | 2.8% | neutral | down | neutral | |
| Nat Gas | 2.56 | 2.89 | 12.9% | 12.9% | neutral | neutral | down | |
New highs/lows refer to new 52-week highs/lows and, in some cases, all-time highs.
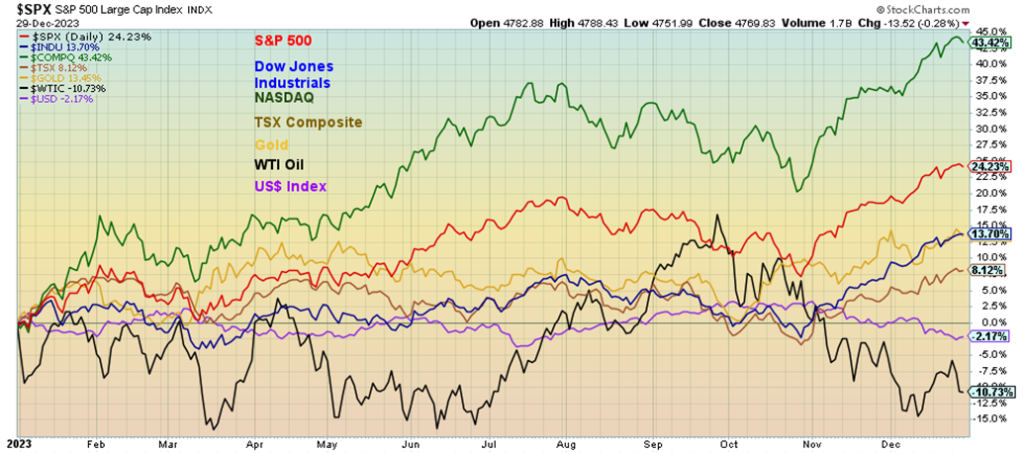
Performance – Selected Indices – 2023
2023 was a difficult year. It was a year characterized by chaos, dysfunction, and volatility, and highlighted by the ongoing war between Russia and Ukraine, the outbreak of war in the Middle East that started between Israel and Gaza (Hamas) which is threatening to spread, plus the ongoing clash of wills in the South China Sea between the U.S. and China. The geopolitical divide between the West and BRICS promised to get worse as more countries are being admitted to BRICS, and the divide between the West, North America, the EU, and Japan vs. the Russia/China-dominated rest of the world grew.
There was political dysfunction in the U.S. with a debt ceiling crisis, the ousting of a speaker and difficulties in electing a new one, plus the ousting of a member of Congress, only the sixth ever. The U.S. cultural wars intensified over abortion, sexual orientation, race relations, guns, religious vs. secular beliefs, and even banning of books. There was political upheaval with coups mostly in Africa, and the ongoing rise of the far right either in government or as major opposition parties. 2023 was the warmest year on record following a decade of warming weather. The result was intensifying wildfires, deadly heat waves, rising sea levels, droughts and floods, plus the ongoing disappearance of glaciers. The extreme weather events are contributing to rising mass migrations as the most impacted in the south try to move north.
In 2024, a good half the world will hold elections with the most important one occurring on November 5, 2024 in the U.S. Yet a look at The Economist democracy index shows over roughly 38% of the world lives under an authoritarian regime while only 8% are listed as full democracies. Democracy has been sliding backwards for years and elections in 2024 could result in more backsliding, given the rise of far-right populist parties.
Despite all this, global stock markets enjoyed a banner year. Climbing the wall of worry? The U.S. economy proved to be more resilient than many people thought. But China’s economy faltered. Stock markets were up in North America and Europe but faltered in Asia, particularly China. Leading the way was the NASDAQ, helped by the performance of the Magnificent Seven, which gained 43.4%. The S&P 500 was up 24.2%, but the blue-chip Dow Jones Industrials (DJI) was up only 13.7%. In Canada, the resource-dominated TSX Composite was up only 8.1%, while the junior TSX Venture Exchange (CDNX) fell 3.1%. The TSX was helped by a strong performance from Information Technology (TKK), which gained 56.0%.
In Europe, the German DAX led the way with a gain of 20.3%. In Asia, the major China Shanghai Index (SSEC) lost 3.7% but the Tokyo Nikkei Dow (TKN) gained 27.6%. Commodities were mixed, with gold gaining 13.5% but WTI oil fell 10.6% while natural gas (NG) was down 42.9% at the Henry Hub and down 57.6% at the EU Dutch Hub. The CRB Index, dominated by energy and agriculture, fell 5.0% in 2023. Grains were lower but meats rose. Uranium rose 86%. It was an unpleasant year generally for commodities and resource stocks.
Currencies, at least the major ones, were mixed. The US$ Index lost 2.2% but the Swiss franc gained 9.9%, while the Japanese yen fell 7.0%. Some collapsed—i.e. the Argentinian peso that was devalued more than 50% in a day on December 13, 2023. There was, however, one currency that performed very well. Well, not a real currency but a virtual or digital currency. Bitcoin gained 154% in 2023, leading the way for cryptocurrencies.
One did well, depending on where you were positioned. Not everyone (most?) holds the Magnificent Seven. Many are probably wondering why their portfolio didn’t do well in 2023. It’s simple—they didn’t have the Magnificent Seven.
Performance – The Magnificent Seven – 2023
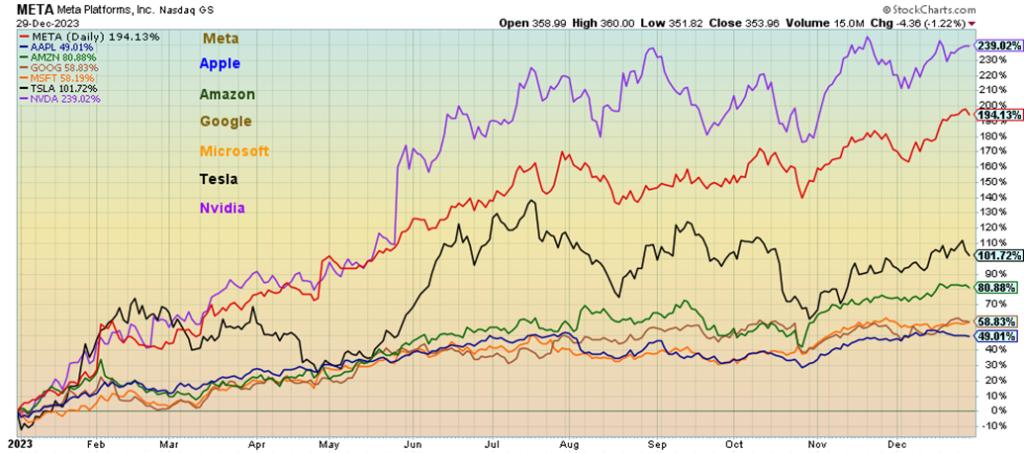
Ah yes, the Magnificent Seven: Meta, Apple, Amazon, Google, Microsoft, Tesla, and Nvidia. The star was Nvidia, up a mind-boggling 239%. Meta (Facebook) followed, up 194.1%, while Tesla gained 101.7%, continuing to make Elon Musk the richest man in the world with a net worth that’s more than many countries. Musk, if he were a country, would be the 53rd largest in the world, between Iraq and New Zealand. Amazon gained 80.9%, Apple up 49.0%, Google 58.9%, and Microsoft up 58.2%. These seven dominated the NASDAQ, the S&P 500, and the NY FANG Index that gained 96.0% in 2023. Will they repeat in 2024? We suspect not even as technology led by AI will continue to grow.
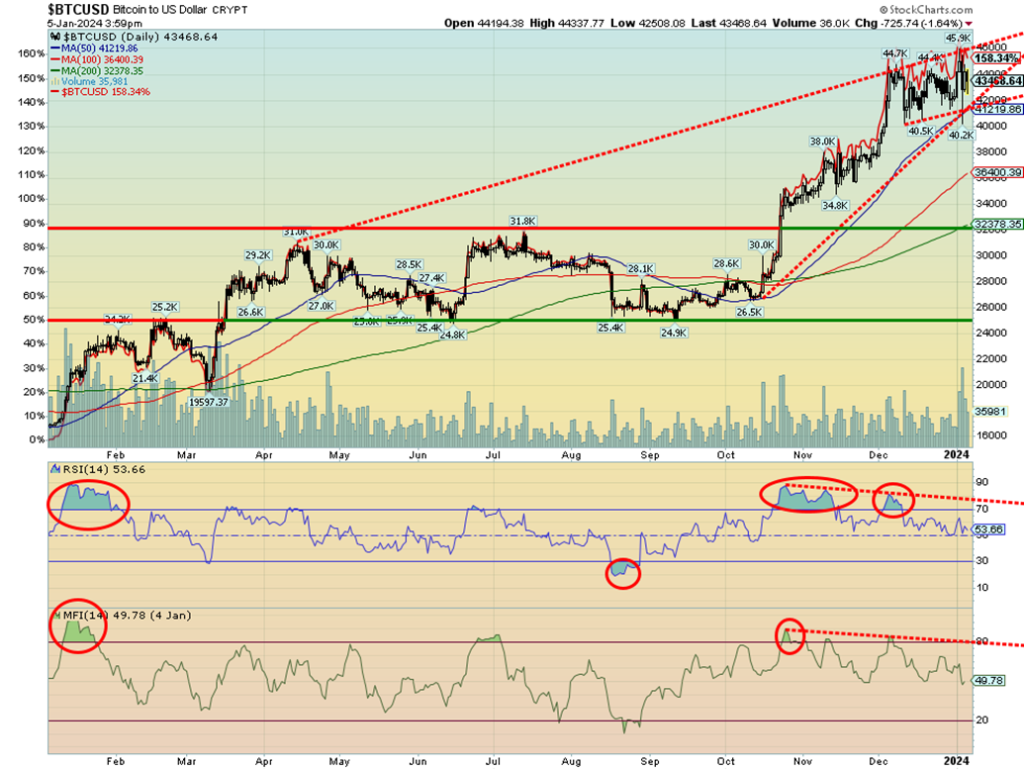
Bitcoin has been on a tear, up some 158% in the past year. Too bad hardly anyone owns it. But the reality is, it is a highly speculative instrument, useful for nothing, existing in a world of scams, money laundering, and more. Yet rumours of a Bitcoin ETF have sent the cryptocurrency soaring. Other cryptos have followed. A good article was seen in The Globe and Mail, Report on Business (ROB) on January 5, 2024, titled “What’s really behind bitcoin’s recent rally?”https://www.theglobeandmail.com/investing/investment-ideas/article-heres-what-really-is-behind-bitcoins-recent-rally/ Worth a read for those wishing to understand this speculative of all instruments. By the way, Bitcoin is still worthless, even if it has an outrageous price attached to it.
The article explains things better as it describes the difference between Bitcoin miners and speculators. Recall the total number of Bitcoins outstanding is still only 21 million. Most speculators own less than 0.1% of a Bitcoin. It is a very inefficient market and highly illiquid. Volumes, rather than rising, have actually been falling. With supply down and many off the market, the volume relative to float falls. Many Bitcoins are tied up in bankruptcies like the infamous FTX collapse. What happens when those Bitcoins are finally released and dumped on the market? Oops, as they say. Down we go. Just that nobody knows when all this is going to happen.
However, we see declining indicators (RSI, MFI) even as the price keeps moving higher. Now we appear to be forming a huge ascending wedge triangle which is bearish. The breakdown comes somewhere around $41,200. The targets if the wedge breaks? All the way back to at least $26,000. Caveat emptor.
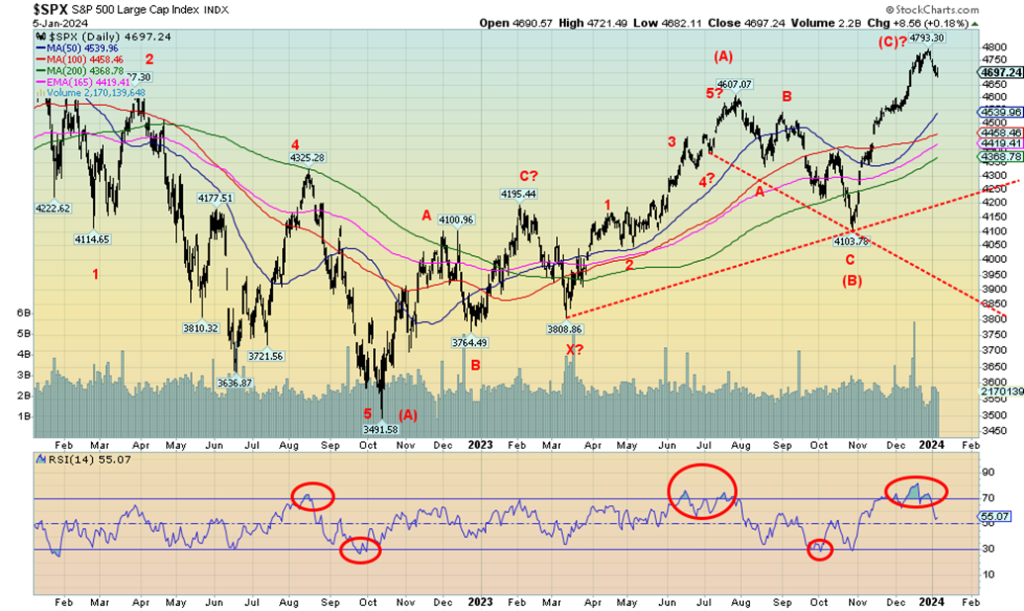
Is 2024 going to be a down year? Okay, we can’t tell that. We’ve indicated that the great Trifecta of the Santa Claus rally, the first five days (FFD), and the January effect are key going forward because of their long-term accuracy. However, with so many aware of the trifecta and so many pumping it, we wonder if it still be effective. The first leg was decidedly mixed. The Santa Claus rally started December 21, and ended on January 3. The S&P 500 barely lost 0.1%. The Dow Jones Industrials (DJI) gained only 0.06%. Who’s right? We await the FFD that ends Monday, January 8.
For the first week of the year the S&P 500 (SPX) fell 1.5%, the DJI dropped 0.6%, the Dow Jones Transportations (DJT) was off 2.5%, and the tech-heavy NASDAQ fell 3.3%. The Dow Theory divergence between the DJI and the DJT is becoming more pronounced. The averages must agree with each other. They are not and that suggests the market should fall. The S&P 400 (Mid) was down 2.5% while the S&P 600 (Small) dropped 3.6%.
In Canada, the TSX Composite was a star, falling only 0.1%, while the TSX Venture Exchange (CDNX) dropped 0.3%. Overseas, in the EU market the London FTSE fell 0.6%, the Paris CAC 40 was off 1.6%, and the German DAX fell 0.9%. In Asia, China’s Shanghai Index (SSEC) fell 1.5%, the Tokyo Nikkei Dow (TKN) was actually up 0.4%, while Hong Kong’s Hang Seng (HSI) fell 3.0%. The MSCI World Index dropped 1.7%. All in all, it was not a great start to the new year. Based on history, it could suggest a difficult 2024. But our trifecta isn’t over yet. Or, as we say, 2024 could be a year of chaos, dysfunction, and volatility.
We are coming down off some extreme overbought levels. We’ve never seen the DJI, for example, spend so long with an RSI that’s not only over 80 but over 85. Rare for sure. So, does that bode poorly? At the highs, the SPX was 9.7% above the 200-day MA. We’ve actually seen worse. So, a correction back to that 200-day MA just seems normal.
The 200-day MA is currently at 4,369. The SPX bounced back after that suspected key reversal day on December 20. It seemed to invalidate the key reversal signal moving to new highs. But, after making a new all-time high at 4,793, we are now below the low of the key reversal day which was at 4,698. Friday, we closed at 4,697. That suggests to us that we could see further selling next week.
Yes, we had some decent economic numbers, but we also had some, like manufacturing indices, in recession territory. The job numbers on the surface looked good, but dig underneath as we attempt to do and things were not quite as rosy. Trouble continues to brew on the geopolitical side, and U.S. politics in an election year is completely dysfunctional. Over half the world holds elections this year, including the U.S., Russia, and India. If governments fall, Canada and the U.K. could join them. That alone guarantees a volatile year on the political scene.
Ongoing raging wars and disruptions on the geopolitical side guarantee more volatility, chaos, and dysfunction. And dare we mention the risk of extreme weather which seems to dominate now. Extreme weather is sparking mass migrations from south (the most impacted) to north.
That is causing chaos, volatility, and dysfunction at borders, whether they be in the U.S., Canada, or the EU. And that in turn feeds into dysfunction in domestic politics as one side wants to bar these migrations completely, while the other side wants to help them but in a controlled manner. Neither side can solve the dysfunction and chaos in the countries suffering from extreme weather events of which drought is the worst. But floods, hurricanes, extreme heat, wildfires, and more also play a role. Especially with so many of them becoming constant.
Chaos, dysfunction, and volatility seem to be the emerging theme for 2024. Will the stock market survive? Right now, we see a bit of an air pocket for the SPX until we reach 4,500/4,600. Only new highs can save this now.
Is the AI craze over? We ask that as the year got off to a shaky start with the NY FANG Index falling 3.5%. By extension, the Magnificent Seven that dominate the FAANGS also had a bad week. The Magnificent Seven were chumps this past week—all down. The leader was Apple, off 5.9%. It has woes. Amazon lost 4.4% as it faces upstarts. Tesla fell 4.4% as it also faces upstarts and questions. A weak Magnificent Seven led to a down week for the NASDAQ, off 3.3%, and as noted the S&P 500 fell 1.5%.
What goes up fast comes down in a hurry. If it turns out the AI run is over for the moment, then 2024 could prove to be a difficult year. No, technology is not going to go away. Not for information, medical, or even more. Technology remains the future. Too bad it couldn’t solve the political dysfunction.
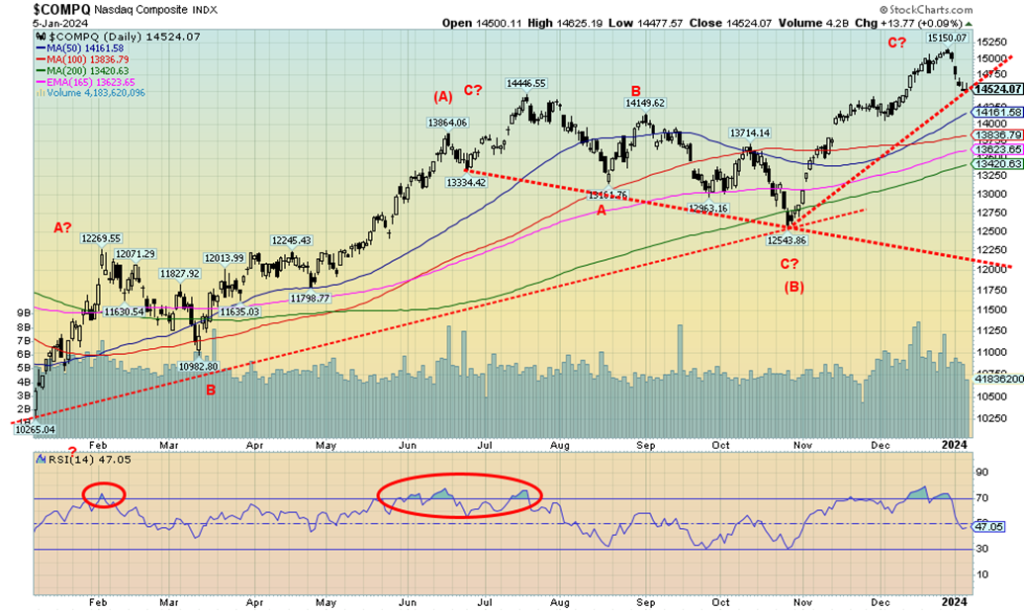
AI could be disruptive to elections as misleading information is pumped out. The NASDAQ is at a level of support, but a break of 14,500 should send it lower. Support is readily seen from 13,400 to 14,200. But if 13,400 should fall we are most likely headed to 13,000 and even down to 12,200 where that down-sloping trendline comes in. AI and technology are still going to dominate going forward. But the Magnificent Seven that have had a spectacular run may be finally ready for a pause.
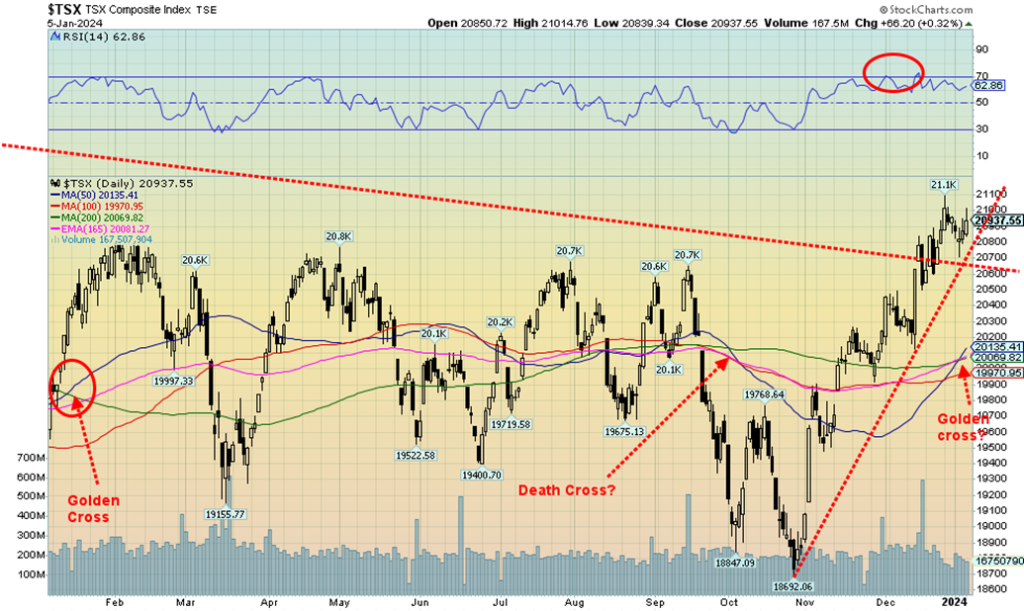
Like the U.S. indices, the TSX Composite started the year on a down note. But it was a pretty muted one as the TSX only lost an insignificant 0.1% in the first week of 2024. The junior TSX Venture Exchange (CDNX) was almost as good, losing only 0.3%. Canada outperformed the U.S. If there was a star sector on the week, it was the second-largest sector, Energy (TEN). TEN gained 3.2%. It seems it overcame the losers that saw Golds (TGD) lose 3.0%, Information Technology (TKK) down 2.8%, Metals & Mining (TGM) off 2.4%, and Consumer Discretionary (TCD) falling 2.3%.
It’s surprising the TSX wasn’t down more, given that ten of the 14 sub-indices were down on the week. In 2023, five of the 14 fell on the year. Leading the down thrust was Telecommunications (TTS), down 7.3%. Utilities (TUT) dropped 4.3% while Materials (TMT) was off 3.3%. The star of the year was Information Technology (TKK), gaining 56.0% while Health Care (THC), previously a loser, gained 22.1%. But it was coming from depressed levels. Now we look at things and last year’s loser Telecommunications has some potential for 2024. On the other side, after the great runs of technology, it might pause in 2024.
However, commodities—golds, metals, materials—show good potential for 2024. The TSX broke above the trendline that defined a series of highs throughout 2023. But is it a true breakout or a false one? We’ve laboured since and volume tailed off on the breakout. A move back under 20,500 might seal the market to the downside. We are now some distance from the 200-day MA near 20,070. The result is, current levels may not be technically sustainable. It has been a rapid rise since the October low at 18,692. We are up 12%. We also see five waves up, so a correction may be coming. We also have a golden cross. A drop under 20,600 is the first sign of trouble.
U.S. 10-year Treasury Bond/Canadian 10-year Government Bond (CGB)
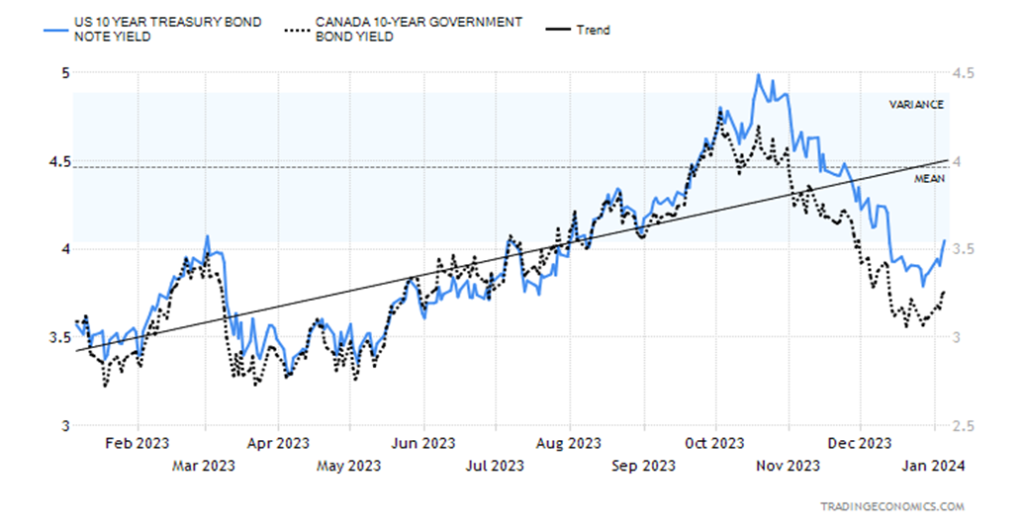
If there was one thing that went up this past week it was bond yields. The U.S. 10-year treasury note ended the year 3.87%. On Friday, after the stronger than expected job numbers, we jumped to 4.05%, a good 4.7% jump on the week. The Canadian Government of Canada 10-year bond (CGB) also rose to 3.26% from 3.11% at year end. But it wasn’t just the stronger than expected U.S. job numbers that helped push yields higher. Other economic numbers were also better.
The week started with the S&P Global Manufacturing Index that came in at a recessionary 47.9 (anything below 50 is considered recessionary). The market had expected 48.2 and November’s reading was 49.4. JOLTS job openings were 8.79 million. The market expected only 8.75 million and November’s was 8.85 million. Lots of job openings still. The civilian labour force is 167.45 million and 161.18 million are employed. But the total population over 16 is about 268 million.
However, 100.5 million are not in the labour force—retirees, students, disabled persons, those in prison, etc. So, take employed plus job openings and we are above the size of the civilian labour force. The ISM Manufacturing Index was also recessionary at 47.4 vs. 46.7 and the expected 47.3. Initial jobless claims surprised, coming in at 202,000 below the expected 225,000 and last week’s 220,000. Continuing jobless claims were 1,855 thousand vs. 1,886 thousand and the expected 1,883 thousand.
The S&P Global Composite was 50.9 which is pretty neutral. The expected was 51. After the job numbers, nobody paid much attention to factory orders that jumped 2.6% in November, above the expected 1.8% and October’s decline of 3.4%. The FOMC minutes were revealing, only in that they hinted that rates could come down in 2024, but they should also remain elevated. The 10-year climbing back over 4% was significant, but can it hold the level? We still have a way to go to 4.50% and a mean level.
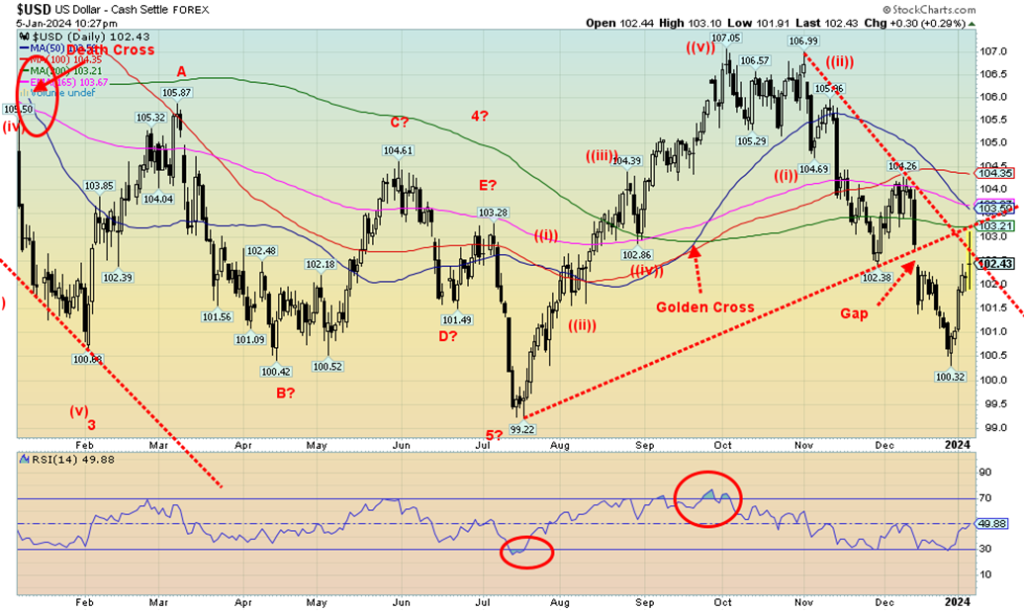
The US$ Index (USDX) gapped down in December, breaking firmly under 103, a point we had long held to be important to the support of the index. After plunging swiftly to near 100, a rebound rally came out of the blue, sending the index swiftly back to 102. With Friday’s release of the stronger than expected job numbers, the US$ Index had a wild day. First it jumped sharply to 103, then it seemed to realize that maybe the numbers weren’t as strong as first indicated and we collapsed back to 102. We finally settled in the middle at 102.43. The downtrend line from the recent September/October highs was penetrated, but the USDX didn’t hold up and closed under the level. So, will we regain 103 which is now resistance or are we headed lower?
Yes and no. We are most likely headed lower, but the correction that began from the low of 100.32 may not yet be over. From the 106.99 high seen in October, we appear to have fallen in five waves. So, a correction is not unusual. We may even take out 103, filling that December gap. As long as we stay under 104, we should eventually resume the downtrend. 102 is support, but below that we could fall again towards 100.
Gold doesn’t know what to do, it seems. Should gold be paying attention to the Fed and the continued stronger than expected economic numbers? Or should it be focusing on global dysfunction with the wars between Russia/Ukraine, Israel/Hamas, the rising tensions in the Middle East, particularly today in the Red Sea, and the political dysfunction in the U.S.? Right now, it seems to be a bit of both and the result is mixed for gold prices. Yes, they remain at or near record levels, but $2,100 seems to bedevil the gold bugs.
That gold hasn’t fallen too far away from that level keeps everyone guessing (hoping?) that soon $2,100 will be seen in the rear-view mirror. Still, gold’s performance is stellar when compared to silver. Gold even gained 13.5% in 2023 compared to silver’s gain of a feeble 0.2%. But it was still under the performance of the S&P 500 that was up 24.2%. Seems gold needs to be a member of the Magnificent Seven to really gain prominence. And Bitcoin has grossly outperformed gold over the past year as Bitcoin was up 154% in 2023, leaving gold and everyone else in the dust.
The year started poorly for the gold bugs with gold down 1.1% while silver fell 3.2%. Platinum fared worse, down 5.0%. Near PMs such as palladium were down 9.0% and copper fell 2.1%. The gold stock indices were also down in conjunction with the market, with the Gold Bugs Index (HUI) down 4.3% and the TSX Gold Index (TGD) off 3.0%.
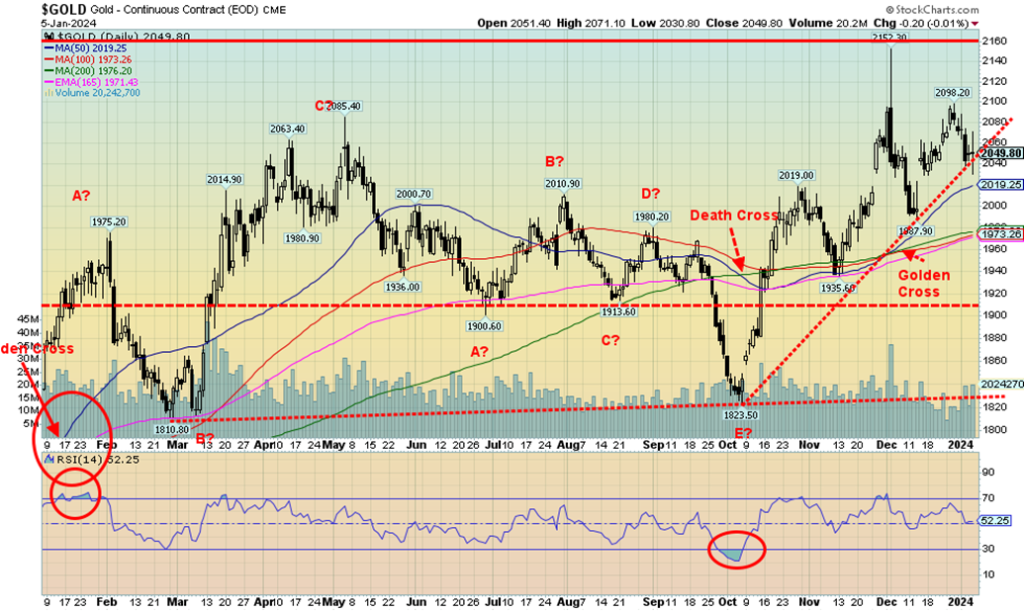
Next week could be key for the entire sector. We’d rather not see two weeks in a row down to start the year. Sure, we did get a golden cross in early December, but we haven’t really had any joy since. We are down about 5% from that spike high to $2,152. But remember that spike came in thin overnight trading and it was NY traders that hammered gold lower on December 4, setting up what appears as a key reversal day.
On Friday, following release of the stronger than expected U.S. job numbers, we saw gold sell down. Gold reversed and was up, then down again, and eventually finished the day with a miniscule loss. Actually, it was a wide-ranging day with gold closing pretty well where it opened. That hesitation could suggest that next week we could follow the recent minor trend down, or we could reverse and start going back up.
Can’t say we love this, but it is what it is. The MACD is in a sell mode on the dailies but in a buy mode on the weeklies and monthlies. We lean with the longer-term indicators suggesting we should revert soon to the upside. The commercial COT isn’t helping as it is last at 23.8%, not exactly bullish. Silver’s commercial COT is better at 30.0%, but it too is no screaming positive. Maybe it is just all reflecting the confusion of the market.
However, Friday’s action, at least for the moment, seems to suggest that Fed policy is more important than geopolitics. But we also know that could change suddenly. $2,100 remains elusive, but if we do break over that level again, we suspect we could begin a strong run to the upside. Support is seen at $2,040, better support at $2,020, but under $2,000 we are very cautious.
A prolonged break under $1,975 could suggest more downside to come. The large patterns formed over the past few years still suggest to us that the next major trend is to the upside. The gold bugs will be happy to hear that, but we confess hearing forecasts of gold $5,000, $10,000, and even higher seems to be a pipe dream. Frankly, we’d be happy just to see a sustained rise over $2,100 for starters.
Silver prices continue to bedevil everyone. The past three years have been an exercise in frustration. Yes, there is a supply imbalance between gold and silver, given there is a lot more silver in the ground than there is gold. Unlike gold, silver is an industrial metal so supply/demand becomes quite important. Nonetheless, silver supply in warehouses seems ample, even though some analysts believe silver is actually in supply deficit.
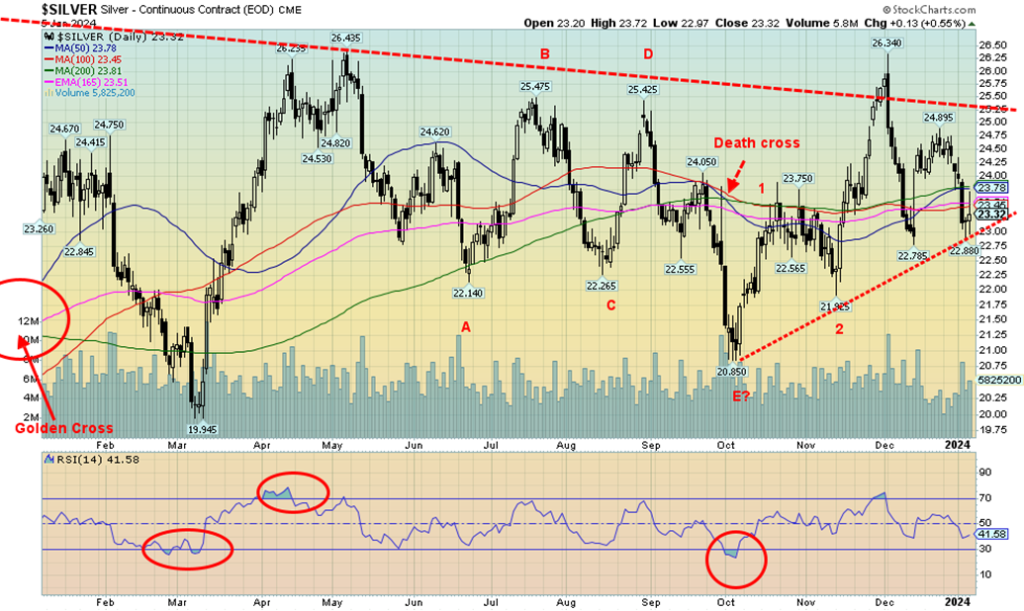
The current gold/silver ratio is at 88 a far cry from the 31.5 seen at the 2011 high for both metals. On an inflation- adjusted basis, silver isn’t even close to its 2011 high which was at $166 vs. today’s $23. We do seem to be holding, at least for the moment, an uptrend line from the October low of $20.85. But we are far from the major breakout over $26 and preferably over $27. That seeming breakout in November that sent silver to a high of $26.34 appears now as what we term a false breakout.
The long correction from May appears to have unfolded in an ABCDE-type pattern. The rise so far is quite inconclusive. Key areas to hold above are seen at the November low of $21.93. The result is, we don’t want to see silver break $22.50 as that would indicate to us that potentially we could break under $22.00. Near term, we need to regain above $24 to begin to suggest we have made a low. Oddly, we may have made a golden cross in early January before that big drop came in on January 3. Hence our desire to see silver regain back above $24 while holding above $22.50.
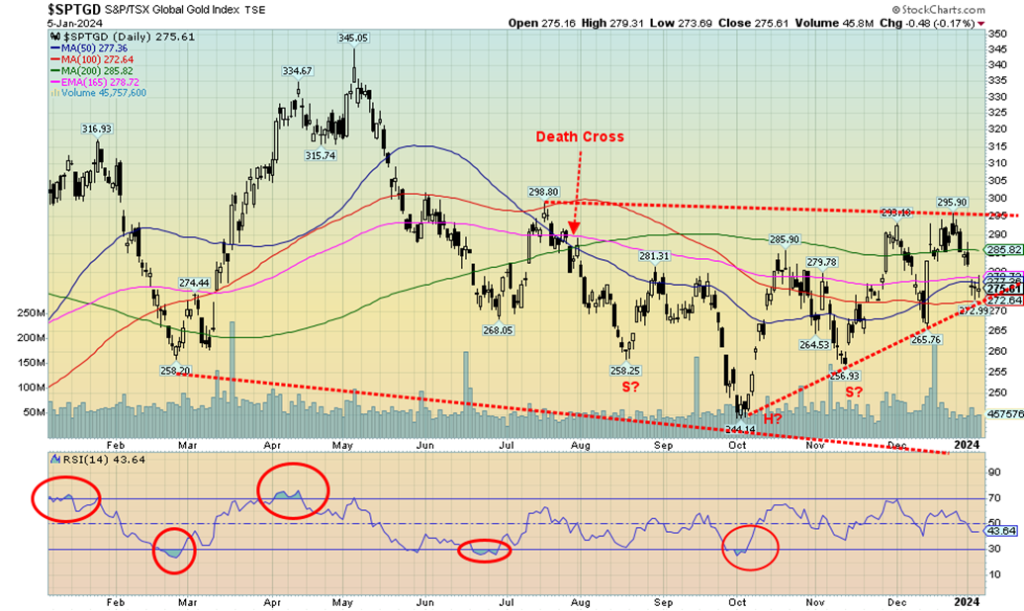
Gold stocks joined the downward drift to start the year this past week. The TSX Gold Index (TGD) fell 3.0% while the Gold Bugs Index (HUI) was off 4.3%. It didn’t help that gold, silver, and platinum were all down on the week as well. While it doesn’t really show on the HUI chart, the TGD appeared to gap down on Wednesday. If both the HUI and the TGD had gapped down, we’d have more confidence in the gap. But the same pattern doesn’t show on the HUI. So far, the TGD seems to be holding support at an uptrend line from the October low of 244. However, a break of 270 would most likely ensure we are headed lower. Still there is a small space to be filled for the TGD between 278 and 281.
It all becomes academic if the TGD successfully regains above 285. But the real stopper is up around 295/300. We need to successfully break above that level to suggest that what appears as head and shoulders bottom pattern is fulfilled. If successful, then potential targets are up to 345/350 and the May 2023 high. At no point, however, do we want to see the TGD break under 265. It would all be over on a break under 257. While the MACD indicator is in a sell mode following negative divergences, overall, the gold stock indices are stuck in neutral.
Even the Gold Miners Bullish Percent Index (BPGDM) is at 50 which is about as neutral as one can get. Our stance towards the gold stocks remains positive; however, we remain wary, especially if any of the points above are broken to the downside. Gold stocks have been underperformers now for the past three years since a major top was seen in August 2020 at 374. The all-time high is even further way at 455 seen in 2011. Twelve years of a largely bear market with occasional nice runs as we saw in 2016 and 2019/2020 is enough to drive the gold bugs to drink. Their time is overdue.
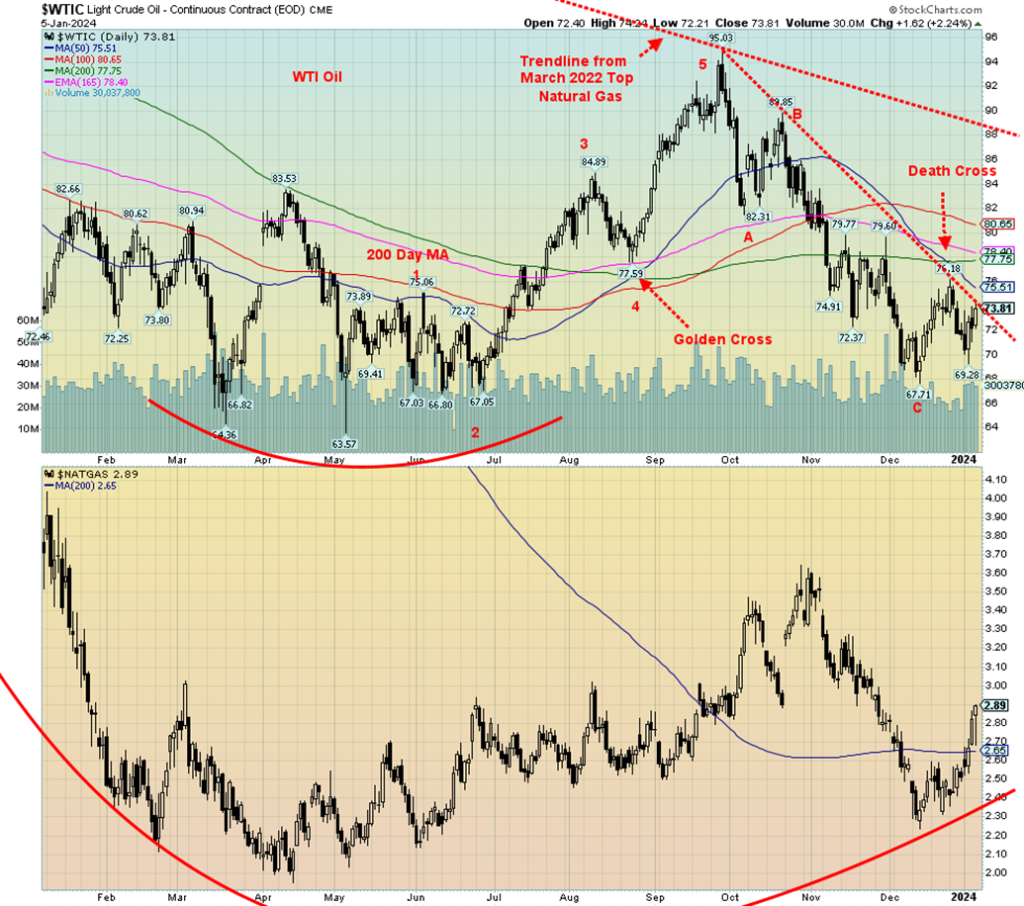
Middle East tensions continue to be the prime reason why oil prices are rising. The amazing part of it is the rise thus far has been pretty muted, with some up days followed immediately by down days, depending on how the market feels the tensions are going. WTI oil gave the infamous death cross back in December, only four months after we had the golden cross. It’s never been a favourite indicator of ours, but we note its popularity, especially with the media.
U.S. crude inventories have been falling recently, which adds a little extra pressure to the price. But gasoline stocks have been rising. On the week, WTI oil was up 2.8%, Brent crude up 2.1%, natural gas (NG) up 12.9%, while NG at the EU Dutch Hub rose 6.8%. The indices were mixed as the ARCA Oil & Gas Index (XOI) rose 0.9% but the TSX Energy Index (TEN) was up 3.2%.
Currently we are seeing signs of a bottom for WTI oil. However, it has not as yet been confirmed. We note the low at $67.71 and now a higher low at $69.28. To confirm this low, we must break out over that downtrend line currently near $74. Preference is taking out the recent high at $76.18. We have a long way to go to take out that downtrend line from the 2022 high. That currently lies just above $88. If we start breaking above that level, the odds are we are going to go much higher.
NG appears to have recovered from its recent slump and is now trading over its 200-day MA once again. This is a positive development. So far, NG is taking on the look of a spike bottom. We’d prefer we once again break above $3 to confirm a low.
We are now moving into the sweet season for oil and gas, a period that can last into June. If the Middle East were to explode, we might see even higher prices. The bench mark remains 2008 when WTI oil hit $147. As far as the tensions in the Middle East are concerned, the attacks in the Red Sea are a problem for oil; however, the real problems could arise if conflict broke out between Israel/U.S./Iran and it negatively impacted the Straits of Hormuz, through which 30% of the world’s oil flows.
__
(Featured image by Jonathan Simcoe via Unsplash)
DISCLAIMER: This article was written by a third party contributor and does not reflect the opinion of Born2Invest, its management, staff or its associates. Please review our disclaimer for more information.
This article may include forward-looking statements. These forward-looking statements generally are identified by the words “believe,” “project,” “estimate,” “become,” “plan,” “will,” and similar expressions. These forward-looking statements involve known and unknown risks as well as uncertainties, including those discussed in the following cautionary statements and elsewhere in this article and on this site. Although the Company may believe that its expectations are based on reasonable assumptions, the actual results that the Company may achieve may differ materially from any forward-looking statements, which reflect the opinions of the management of the Company only as of the date hereof. Additionally, please make sure to read these important disclosures.
Copyright David Chapman 2024
David Chapman is not a registered advisory service and is not an exempt market dealer (EMD) nor a licensed financial advisor. He does not and cannot give individualised market advice. David Chapman has worked in the financial industry for over 40 years including large financial corporations, banks, and investment dealers. The information in this newsletter is intended only for informational and educational purposes. It should not be construed as an offer, a solicitation of an offer or sale of any security. Every effort is made to provide accurate and complete information. However, we cannot guarantee that there will be no errors. We make no claims, promises or guarantees about the accuracy, completeness, or adequacy of the contents of this commentary and expressly disclaim liability for errors and omissions in the contents of this commentary. David Chapman will always use his best efforts to ensure the accuracy and timeliness of all information. The reader assumes all risk when trading in securities and David Chapman advises consulting a licensed professional financial advisor or portfolio manager such as Enriched Investing Incorporated before proceeding with any trade or idea presented in this newsletter. David Chapman may own shares in companies mentioned in this newsletter. Before making an investment, prospective investors should review each security’s offering documents which summarize the objectives, fees, expenses and associated risks. David Chapman shares his ideas and opinions for informational and educational purposes only and expects the reader to perform due diligence before considering a position in any security. That includes consulting with your own licensed professional financial advisor such as Enriched Investing Incorporated. Performance is not guaranteed, values change frequently, and past performance may not be repeated.


TopRanked.io Weekly Affiliate Digest: What’s Hot in Affiliate Marketing [Changelly Affiliate Program]
It's official. TikTok is (potentially) dead. And, if you believe the news, that's gonna destroy thousands of small businesses and...


Terre et Lac Launches Crowdfunding for a Photovoltaic Power Plant
Terre et Lac, a Lyon-based company, launches a crowdfunding campaign for a solar plant in Voreppe. Residents of Isère and...


Qonto, Ledger, and Younited Credit, Leading Trio of the French Fintech Ecosystem
Qonto emerges as the top fintech in the latest rankings after its successful Series D funding. The 2024 Fintech 100...


Cannabis Clubs: Germany Introduces Strict Regulations
Germany introduces new regulations aimed at tightening control over cannabis clubs, following recent reforms. The Cannabis Act (CanG) allows limited...


Merck Invests Over 300 Million Euros in a New Research Center in Germany
Merck invests over 300 million euros in a new biotech research center in Germany, part of a larger 1.5 billion...
 |
|
 |  |
 |
|
-

 Markets6 days ago
Tariffs Have Been Imposed by the U.S. Against a Growing Number of Countries
-
 Impact Investing2 weeks ago
Environmentalists and Consumers Denounce Repsol for Greenwashing
-

 Cannabis3 days ago
Cannabis in Canada: Trends, Statistics and Social Impact
-

 Impact Investing1 week ago
The World’s Largest Insurers Have ESG Blind Spots, According to ShareAction