Business
What does the global pay scale look like?
Where are you on the global pay scale? Here’s a quick compare and contrast of an average Joe’s net income from across the globe.

Finally! I recently came across this great analysis that the OECD (the Organization for Economic Co-operation and Development) did to show how well-off workers in different countries are after adjusting for income and entitlement taxes, like social security and healthcare.
Basically, it measures what people get paid for a fair day’s work.
And we’re not talking average household income here. Household numbers are affected by choices—whether both spouses work full-time, one part-time, or one not work at all. Female participation rates AND the number of kids one chooses all have an effect on per capita numbers.
Looking only at individual incomes gives us the clearest picture we can get (with some caveats, which I’ll discuss in a minute).
Check out this chart from the OECD. It looks at total average wage income, the total tax rate to deduct from that income, then the net average wages.
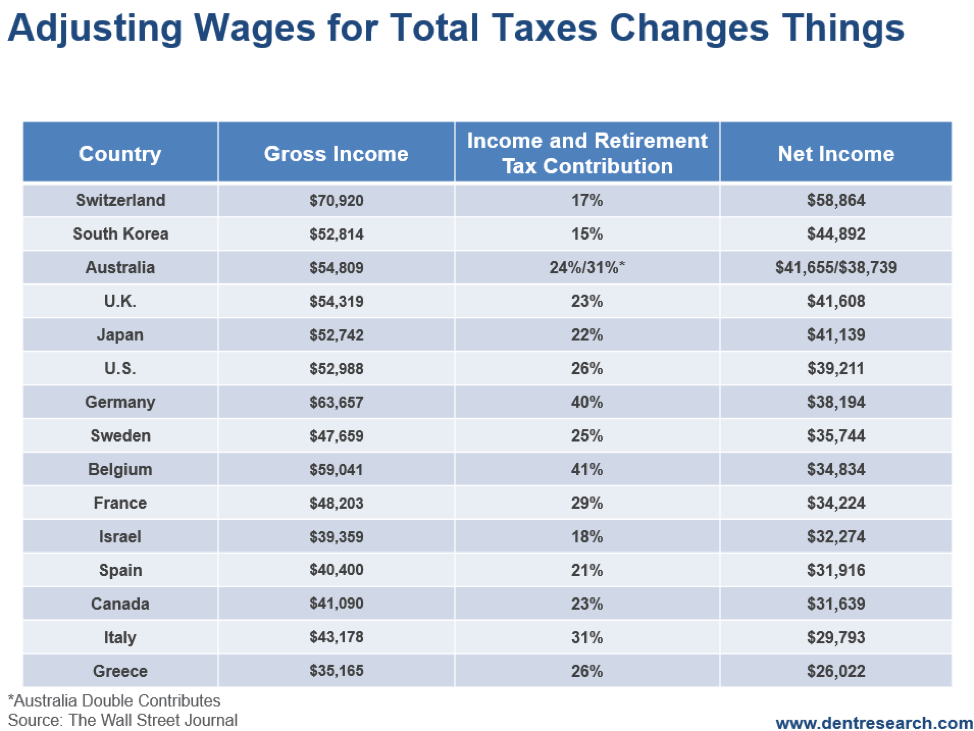
Notice how Australia has an asterisk and double numbers. It doesn’t have social security but instead (and what I believe is a better system) superannuation.
The Oz government requires individuals to place a flat 7 percent of their annual income into a fund that they manage within rules and guidelines, and use that for their own social security. So, I added that 7 percent to the total tax rate and reduced the reported numbers in this table by that. Focus on the second net wages and tax rate.
The top four for net wages are Switzerland at $58,864, South Korea at $44,892, U.K. at $41,608 and Japan at $41,139.
Japan’s problem is low overall labor participation rates due to aging slowing its economy and generating lower GDP per capita.
Switzerland has the highest cost of living, which substantially offsets its high gross and net income.
The bottom four are Greece at $26,022, Italy at $29,793, Canada (surprisingly) at $31,639, and Spain at $31,916.
Greece compensates a bit by having the lowest cost of living, as does Spain.
The lowest tax rates, in order, are Korea, Switzerland, Israel, and Japan. Those with the highest are Belgium, Germany, Italy, and Australia (if you count its superannuation at seven percent). And keep in mind that in Italy health care is essentially free, even before retirement.
There’s another factor to consider: cost of living. The three most expensive places to live are Switzerland, Australia (due to its housing bubble), and Israel.
Two of the three countries with high costs of living also topped the chart for highest gross and net income. Israel falls short with an average net income of $32,274 per individual while being one of the top for comparative costs of living.
The cheapest three countries to live in are Greece, Spain, and Korea. So, that boosts their real net income a bit.
To sum it up, the countries with the best income, adjusted for taxes and cost of living for a single worker, in order, are Korea, Japan, Switzerland, U.S., and Germany (with the U.K. just behind Germany). The worst are Israel, Italy, Canada, Sweden, and Greece.
In the U.S., we come out well above average, but certainly not on top.
—
DISCLAIMER: This article expresses my own ideas and opinions. Any information I have shared are from sources that I believe to be reliable and accurate. I did not receive any financial compensation for writing this post, nor do I own any shares in any company I’ve mentioned. I encourage any reader to do their own diligent research first before making any investment decisions.


PayPal’s Slowdown: From Fintech Leader to Low-Growth Dividend Stock
PayPal has shifted from fintech leader to low-growth, value-style stock, losing over 25% in market value and trading at a...


Tilray (TLRY) Falls as Bearish Momentum Persists Despite Marketing Push
Tilray (TLRY) fell 3.32% to $4.44, remaining below key moving averages and signaling continued bearish pressure. Despite a £1 million...


ESG Gap Persists as Firms Struggle to Link Sustainability to Financial Value
KPMG’s Global Survey shows a major gap between ESG awareness and financial integration. While 72% of managers understand sustainability strategies,...


Bitcoin and Ethereum Slide as Market Pressure Builds Amid Strategy Concerns and Layer 2 Disruptions
Bitcoin fell below $60,000 with heavy ETF outflows, pressured by concerns over Strategy’s finances and its STRC stock decline. Ethereum...


AI Venture Builder Launches €600K Crowdfunding Round to Scale Secure AI Solutions
AI Venture Builder, an Italian-British firm developing AI applications and vertical startups, returns to CrowdFundMe with a equity campaign. After...
 |
|
 |  |
 |
|
-
 Markets2 weeks ago
Rising Inflation, Fed Uncertainty, and Market Excess Amid War and SpaceX Mania
-
 Markets3 days ago
Commodity Markets Pause as Oil Falls, Metals Correct, and Grains Show Mixed Signals
-

 Africa1 week ago
Egypt’s Net Foreign Assets Rise as External Position Continues Gradual Strengthening
-

 Markets5 days ago
Cocoa Market Faces Mixed Trends Amid Rising Supply and Weak Demand
You must be logged in to post a comment Login