Markets
Quiet Markets Mask Rising Volatility and Uncertain Outlook
Markets were quiet despite wide ranges, as Fed held rates but dissent and hawkish odds unsettled investors. Yen surged after intervention. Stocks ended slightly higher, though outlook remains negative. Bond yields rose, dollar fell. Gold correction may be ending amid rising volatility. Oil fluctuated with geopolitical tensions and politics, appearing in a broader corrective phase.


As was generally expected, the Fed left interest rates unchanged at its FOMC meeting this past week. The U.K. and Japan also left their interest rates unchanged. The Fed vote was not without dissent.
Three of the FOMC members dissented and instead wanted an interest rate hike. Because of the potential for rising inflation due to resumed hostilities between Iran and the U.S. and subsequent rising oil prices, a rate hike at the September FOMC is a strong possibility. The odds are now 75% the Fed will hike interest rates.
The Fed
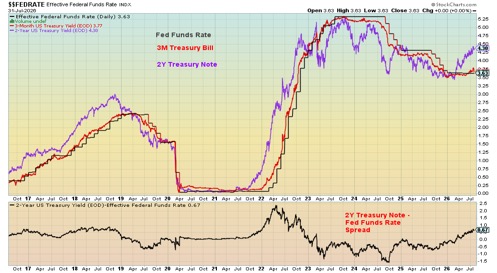
With Fed governor Kevin Warsh no longer providing guidance, we can only guess at what the FOMC’s thinking might be. His after speech was dovish in contrast to the three dissenters. Warsh must be caught between a rock and hard place, given Trump’s desire for lower interest rates and the Fed’s need to follow the data. U.S. borrowing cots have now hit the highest level since 2007. With $39.7 trillion in federal government debt alone, that’s not a good place to be. In 2008 the federal debt was only $10.4 trillion. Since then, it has almost quadrupled.
But debt has exploded everywhere. The total U.S. debt (government – federal, state, municipal, plus corporate, banks, and households) was only $50.5 trillion in 2008. Today it is $113.6 trillion, more than double the 2008 amount. The federal government debt exploded because of the 2008 financial crisis and the 2020 pandemic. These debt numbers do not include the potential debt in the shadow banking system. That debt is largely outside the system. Private equity, private credit, and hedge funds dominate that sector. If a debt blow-up occurs, that is a likely place where it will happen due to their huge use of leverage.
Jerome Powell’s term as Fed governor was not renewed because he refused to bend to Trump’s will. Is Trump expecting Warsh to bend to his will? That’s what Trump wants. But Warsh is only one vote on the FOMC and right now three wanted higher rates while nine agreed to keep rates unchanged. Jerome Powell remains on the board. Meanwhile, Trump claims Warsh wants lower interest rates, and rogue FOMC members are being political, so Trump claims. Warsh could become squeezed between Trump and his fellow FOMC members.
Adding to the difficulties for the Fed was the latest release of the advance Q2 GDP growth. It came in at 1.5%, below the previous report of 2.1% and below expectations of 2.1%. A slowing economy? More problems for the Fed. What’s worse, the PCE (Personal Consumption Expenditures price index) advance for Q2 was 5.1% vs. 4.6% and expectations of 4.0%. However, the June PCE year over year did slow to 3.7% from 4.1% and about on expectations. Given June was a month when oil prices fell, that shouldn’t be a surprise.
However, it may only be temporary. A slowing economy and rising inflation = stagflation, presenting a big problem for the Fed and Warsh. No wonder some thought he came across as hesitant in his speech.
Market reaction was mixed as the stock market, already under pressure, fell further. In keeping with the yo-yo market, it rose the next day, but the trend is turning down. Bond yields rose. Meanwhile, gold, which does not normally like rising bond yields rallied instead, doing the opposite of expectations. For gold, we view that as positive. The US$ Index fell and has now fallen further, thanks to the lower than expected Q2 GDP. Given rising interest rates, this is showing considerable weakness for the U.S. dollar. And that is ultimately positive for gold.
Gold
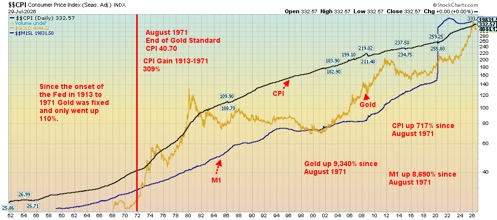
Gold, we believe, is getting ready to rise again. Our first chart above shows that gold prices rise when the CPI (Consumer Price Index) goes up and money supply (M1) increases. Not shown is the U.S. debt which is at record levels. Most of this has taken place since Nixon and the U.S. took the world off the gold standard in August 1971, cementing the U.S. dollar’s reserve currency status.
While many objected to the gold standard as it was constraining, it nonetheless played a role in keeping inflation, money supply growth, and debt down. After August 1971 that was no longer the case. Fixed exchange rates became floating exchange rates. Debt, money, and inflation all soared. Gold followed, or did it lead? With debt still rising, inflation perking up, and money supply starting to grow again, another rise in gold prices is almost inevitable.
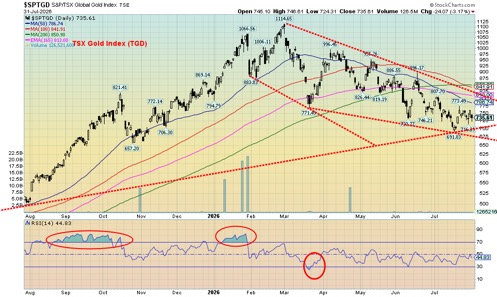
Since it topped in January 2026, gold has been on a steady decline. At the same time, the war between Iran/US/Israel escalated interest rates. Gold does not like rising interest rates. Since the outbreak of war on February 28, 2026, gold has fallen over $1,300 or 24%. Silver (down 61%) and the gold stocks (Gold Bugs Index (HUI) down 36%, and the TSX Gold Index (TGD) down 33%) have fallen even further. Meanwhile, the 2-year U.S. Treasury note rose 88 bp or 26% and the U.S. 10-year Treasury note is up 72 bp or 18%.
Recently, even with bond yields rising further, gold is holding above $4,000 and is acting positively now towards rising bond yields. If gold is bucking rising interest rates, that again suggests that a rise in gold prices could be inevitable.
Finally, we note that the Gold Miners Bullish Percent Index has been hovering in the oversold region now since March. Over the past decade, that’s the lowest and the longest period we’ve seen for the gold miners to languish in oversold. Before that, the last time we saw it this low was in 2008, 2013, and 2015, periods when gold had fallen sharply and the gold miners even more. After the 2008 low, gold and the gold miners rose to record levels. While 2013 didn’t prove to be the final low, the 2015 low is now noteworthy as an important cyclical low. Since then, gold and the gold miners have never been that low.
All this points to the potential for gold, silver, and the gold miners to begin another rise. Given recent divergences that are positive towards gold, silver and the gold miners, we could be getting closer.
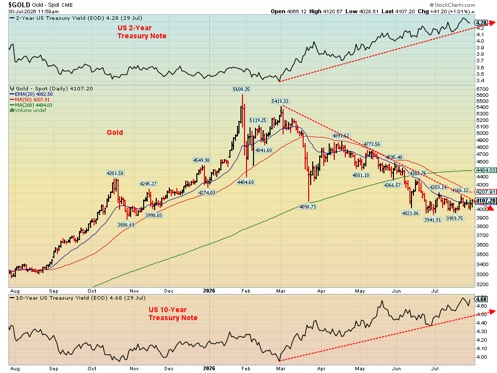
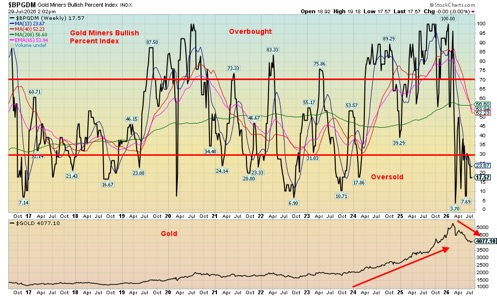
Chart of the week
Key takeaways
- The CBOE Volatility Index (VIX) measures the market’s expectation of 30-day volatility for the S&P 500
- VIX values above 30 indicate greater market fear and uncertainty, while values below 20 suggest stability
- Investors use VIX to assess market risk and sentiment, and trade VIX-linked futures and options
- The VIX typically rises as the stock market falls, reflecting increased volatility and investor anxiety
- Introduced in 1993, the VIX became a key indicator of U.S. equity market volatility. In 2003, it was designed with input from Goldman Sachs
Source: www.investopedia.com
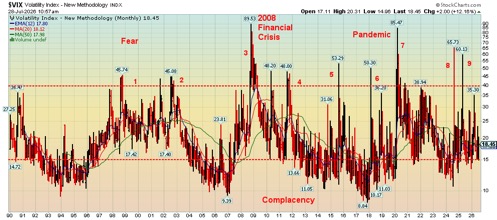
Typically, VIX values above 30 indicate greater market fear. However, we went a bit higher to above 40 where it suggests extreme fear. Conversely, they suggest values below 20 that suggest stability. We moved ours to below 15, suggesting complacency.
As noted, the index started was introduced in 1993 and starts from 1990. We observe there were nine occasions when the market registered extreme fear. Periods of extreme fear are usually short-lived but dramatic. Periods of complacency, however, can drag on as they last months, even years. Note since 1990 there have been four extended periods where the market registered complacency with occasional small bursts higher. Those periods were 1992–1996, 2004–2007, 2012–2015, 2016–2020, and 2023–2024. When each period ended, there was a crisis followed by a sharp market drop and extreme fear.
The VIX can often act as a companion piece to the CNN Fear and Greed Index. Currently, the VIX indicator has been rising but has not yet spiked into extreme fear. The CNN Fear and Greed Index is registering a small level of fear. The move to extreme fear can happen very quickly. It’s the old adage, that the market weakens gradually, then suddenly.
We are seeing that global risk appetite is falling. The market is more volatile but still not in any danger zone. Market risk is rising. The shadow banking system is bigger than the actual banking system. The rules are looser and reporting is looser. The shadow banking system can be highly leveraged, and its assets are not as liquid and are mismatched. If problems arise, investors may find themselves unable to get out.
There is equity risk along with interest rate risk, liquidity risk, price risk, foreign exchange risk, and compliance risk because of lack of regulatory oversight. They have little or no access to a lender of last resort. The banking system has the Fed. There is usually a lack of transparency. Remember the Long Term Capital Management (LTCM) 1998 Russian default crisis and the Lehman Brothers 2008 financial crisis. In both cases, the Fed and central banks were required to bail out the banking system to prevent a complete financial collapse
Given a build-up of financial crises over the years, the ability of the Fed and the central banks to bail out the financial system has diminished. Yet another financial crisis is almost guaranteed. Extreme fear and the VIX over 40 will follow.
VIX Spikes 1990–2026
| Fear event VIX spike | What happened |
| 1 – 1998 Russia default/LTCM crisis | 1998 DJI down 19.3% |
| 2 – 2001/2002 dot.com crash | 2001–2002 dot.com crash/911 DJI down 37.8% |
| 3 – 2008 financial crisis | 2008 financial crisis/Great Recession DJI down 53.8% |
| 4 – 2010/2011 EU/Greek debt crisis | 2011 DJI down 16.8% |
| 5 – 2015/2016 China market crash, fall of commodities, Fed hike worries | 2015/2016 DJI down 14.5% |
| 6 – 2018 inflation fears, crowded volatility trades | 2018 DJI down 19.6% |
| 7 – COVID-19 pandemic | 2020 stock market panic DJI down 37.1% |
| 8 – 2024 unwinding of yen carry trade, weak job growth* | 2024 DJI down 7% |
| 9 – 2025 “Liberation Day” tariffs | 2025 DJI down 18.8% |
Note: in 2022, the DJI fell 22.4% on inflation fears, but the VIX stayed under 40 as the decline was choppy.
Markets and Trends
| % Gains (Losses) Trends | ||||||||
| Close Dec 31/25 | Close Jul 31/26 | Week | YTD | Daily (Short Term) | Weekly (Intermediate) | Monthly (Long Term) | ||
| S&P 500 | 6,845.50 | 7,489.72 | 1.1% | 9.4% | neutral | up | up | |
| Dow Jones Industrials | 48,063.29 | 52,485.03 | 1.0% | 9.2% | up (weak) | up | up | |
| Dow Jones Transport | 17,357.19 | 21,039.30 | (6.4)% | 21.2% | down | up | up | |
| NASDAQ | 23,241.99 | 25,373.85 | 1.6% | 9.2% | down | up | up | |
| S&P/TSX Composite | 31,712.76 | 35,226.14 (new highs) * | (0.4)% | 11.1% | up | up | up | |
| S&P/TSX Venture (CDNX) | 987.74 | 867.13 | (0.2)% | (12.2)% | down | down | up | |
| S&P 600 (small) | 1,467.76 | 1,768.56 | 0.4% | 20.5% | neutral | up | up | |
| ACWX MSCI World x US | 67.18 | 75.23 | 1.6% | 12.0% | neutral | up | up | |
| Bitcoin | 87,576.98 | 62,921.23 | (2.0)% | (28.2)% | neutral | down | neutral | |
| Gold Mining Stock Indices | ||||||||
| Gold Bugs Index (HUI) | 701.49 | 617.73 | (1.3)% | (11.9)% | down | down | up | |
| TSX Gold Index (TGD) | 817.76 | 735.70 | (1.8)% | (10.0)% | down | down | up | |
| Bonds% | ||||||||
| U.S. 10-Year Treasury Bond yield | 4.17% | 4.74% | 1.1% | 13.7% | ||||
| 3.3Cdn. 10-Year Bond CGB yield | 3.44% | 3.67% | 1.7% | 7.7% | ||||
| Recession Watch Spreads | ||||||||
| U.S. 2-year 10-year Treasury spread | 0.69% | 0.46% | 31.4% | (33.3)% | ||||
| Cdn 2-year 10-year CGB spread | 0.85% | 0.75% | 7.1% | (11.8)% | ||||
| Currencies | ||||||||
| US$ Index | 98.26 | 99.95 | (1.5)% | 1.7% | down | up | down (weak) | |
| Canadian $ | 72.87 | 71.32 | 0.6% | (2.1)% | up (weak) | down | down | |
| Euro | 117.48 | 115.29 | 1.4% | (1.9)% | up (weak) | down | up | |
| Swiss Franc | 126.21 | 123.72 | 1.2% | (2.0)% | down (weak) | down | up | |
| British Pound | 134.78 | 134.76 | 1.2% | (0.1)% | up | neutral | up | |
| Japanese Yen | 63.83 | 62.92 | 3.1% | (1.4)% | up | down | down | |
| Precious Metals | ||||||||
| Gold | 4,311.97 | 4,047.01 | (0.2)% | (6.1)% | down (weak) | down | up | |
| Silver | 71.16 | 57.78 | (0.7)% | (17.8)% | down | down | up | |
| Platinum | 2,046.90 | 1,660.00 | 3.8% | (18.9)% | neutral | down | up | |
| Base Metals | ||||||||
| Palladium | 1,619.50 | 1,280.00 | 2.9% | (21.0)% | neutral | down | neutral | |
| Copper | 5.64 | 6.50 | 3.3% | 15.3% | up | up | up | |
| Energy | ||||||||
| WTI Oil | 57.44 | 84.63 | (6.0)% | 47.3% | up (weak) | up | up | |
| Nat Gas | 3.71 | 2.70 | (6.3)% | (27.2)% | down | down | neutral | |
Stocks
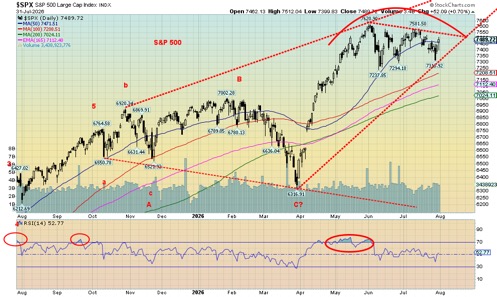
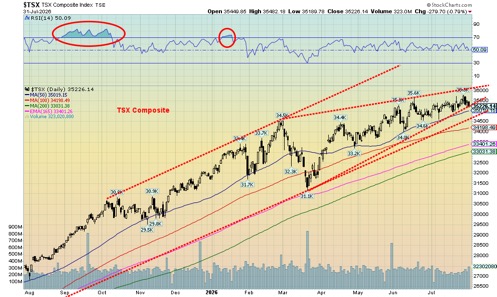
It’s amazing that the stock market continues to hang on, despite everything around it is deteriorating. But so far, we’ve avoided a big breakdown. Yes, the NASDAQ briefly went into correction territory before bouncing back. A possible leading indicator is the Semiconductor Index that at its recent low was in a bear market, down 29%. The NY FANG Index hit correction territory, down 12% at its recent low. It’s the semiconductors that are the biggest concern. The MAG7 ETF, MAGS, fell 15% at its recent low but is now down only 7%. MAG7 stocks down on the year included Tesla (the leader, down over 30%), Microsoft, and Meta.
Despite the backdrop of Middle East tensions, rising oil prices, and rising bond yields, the stock markets were generally up this past week. The S&P 500 gained 1.1%, the Dow Jones Industrials (DJI) was up 1%, and the NASDAQ gained 1.6%, but the Dow Jones Transportations (DJT) was down again, off 6.4%. Rising fuel costs hurt the DJT. The S&P 400 (Mid) was down 0.7% while the S&P 600 (Small) was up 0.4%. The S&P 500 Equal Weight Index made new all-time highs, up 0.6%, while the NY FANG Index jumped 2.6%. Bitcoin was not spared, down 2%. All in all, it was a quiet week.
In Canada, the TSX made all-time highs (barely) but closed down 0.4%. The TSX Venture Exchange (CDNX) continues to suffer, falling 0.2%. In the EU, the London FTSE rose 1.2%, the EuroNext was up 02%, the Paris
CAC 40 gained 1.6%, while the German DAX was up 2.1%. In Asia, China’s Shanghai Index (SSEC) gained 0.5%, the Tokyo Nikkei Dow (TKN) fell 0.4%, Hong Kong’s Hang Seng (HSI) jumped 3.7%, while India’s Nifty 50 was up 2.6%. The MSCI World ex USA Index ETF was up 1.6%. Overall, the week may have been quiet, but indices tended to rise.
In Canada, eight of the 14 sub-indices fell on the week led by Utilities (TUT), down 2.7%. Of the six up, the leader was Information Technology (TTK), gaining 7.5%. Income Trusts (TCM) reached all-time highs but closed down 0.4%. Again, quiet in Canada. Markets may not escape the summer doldrums until September.
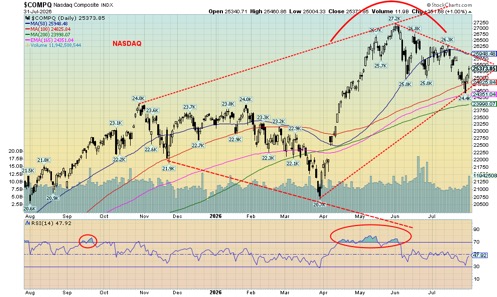
Our wedge triangles for both the S&P 500 and the NASDAQ broke but then they rallied once again. It was a weak breakdown with little follow-through. Still, the larger patterns suggest the formation of a top. It still looks like a wedge triangle but now we have to focus on recent lows. For the S&P 500, a break of 7,200 may start another down move. The NASDAQ has already been trending down. The NASDAQ looks weak and another leg lower would get underway under 24,400. Arguably, new highs would end any discussion of a breakdown right away. But all it means is that the market becomes even more overbought and overvalued.
As we have noted before, a group of 10 stocks have dominated the stock market. The 10 are:
Nvidia (NVDA): Semiconductor and AI hardware leader.
Apple (AAPL): Consumer electronics and digital services giant.
Microsoft (MSFT): Cloud computing and enterprise software titan.
Amazon.com (AMZN): E-commerce and AWS cloud infrastructure provider.
Alphabet (GOOGL/GOOG): Search engine, digital advertising, and AI parent company.
Broadcom (AVGO): Semiconductor and networking infrastructure giant.
Meta Platforms (META): Social media and digital advertising powerhouse.
Tesla (TSLA): Electric vehicle and clean energy manufacturer.
Berkshire Hathaway (BRK.B): Diversified multinational holding conglomerate.
Micron Technology (MU) or Oracle (ORCL): High-bandwidth memory chips and enterprise data infrastructure major.
Source: www.slickcharts.com
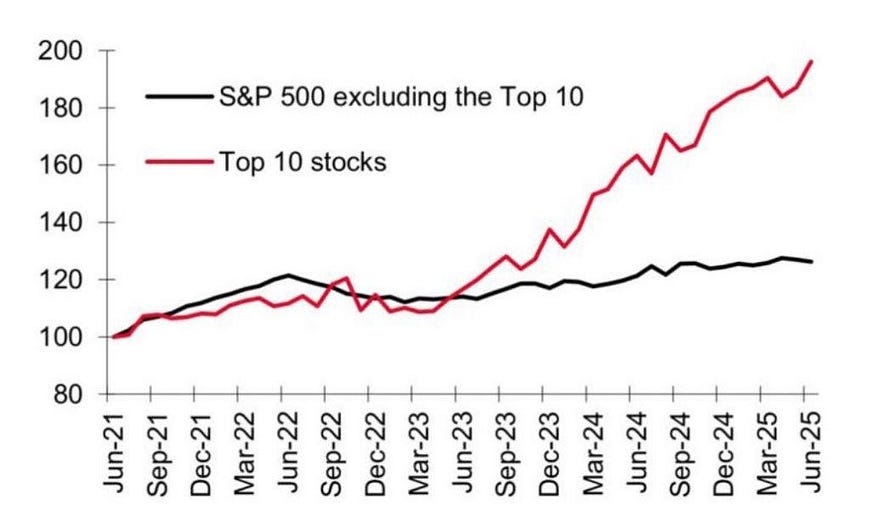
We continue to believe that the stock market is living on borrowed time. For a real break we need a catalyst, like a huge failure in the banking or shadow banking system. The bond market is the most vulnerable to a crash, which in turn could crash the stock market.
Bonds
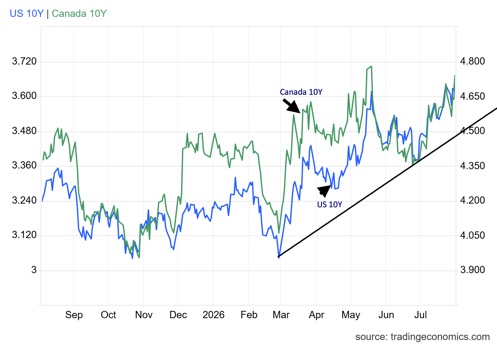
Despite constant attempts by Pakistan and others to restart peace talks in the Middle East, the odds of success are slim. Markets will be excited if they talk peace and oil prices and bond yields will fall. Stocks and gold will rally. Then the shooting starts again and everything reverses. Expect this volatility to continue.
This past week the U.S. 10-year Treasury note rose to 4.74%, up 5 bp on the week. The Canadian Government of Canada 10-year bond (CGB) was up to 3.67% or 6 bp. The 2–10 spread is also rising. In the U.S. it was up 46 bp and in Canada up 75 bp. A widening 2–10 spread continues to suggest that a recession is coming.
The ongoing Middle East war that’s threatening to spread further is the catalyst of higher yields. The insatiable needs of the U.S. government along with huge borrowing demands for AI data centers and more are creating perfect conditions for higher bond yields. That impacts mortgages and a host of other interest rate related products.
The worry is the Fed will hike rates at the September 15–16 FOMC. There were three dissenters at the recent FOMC who were voting for higher rates. Inflation was down in June but expected to poke higher again in July.
The 30-year U.S. Treasury bond is also a worry. The 30-year is at 5.28%, the highest level seen since 2004. It’s not as if the U.S. was the only one experiencing rising bond prices. German bunds, UK gilts, and Japanese JGBs are all rising. The decline in price (yields move inversely to price) since the high of 2020 is the worst bond market since the 1970s. Previous bond crashes have often exposed trouble in the credit markets, resulting in a blow-up. So far, we’ve been fortunate, but will that continue?
Gold and silver
It’s hard to believe, but gold actually closed the month higher, although not by much: 0.7%. Silver wasn’t so lucky and fell 1.6%. As to the stocks, the Gold Bugs Index (HUI) fell 4.1% and the TSX Gold Index (TGD) was down 3.7%. On the week, it was pretty well the same as gold fell 0.2%, silver was down 0.7%, the HUI dropped 1.3%, while the TGD was off 1.8%. Bucking the trend was platinum, up 3.8%, palladium rising 2.9%, and copper jumping 3.3%. We consider copper a leader. If copper is rising, gold will follow. Copper rose 4.7% in July.
Another potential catalyst for gold is the suddenly sinking US$ Index. USDX fell 1.5% this past week despite rising bond yields that are normally quite supportive of USDX. It’s also a bad sign that the U.S. dollar is being sold.
With USDX down, the Cdn$ rose 0.6%, the euro was up 1.4%, the Swiss franc was up 1.2%, the pound sterling was up 1.2%, and, given huge BOJ intervention, the Japanese yen rose 3.1%. Even the Chinese yuan, fixed to the U.S. dollar, rose 0.3%. Not only was the BOJ intervening in the yen market, but apparently the U.S. treasury was as well. A rising yen along with rising Japanese interest rates puts considerable pressure on the yen carry trade (borrow yen, convert, invest in higher yielding securities elsewhere). An unwinding of the yen carry trade could prove quite disruptive especially for the U.S. bond market.
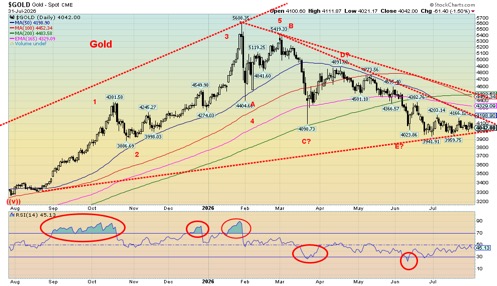
Gold slumped with the resumption of hostilities in the Gulf and oil prices jumping. Despite it all, gold is not making new lows and $4,000 appears to be key support. The pattern is tough to call, but it looks like gold is trying to form a small head and shoulders bottom. Naturally, that is only the case if we hold above $4,000. Break $4,000 and we could quickly fall to $3,400 or $3,600. But realistically it would be the final plunge.
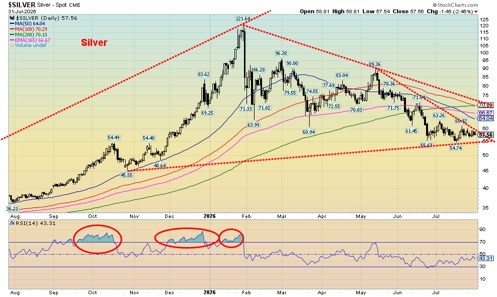
Silver too appears to be forming a small head and shoulders bottom. We break out above $60 but if this fails, a break under $55 suggests a fall to at least around $50. We doubt that but we have to keep it in mind until we break to the upside. Silver firmly breaks out above $70, but the next point at $90 is further away.
Gold and silver normally react negatively to rising interest rates, but this past week with bond yields jumping higher on higher oil prices gold and silver held in and as noted, made no new lows. Not only were bond yields rising but talk became louder that the Fed will hike rates at its September FOMC meeting on September 15–16.
With gold holding $4,000 and silver $55 against a backdrop of rising bond yields but a falling US$ Index, things are looking up for gold as we go into a seasonally stronger period. The August/September period is usually good for gold, but a reminder is that October to December can see gold looking weaker. Then the really strong seasonals usually kick in, taking us to March.
Gold stocks have taken their hits. Especially hit have been the junior developers. Many are now trading at bargain basement prices. But if they come alive, they can rise quickly. The TGD has support at 700 and down to 675, but below 675 spells trouble. We need to break above 850 to suggest a low. Above 1,000 we’re on our way higher.
Oil and gas
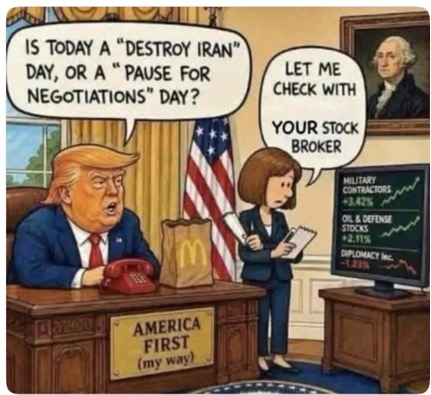
It was a down week for oil, thanks to yet another statement from Trump (TACO man), that a deal or a ceasefire could be on its way. By week’s end, oil prices were rising once again as potential new conflicts and widening of the war appeared to be getting underway. Then the TACO man announced that a deal was imminent. Will oil prices rise or fall this coming week?
Let’s look at the growing conflicts first. The Houthis of Yemen are blockading Saudi oil through the Strait of Bab el-Mandeb, the route from the Red Sea to the Gulf of Aden. It also impacts shipping in the Red Sea. Attacks are being launched on commercial and oil vessels. The Saudis were trying to organize a coalition of Gulf states to combat the Houthis.
The Strait of Hormuz remains blocked, thanks to both Iran and the U.S. The U.S. appears to have reimposed its blockade. There is little chance the strait will open.
Iran attacked U.S. facilities in Jordan, resulting in damage and deaths/injuries. There are U.S. military bases in Jordan hosting U.S. troops. Saudi Arabia and the U.S. launched attacks against Shia militias in Iraq. The Shia militias are aligned with Iran. Iraq claimed it was a breach of their sovereignty. Could a new front open up?
Two ships, including a U.S.-owned gas storage tank, caught fire in Damietta Port, Egypt. The port is near the Suez Canal. It opens the potential for another vulnerable shipping lane from the Red Sea to the Mediterranean and Europe through the Suez Canal. It also might be only a one-off incident. It was said that a drone attack caused the fire.
Ukraine attacked shipping in the Caspian Sea, the world’s largest lake that stretches from Iran to Russia. A Russian missile boat was hit along with two Iranian cargo ships alleged to be carrying arms. The accusation is military hardware is being transported between Russia and Iran. The attack threatens to expand the war further into Europe. Iran has decided not to retaliate at this time.
Ongoing is Ukraine hitting Russian oil refineries as a part of the Russia/Ukraine war. Ultimately, oil refineries offline could result in oil being shut in as there is nowhere to send it for refinement. All oil needs to be refined to change into other products such as gasoline, diesel, and plastics.
Finally, while not directly oil related, we learned that China was sending some 400 air-defense launchers to Iran. The war is spreading. What started as an U.S./Israel launch of an illegal war against Iran now involves Gulf states, including Bahrain, Kuwait, Saudi Arabia, UAE, and Qatar. Also involved, one way or another, are Oman and Dubai. Iraq is now in the war, given the attack from the U.S. and Saudi Arabia. Yemen, as represented by the Houthis, is at war with Saudi Arabia. With the Ukrainian attack in the Caspian Sea, the war has the capability to spread to Europe.
The war in Europe between Russia/Ukraine also involves NATO and the EU as they are providing direct help to Ukraine. China and North Korea are providing help to Russia with North Korea sending troops. China and Russia are most likely also providing arms to Iran as Iran provides arms to Russia. Israel is involved in conflicts with the Palestinians in Gaza and the West Bank. They are also in conflict with Hezbollah in Lebanon. Syria is most likely involved as well. The U.S. provides arms to Israel and Ukraine.
This war is expanding, drawing in more players. Given the current disruption in the Strait of Hormuz and the Red Sea/Bab el-Mandeb, with the potential to expand elsewhere, all this ultimately has a negative impact on the price of oil along with natural gas and a host of other products – fertilizers, petrochemicals, plastics, helium, aluminum, and other minerals.
Impacted are oil and gas prices, chemicals, food prices, gas and diesel prices, as well as other shipping and logistics companies. The Middle East contains some 48% to 51% of the world’s oil supply and over 35% of the world’s natural gas supply. This reminds us how World War I started: gradually over the years as conflicts grew – then suddenly.
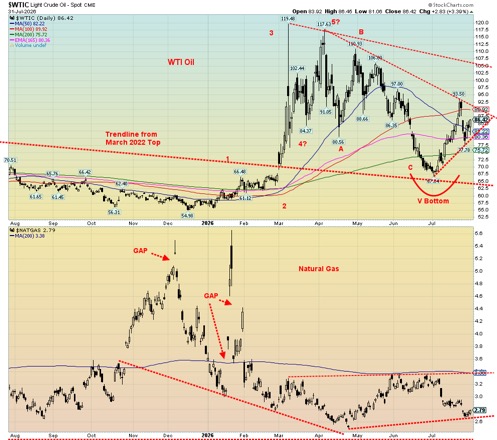
WTI oil fell 6% on the week while Brent crude was down almost 10%. But the market was rebounding at the end of the week as it was becoming obvious the most recent attempt to bring peace was never going to work. With Trump talking a deal again will oil prices fall this coming week?
Natural gas (NG) also fell with NG at the Henry Hub down 6.3% and NG at the EU Dutch Hub down 6%. But in what may be the real direction of the energy market, the ARCA Oil & Gas Index (XOI) rose 1.5% while the TSX Energy Index (TEN) was up 0.9%. The commodity was down while the stocks rallied. Stocks leading is a positive sign, suggesting to us the next move is up.
WTI still needs to break above $90 and especially above $105 now to suggest potential targets of $140 to $160. Could NG be making a double bottom? If there are no new lows and we see a breakout above $3.40, targets could be up to $4–$4.50.
Oil and by extension gasoline will continue to dominate the headlines. There has been talk about OPEC hiking production but given so much of it is in the Middle East it will have little impact. U.S. commercial oil stocks are still dragging down around five-year lows, indeed making new lows, and will need replenishing.
There are no signs that the Strait of Hormuz will open any time soon. Chaos is now engulfing the rest of the region. Oil prices have only one way to go and that’s up. By almost any measurement, despite the Middle East chaos, oil prices are still remarkably cheap at these levels. But probably not for much longer.
Copyright David Chapman 2026
__
(Featured image by Yashowardhan Singh via Unsplash)
DISCLAIMER: This article was written by a third party contributor and does not reflect the opinion of Born2Invest, its management, staff or its associates. Please review our disclaimer for more information.
This article may include forward-looking statements. These forward-looking statements generally are identified by the words “believe,” “project,” “estimate,” “become,” “plan,” “will,” and similar expressions, including with regards to potential earnings in the Empire Flippers affiliate program. These forward-looking statements involve known and unknown risks as well as uncertainties, including those discussed in the following cautionary statements and elsewhere in this article and on this site. Although the Company may believe that its expectations are based on reasonable assumptions, the actual results that the Company may achieve may differ materially from any forward-looking statements, which reflect the opinions of the management of the Company only as of the date hereof. Additionally, please make sure to read these important disclosures.
David Chapman is not a registered advisory service and is not an exempt market dealer (EMD) nor a licensed financial advisor. He does not and cannot give individualised market advice. David Chapman has worked in the financial industry for over 40 years including large financial corporations, banks, and investment dealers. The information in this newsletter is intended only for informational and educational purposes. It should not be construed as an offer, a solicitation of an offer or sale of any security. Every effort is made to provide accurate and complete information.
However, we cannot guarantee that there will be no errors. We make no claims, promises or guarantees about the accuracy, completeness, or adequacy of the contents of this commentary and expressly disclaim liability for errors and omissions in the contents of this commentary. David Chapman will always use his best efforts to ensure the accuracy and timeliness of all information. The reader assumes all risk when trading in securities and David Chapman advises consulting a licensed professional financial advisor or portfolio manager such as Enriched Investing Incorporated before proceeding with any trade or idea presented in this newsletter.
David Chapman may own shares in companies mentioned in this newsletter. Before making an investment, prospective investors should review each security’s offering documents which summarize the objectives, fees, expenses and associated risks. Although Artificial Intelligence (AI) may be deployed from time to time, AI output is monitored and adjusted, if necessary, for accuracy. David Chapman shares his ideas and opinions for informational and educational purposes only and expects the reader to perform due diligence before considering a position in any security. That includes consulting with your own licensed professional financial advisor such as Enriched Investing Incorporated. Performance is not guaranteed, values change frequently, and past performance may not be repeated.












Quiet Markets Mask Rising Volatility and Uncertain Outlook
Markets were quiet despite wide ranges, as Fed held rates but dissent and hawkish odds unsettled investors. Yen surged after...


Dow Jones Holds Strong, Signaling Potential for New Highs
Since July 6, the Dow Jones has stayed above its BEV -5% line, signaling bullish momentum and likely new highs....


Morocco’s Budget Execution June 2026: Deficit Narrows to 20.2 MMDH
Morocco’s Finance Law execution at end-June 2026 shows a reduced budget deficit of 20.2 billion dirhams, down from 24.9 billion...

Tilray Brands Hits Multi-Year Lows as Cannabis Investors Await Regulatory Clarity
Tilray Brands shares have fallen 57% this year amid cannabis sector weakness and uncertainty over US regulatory reform. While potential...


Ethereum Between ETF Inflows, Price Risks and a Strong July
Ethereum faces mixed signals as ETF inflows and a strong July performance support recovery, while technical resistance and downside risks...
 |
|
 |  |
 |
|
-
 Impact Investing5 days ago
TotalEnergies Challenges Landmark Climate Ruling and Disputes Customer Liability for Emissions
-

 Biotech2 weeks ago
Biotech Revival: Big Pharma Bets on Innovation and Acquisitions
-
 Africa2 days ago
Morocco’s Budget Execution June 2026: Deficit Narrows to 20.2 MMDH
-
 Business1 week ago
Rising Bond Yields Signal Potential Trouble Beneath a Calm Stock Market