Markets
Market Faces Potential Shift as Secular Bull Ages and Gold, Oil Gain Attention
Markets alternate long secular bulls and bears; 1982–2000 bull then 2000–2009 bear. Current bull is 17 years old, raising concerns of an approaching bear. Opportunities still arise, such as senior healthcare. Historically gold and oil lead bears. China shifts reserves, oil surges amid conflict, lifting rates and gold while stocks wobble across global financial markets.

For anyone who thinks that the current bull market for stocks will continue forever, the following chart highlights the lost years. Since 1900 we have identified four periods where stocks, as measured by the Dow Jones Industrials (DJI), essentially went nowhere for a decade or more. They were usually preceded by bull markets that in some cases seemed to go on forever.
The lost decades
Take the current bull as an example. The current bull market had its beginnings out of the low of the 2008 financial crisis and Great Recession in March 2009. We are still awaiting a final top followed by a prolonged bear market. Yes, we’ve had some sharp corrections, even bear markets along the way, but none have persisted and the bull continued as we moved to new highs.
Interruptions came in 2011, 2015–2016 as the result of the EU/Greek debt crisis; the 2018 mini-bear sparked by rising interest rates, tariffs; the 2020 pandemic; and the outbreak of the Russia/Ukraine war with the subsequent inflation in 2022. However, we’ve had no prolonged slump such as we experienced from 2000–2009 because of the dot.com crash/recession and the 2008 financial crisis/Great Recession in 2007–2009. In all cases, it took years before the stock market regained its previous high. We summarize with the following chart of the DJI from 1900–2026 and a table on each of the prolonged bear markets.
Bulls and Bears
| Events | Official bear market | Period until stock market breaks even | Bull market prior to the bear market |
| World War I, Spanish influenza | 1916–1917 – 2 years, down 40%; 1919–1921 – 2 years, down 47% | 1916–1924 (8 years) | 1903-2016 (12 years but very uneven gradual rise) – up 48% |
| 1929 crash, Great Depression, World War II | 1929–1932 – 3 years, down 89%; 1937–1942 – 5 years, down 52%; 1946–1949 – 3 years, down 24% | 1929–1954 (25 years) | 1921–1929 (8 years) – up 496% |
| Inflation, Vietnam, Arab Oil Embargo, Watergate, Iranian Revolution | 1966–1970 – 3 years, down 37%; 1973–1974 – 2 years, down 47%; 1976–1982 – 6 years, down 29% | 1966–1983 (17 years) | 1949–1966 (17 years) – up 516% |
| Dot.com crash, 2008 financial crisis, Great Recession, wars on terror: Afghanistan/Iraq | 2000–2002 – 2 years, down 37%; 2007–2009 – 2 years, down 54% | 2000–2011 (11 years) | 2009–2026 (17 Years) – up 724% to date |
Note: during these in-between periods for bear markets, bulls failed to make new highs or made only marginal new highs
It is not as if the decades were completely lost. During the period of the Great Depression/World War II, gold mining stocks did well (gold was fixed at $35). Consumer staples also did well along with the entertainment industry as Hollywood pumped out cheap films. Homestake Mining soared 580% from 1929–1936. During the lost period of 1966–1983, gold and gold mining stocks did quite well as did oil and oil stocks.
Gold soared some 2,500% and oil, thanks to the Arab Oil Embargo and the Iranian Revolution, leaped over 1,000%. During 2000–2009, once again both oil and gold along with the stocks did well. Gold soared over 700% in 2001–2011 while oil leaped some 1,400% 1998–2008, thanks to globalization, and Asian/Chinese demand. Gold and oil are countercyclical and tend do well when the stock market is performing poorly and vice versa.
The current bull market is long in the tooth. Now 17 years and counting. AI has dominated. There remain high expectations that AI will continue to pay off. A significant portion of the gains of the past few years is thanks to the AI stocks. Not only is the stock market dependent on the rise of AI, but so is the economy.
One of the big problems is that the AI companies are now financing their expansion with debt – lots of it. In 2027 they are expected to spend some $1.2 trillion. That far exceeds the U.S. defense budget. And the U.S. itself is running annual deficits of 5.5–6% of GDP. Where will all the money come from? Borrowed, or printed money? Ultimately, that is inflationary and puts enormous pressure on the capital markets to raise all these funds.
The result is that bond prices are falling, while yields are rising. Some, such as Oracle, have already seen their bonds downgraded to just above junk. SpaceX, Elon Musk’s darling, has already cratered almost 50% from its high and is now 15% under its IPO price. Its bonds are essentially junk.
So far, the stock market has avoided any significant fall. We have no confirmation that we have made a top. But if AI comes crashing down, it will no doubt take the entire market with it. Maybe they can continue to justify the valuations, or maybe they can’t. If a crash happens, does the Fed have the wherewithal to combat it à la 2008? We suspect that will be difficult.
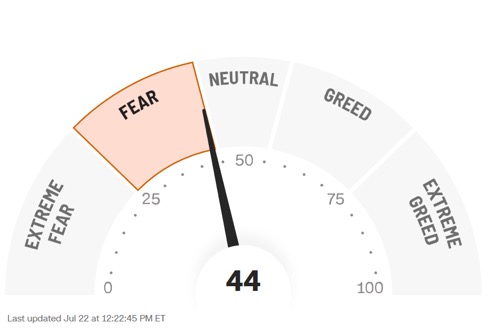
What is interesting is that CNN Fear & Greed Index is registering Fear. Given the indices remain not far from their top (S&P 500 is down roughly 2.5% from its recent high), there remains the possibility of further new highs. Could that happen?
CNN Fear and Greed Index
China buying gold
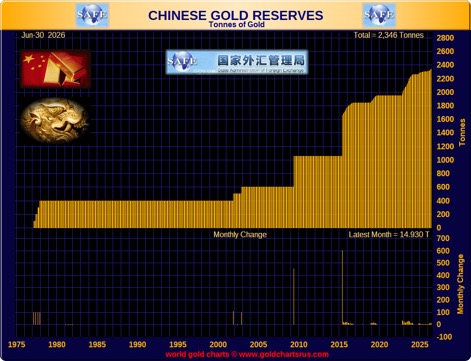
China has been consistently increasing its gold reserves, particularly since 2015. China has increased its reserves from 395 tonnes in 2000 to 2,346 tonnes today, an increase of over 500%. At the same time, China’s holdings of U.S. treasuries have been declining. China’s holdings of U.S. treasuries peaked in 2013 at $1,304.5 billion, at the time the largest holdings by any foreign entity. Today, China holds only $659.3 billion and has fallen to third place behind Japan and the United Kingdom. That’s a decline of $645.2 billion. China is generally replacing its U.S. treasury holdings with gold.
China has been adding to reserves for 20 consecutive months, including a 15-tonne purchase in June 2026. At 2,346 tonnes, the value of China’s gold holdings with gold at $4,100 is $309.2 billion. China’s gold holdings are not even the largest in the world. The U.S. holds that position with 8,133 tonnes. China currently sits sixth, just ahead of Russia.
China purchased some $2 billion worth of gold during 2025 when prices were rising. But in 2026, as prices are falling, China has purchased some $5.7 billion worth of gold. Was China helping to manipulate the market lower to purchase gold? That, of course, is debatable. The futures market, which prices gold, is estimated to be 100 times larger than the physical gold market. Whether China has been manipulating the market lower is moot, but they have been purchasing into weakness.
China holds the world’s largest reserves at over $3.4 trillion, of which $309.2 billion is gold. Japan is second at $1.26 trillion while the U.S. is well down at 13th place with $255 billion. For the U.S. that is the official holdings, but they hold their 8,138 metric tonnes of gold officially on their books at $42.22/ounce. If held at the current price of $4,100, their reserve holdings would soar to over $1 quadrillion with their gold holdings being the largest. Official reserves are generally made up of gold, special drawing rights, funds held with the International Monetary Fund (IMF), and foreign currencies, including U.S. dollars.
Chart of the week
Oil: 1946–2026 (Inflation-Adjusted)
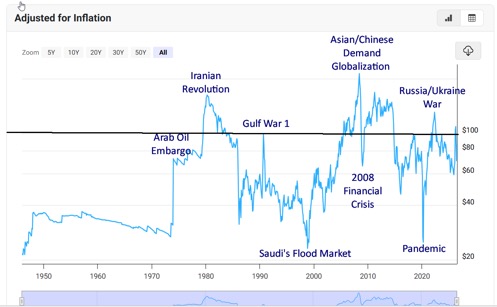
What better way to illustrate the real cost of oil and gasoline than to show inflation-adjusted charts. WTI oil is pushing up through $90 while Brent crude is now over $100. Is it as dire as it looks? Well, it could be poised to get worse. On an inflation-adjusted basis, WTI oil has only pushed above $100 a few times, notably during the Iranian Revolution of 1979–1980, the surge in demand due to globalization and Asian/Chinese demand in 2006–2014 with an interruption in 2008 because of the financial crisis, and more recently during the Russia/Ukraine war in 2022.
Once again, we are attempting to do that. This is all thanks to Iran/U.S. war and most recently the re-entry of the Houthis of Yemen into the war to block the Bab el-Mandeb Strait to prevent Saudi oil from getting to its destination markets in Asia. We note as well the potential effects of the Russia/Ukraine war where Russian oil facilities are being targeted, particularly refineries. Crude oil is not the final product. The oil has to be refined before it can become gasoline and other products. There is a global shortage of refining capacity.
For the consumer in the U.S. (and also in Canada and the EU), gasoline prices at the pump have shot up as well. But we note we are still a ways away from $5 (inflation-adjusted) where gasoline prices have soared before, notably during the Iranian Revolution of 1979–1980, the surge in demand due to globalization and Asian/Chinese demand (2006–2014) with again the interruption in 2008 due to the financial crisis, and the Russia/Ukraine war of 2022. Will we get through $5 again? It is a real possibility. For Canadians, it would suggest gas at the pump going through $2/litre.
The price of oil is driven by global events, especially war in major oil regions, particularly the Middle East and Russia. Could it happen in North America as well? North American oil and gasoline prices are driven by global events. With oil priced in U.S. dollars, North America cannot escape the price surge.
North America has better protection against natural gas prices because it is a large producer and, unlike the EU, has ample supplies of natural gas. In turn, the EU is heavily dependent on the Middle East and Russia. Both are currently being blocked one way or another: the Middle East through war and Russia through sanctions.
Gasoline: 1978–2026 (Inflation-Adjusted)
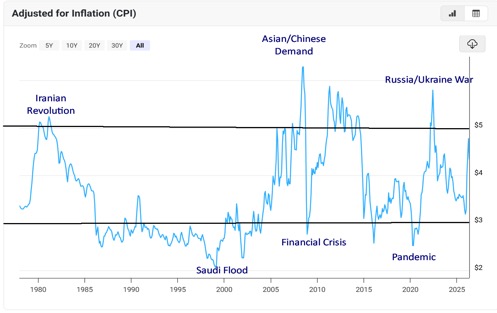
Going forward, oil continues to be the story as long as the war goes on.
Markets and Trends
| % Gains (Losses) Trends | ||||||||
| Close Dec 31/25 | Close Jul 24/26 | Week | YTD | Daily (Short Term) | Weekly (Intermediate) | Monthly (Long Term) | ||
| S&P 500 | 6,845.50 | 7,411.96 | (0.6)% | 8.3% | down | up | up | |
| Dow Jones Industrials | 48,063.29 | 51,946.51 | (0.4)% | 8.1% | neutral | up | up | |
| Dow Jones Transport | 17,357.19 | 22,476.16 | (1.1)% | 29.5% | up | up | up | |
| NASDAQ | 23,241.99 | 24,975.82 | (2.1)% | 7.5% | down | up | up | |
| S&P/TSX Composite | 31,712.76 | 35,369.10 (new highs) * | 0.3% | 11.5% | up | up | up | |
| S&P/TSX Venture (CDNX) | 987.74 | 868.82 | 1.6% | (12.1)% | down | down | up | |
| S&P 600 (small) | 1,467.76 | 1,761.46 | (0.8)% | 20.0% | up (weak) | up | up | |
| ACWX MSCI World x US | 67.18 | 74.08 | 0.1% | 10.8% | down | up | up | |
| Bitcoin | 87,576.98 | 64,213.68 | 0.4% | (26.7)% | neutral | down | neutral | |
| Gold Mining Stock Indices | ||||||||
| Gold Bugs Index (HUI) | 701.49 | 625.87 | 5.7% | (10.8)% | down | down | up | |
| TSX Gold Index (TGD) | 817.76 | 749.09 | 6.3% | (8.4)% | down | down | up | |
| Bonds% | ||||||||
| U.S. 10-Year Treasury Bond yield | 4.17% | 4.69% | 3.1% | 12.5% | ||||
| 3.3Cdn. 10-Year Bond CGB yield | 3.44% | 3.61% | 1.4% | 4.9% | ||||
| Recession Watch Spreads | ||||||||
| U.S. 2-year 10-year Treasury spread | 0.69% | 0.35% | (5.4)% | (49.3)% | ||||
| Cdn 2-year 10-year CGB spread | 0.85% | 0.70% | 1.5% | (17.7)% | ||||
| Currencies | ||||||||
| US$ Index | 98.26 | 101.47 | 0.8% | 3.3% | up | up | down (weak) | |
| Canadian $ | 72.87 | 70.90 | (0.6)% | (2.7)% | neutral | down | down | |
| Euro | 117.48 | 113.70 | (0.6)% | (3.2)% | down | down | up | |
| Swiss Franc | 126.21 | 122.20 | (1.4)% | (3.2)% | down | down | up | |
| British Pound | 134.78 | 133.21 | (1.0)% | (1.2)% | down (weak) | neutral | up | |
| Japanese Yen | 63.83 | 61.03 | (0.9)% | (4.4)% | down | down | down | |
| Precious Metals | ||||||||
| Gold | 4,311.97 | 4,053.79 | 0.9% | (6.0)% | down | down | up | |
| Silver | 71.16 | 58.18 | 4.1% | (18.2)% | down | down | up | |
| Platinum | 2,046.90 | 1,599.60 | (0.2)% | (21.9)% | down | down | up | |
| Base Metals | ||||||||
| Palladium | 1,619.50 | 1,243.50 | (0.5)% | (23.2)% | down | down | neutral | |
| Copper | 5.64 | 6.30 | 1.2% | 11.6% | neutral | up | up | |
| Energy | ||||||||
| WTI Oil | 57.44 | 90.05 | 9.1% | 56.8% | up | up | up | |
| Nat Gas | 3.71 | 2.88 | (1.4)% | (22.4)% | down | down | neutral | |
Stocks
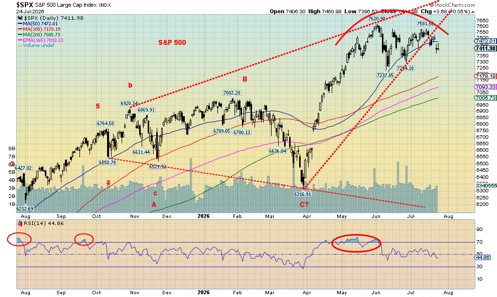
Is the stock market rolling over? That might be the suggestion, given the break this past week of what appears as an ascending wedge triangle. Trend line support broke to the downside. A return to the upside and break above 7,600 would keep the bull alive and kill the bearish triangle. If, however, it is correct, then what might beckon is that trendline that joins a low in October 2025 with the low in March 2026. That currently is way down at 6,200. With an RSI at 44.85, we are not yet oversold (RSI under 30).
Nonetheless, breaks were all around this past this week as further hostilities broke out between the U.S. and Iran and oil prices leaped higher. We also can’t but help note the lower high by the S&P 500 at 7,581 vs. the high of 7,621. That is not, however, confirmed until we break under 7,230. If that breaks, then we could soon see ourselves down, testing the 200-day MA near 7,000.
This past week the S&P 500 fell 0.6%, the Dow Jones Industrials (DJI) was off 0.4%, the Dow Jones Transportations (DJT) dropped 1.1%, and the tech-heavy NASDAQ fell 2.1%. Interestingly enough, the Mid and Small cap continue to hang in as the S&P 400 (Mid) was actually up 0.2% but the S&P 600 (Small) dropped 0.8%. The S&P 500 Equal Weight Index was up a mere 0.1%, but the tech-heavy NY FANG Index fell 2.0%.
In Canada, the TSX Composite made new all-time highs, thanks to a decent week from the materials sector (Golds, Metals, and Materials), gaining 0.3%. The TSX Venture Exchange (CDNX) showed life, up 1.6%. Also making new highs was the large cap TSX 60, even though it closed down 0.2%. Sub-indices making new all-time highs were Income Trusts (TCM) and Utilities (TUT). Six of the 14 sub-indices on the TSX were up on the week led by Materials (TMT), up 6.6%. Of the losers (eight), the biggest one was Information Technology (TTK), down 3.8%.
In the EU, the London FTSE gained 1.3%, the EuroNext was up 0.8%, the Paris CAC 40 was up 0.4%, and the German DAX gained 1.1%. In Asia, China’s Shanghai Index (SSEC) was up 1.3%, the Tokyo Nikkei Dow (TKN) gained 0.7%, Hong Kong’s Hang Seng (HSI) was up 1.6%, but India’s Nifty Fifty was our only loser that we follow, down 2.3%. Interestingly, North America was generally weak while foreign (EU and Asia) was generally up. Oh yes, Canada too.
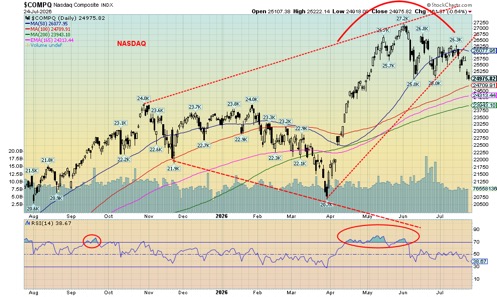
The FAANGs/MAG7 were generally whacked this past week, led by Tesla, which fell 17.9%. Musk’s SpaceX also fell 7.2%. How quickly they fall. Musk’s reign as a trillionaire was short-lived. He’s now merely a $700 billionaire. Down 30% from the high. SpaceX is now $20 under its IPO price of $135 and down 50% from its high. Tesla is down 30% so far in 2026. At this rate, Musk will soon be seeking welfare. Okay, just kidding.
Other significant drops we saw were Trump Media (DJT), down 11.4%, Google, down 7.8%, and CrowdStrike, off 9.8%. Were there winners? Yes, Advanced Micro (AMD) rose 5% while Micron (MU) was up 8%.
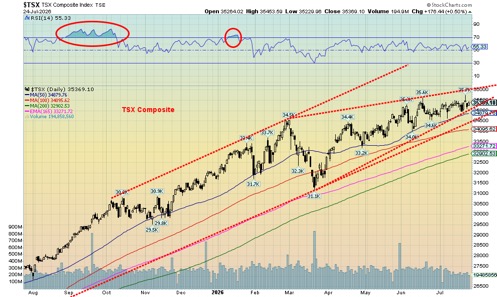
All in all, not a friendly week unless you were in the EU or Asia. The S&P 500 needs to fall below 7,200 to suggest a top is in. Below 7,000 it’s over. The NASDAQ is in more danger as it is already breaking down under its points, closing at 24,976. That’s below 25,000 support. The TSX is still hanging in but a break under 34,900 could spell trouble. Under 34,000 trouble is underway.
That triangular pattern suggests a drop to 31,000 if 34,600 breaks. In all cases, new highs would end discussion for the moment at least of a drop. We’ve noted that the Fear and Greed Index is registering Fear and we’re not even breaking down yet.
Nonetheless, we know this market is long in the tooth and the August/September period and even into October are not noted as being positive months. Will the seasonals prove correct?
Bonds
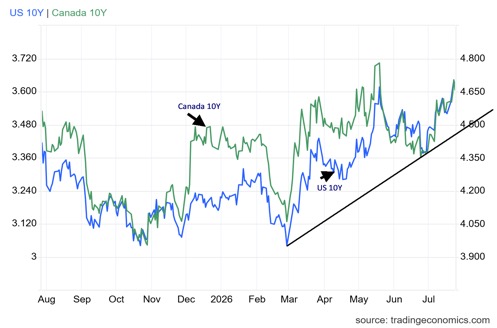
U.S. 10-year Treasury note yields dipped Friday, after news of Pakistan, backed by China, pushing for the U.S. and Iran to renew peace talks. It, however, did little for the week as rising oil prices pushed the U.S. 10-year up to 4.69% from 4.55% the previous week. The 2-year rose to 4.35%, up from 4.18%, while the 30-year rose to 5.16% from 5.07%. The 30-year is persisting over 5%, the highest since the late 1990s–early 2000s.
All these have a negative impact on mortgage rates, which are pushing towards 7% for the 30-year. The last time mortgage rates were 7% was in August 2025. Canada wasn’t immune as the 10-year Government of Canada bond (CGB) rose to 3.61% from 3.56%. The U.S. 10-year is now at its highest level for 2026 while the Canada 10-year remains short of its high of 3.73%.
This week the Fed meets on July 28–29 for its interest rate decision. The wide expectation is that the FOMC will hold rates steady at 3.75%. Arguments for lower rates are probably not on, given the rise in oil prices and that, from an inflation standpoint, the rise in oil prices has not yet worked its way through.
The latest inflation numbers from June 2026 showed inflation cooled. However, that was a result of lower oil prices. Listen to Fed Governor Warsh’s comments after the meeting for clues going forward. However, as before, he’s not expected to give forward guidance. Expectations are rising that the Fed might have to hike rates in September.
Rising interest rates could have a negative impact on the consumer economy as noted with rising mortgage rates. Already that is putting a damper on house building and buying.
Gold and silver
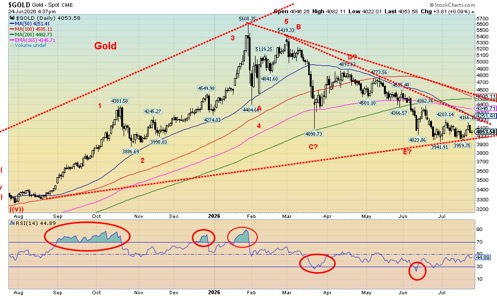
Gold continues to drag along its recent lows. We suppose that’s good news as we’ve not made any new lows. The low was seen almost three weeks ago at $3,941. Since then, we have held the $4,000 level; however, we’ve made little or no progress higher. The recent high was $4,203. Resistance is now seen at $4,250 and especially at $4,500. We won’t start to feel comfortable that we’ve made a potential low until we are through $4,600 and preferably even $4,700. The good news is we’ve entered a more positive seasonal period for gold and we could be making lows. Naturally, we want to see $4,000 hold. If it doesn’t, we could soon find ourselves at $3,800 and even $3,400. But that should be it.
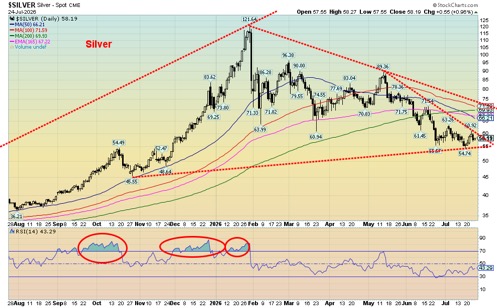
Gold did rise this week, up 0.9%. We were encouraged by silver making a 4.1% gain and the gold stocks also up with the Gold Bugs Index (HUI) up 5.7% and the TSX Gold Index (TGD) gaining 6.3%. If we are to rise, we want to see silver and the gold stocks leading. We got that this past week. Encouraging. Platinum didn’t cooperate and fell 0.2%, while palladium also fell, down 0.5%. Copper, however, gained 1.2%. As we’ve noted, copper’s rise is ultimately encouraging for gold, which usually correlates well with copper.
As noted, silver’s rise and lead was encouraging. Silver needs to break through $60 and then through $72 before we can even contemplate that a low is in. Silver recently reached a low at $54.74 at a time when gold did not see new lows for the move. A divergence? We also see a five-wave decline for silver, potentially an ABCDE pattern that, if correct, should soon see a rise underway. Following a rebound, typically we set back again.
Silver’s decline to near $54 is a classic move to test the previous breakout over $50. That said, we have considerable work to do to regain confidence and break out to the upside once again. Until then, downside risk remains. In a worst-case scenario, if we were to break under $50, we’d consider that the bull is over for the time being. We don’t believe that will happen but, given how close we remain to $50, it is a concern.
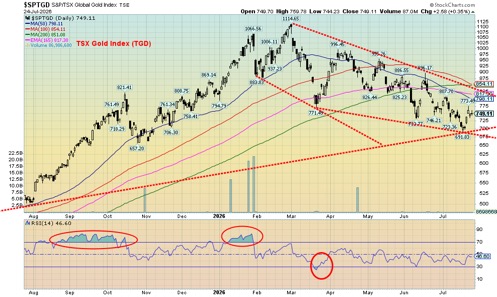
The gold stocks continue to exhibit similar patterns. Interestingly, this recent pullback has seen the TGD fall only 38% vs. 55% for silver and 30% for gold. When gold and silver fall, the gold stocks tend to underperform and a fall in this case by 70% wouldn’t be seen as unusual for the TGD. It hasn’t happened, so that is encouraging. The gold stocks appear to be under accumulation. But, like gold and silver, we need to break to new highs to suggest the decline is over.
The TGD breaks out over 860. For the HUI, the point is 705, preferably over 740. Naturally, recent lows must hold. For the TGD 692 and the HUI 580.67. If that happened, we’d have to reconsider the entire bull market for the precious metals. We’d tolerate a small penetration, but the real danger point for everyone is gold under $3,800, silver under $50, the TGD under 650, and the HUI under 550. Let’s hope the seasonals work.
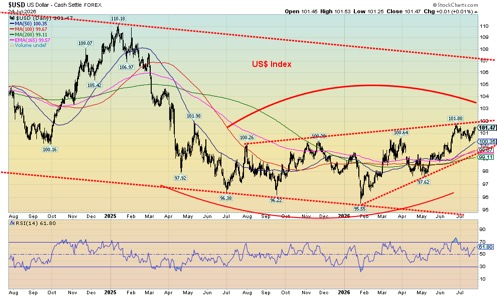
Here is the struggling US$ Index. Given rising U.S. interest rates, the US$ Index should be rising more than it is. Instead, it struggles below a recent high at 101.80. Yes, the US$ Index rose 0.8% this past week, but it’s struggling. We also don’t like what appears to be a forming ascending wedge triangle, which is ultimately bearish. We’d have to break under 99 to suggest lower prices, potentially down to 97. We’re rising, but it’s laboured. With the US$ Index up this past week, all the other currencies struggled with the Swiss franc the hardest hit, down 1.4%. The Cdn$ fell 0.6%.
Oil and gas
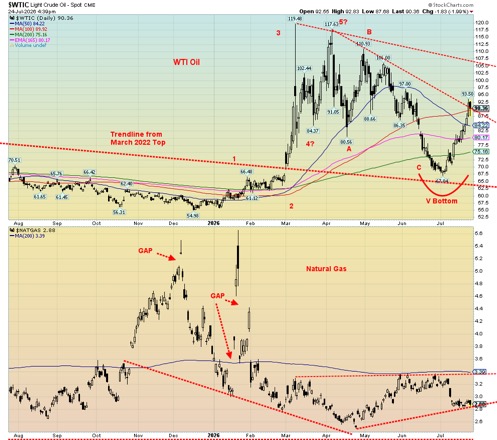
WTI oil prices climbed 9.1% this past week as the Houthis upped the ante in the Middle East war by putting a blockade on the Bab el-Mandeb Strait that goes from the Red Sea to the Gulf of Aden. Oil that comes across a pipeline from Saudi Arabia to the Red Sea is destined for Asia. Brent crude leaped 11.0% as both WTI and Brent gained roughly $10 on the week.
Yes, Saudi oil to the Red Sea can be rerouted through the Suez Canal, but it’s a long, arduous road with sharply increased costs if it is ultimately destined for Asia. Oil to the EU would continue to benefit from any that comes through the Suez.
Natural gas (NG) was also impacted this past week, particularly at the EU Dutch Hub that saw prices leap about $5 or 6.6%. The Henry Hub in North America remains down off 1.4% this past week. Energy stocks enjoyed the party as the ARCA Oil & Index (XOI) leaped to new all-time highs, up 2.3%, while the TSX Energy Index (TEN) gained 5.2% but remains short of new all-time highs. The heavily-weighted energy sector as a component of the CRB Index saw that index gain 6.5% while the Gold/WTI oil ratio fell 7.5% in favour of oil.
Traffic once again through the Strait of Hormuz slowed to a crawl. A concern is that oil will not reach refiners, putting further upward pressure on the oil price. Ukraine continues to target Russian refineries and that too could be another spark that could push oil prices higher. Some Chinese ships carrying oil did go through the Bab el-Mandeb Strait.
WTI oil broke over resistance at $90 but didn’t hold as word came that both Pakistan and China are pushing the combatants back to the negotiating table and peace talks. Will it happen? It could, but from what we see it is unlikely. $90 is proving to be resistance. A firm push through $90 could target oil prices up to somewhere between $140 to $160. That’s a possibility, not a given.
As long as this war continues, oil and its products, particularly gasoline at the pump, will continue to rise. Consumers are already seeing a rise at the pumps as in the U.S. it motors towards $4.50/gallon and in Canada it leaps over $1.80/litre (even $2/litre in some places).
__
(Featured image by Anne Nygard via Unsplash)
DISCLAIMER: This article was written by a third party contributor and does not reflect the opinion of Born2Invest, its management, staff or its associates. Please review our disclaimer for more information.
This article may include forward-looking statements. These forward-looking statements generally are identified by the words “believe,” “project,” “estimate,” “become,” “plan,” “will,” and similar expressions, including with regards to potential earnings in the Empire Flippers affiliate program. These forward-looking statements involve known and unknown risks as well as uncertainties, including those discussed in the following cautionary statements and elsewhere in this article and on this site. Although the Company may believe that its expectations are based on reasonable assumptions, the actual results that the Company may achieve may differ materially from any forward-looking statements, which reflect the opinions of the management of the Company only as of the date hereof. Additionally, please make sure to read these important disclosures.
Copyright David Chapman 2026
David Chapman is not a registered advisory service and is not an exempt market dealer (EMD) nor a licensed financial advisor. He does not and cannot give individualised market advice. David Chapman has worked in the financial industry for over 40 years including large financial corporations, banks, and investment dealers. The information in this newsletter is intended only for informational and educational purposes. It should not be construed as an offer, a solicitation of an offer or sale of any security. Every effort is made to provide accurate and complete information.
However, we cannot guarantee that there will be no errors. We make no claims, promises or guarantees about the accuracy, completeness, or adequacy of the contents of this commentary and expressly disclaim liability for errors and omissions in the contents of this commentary. David Chapman will always use his best efforts to ensure the accuracy and timeliness of all information. The reader assumes all risk when trading in securities and David Chapman advises consulting a licensed professional financial advisor or portfolio manager such as Enriched Investing Incorporated before proceeding with any trade or idea presented in this newsletter.
David Chapman may own shares in companies mentioned in this newsletter. Before making an investment, prospective investors should review each security’s offering documents which summarize the objectives, fees, expenses and associated risks. Although Artificial Intelligence (AI) may be deployed from time to time, AI output is monitored and adjusted, if necessary, for accuracy. David Chapman shares his ideas and opinions for informational and educational purposes only and expects the reader to perform due diligence before considering a position in any security. That includes consulting with your own licensed professional financial advisor such as Enriched Investing Incorporated. Performance is not guaranteed, values change frequently, and past performance may not be repeated.








Market Faces Potential Shift as Secular Bull Ages and Gold, Oil Gain Attention
Markets alternate long secular bulls and bears; 1982–2000 bull then 2000–2009 bear. Current bull is 17 years old, raising concerns...

Rising Bond Yields Signal Potential Trouble Beneath a Calm Stock Market
This week’s market was calm, but underlying conditions may be weakening. The Dow Jones has stalled without new highs, while...


Blockchain Evolves Toward AI, Finance and Quantum Security
Blockchain is evolving beyond crypto into finance, AI applications, and digital markets, while security and regulation remain challenges. Quantum threats...

The Italian Crowdinvesting Market Faces Sharp Decline in 2026
Italian crowdinvesting market continued to decline in 2026, with fundraising falling 36.8% year-on-year to €164.19 million. Platforms and active campaigns...


Sartorius Stedim Biotech Maintains Growth Momentum in H1 2026
Sartorius Stedim Biotech reported solid H1 2026 results, with revenue reaching €1.527 billion and EBITDA rising to €479 million. Growth...
 |
|
 |  |
 |
|
-

 Crowdfunding2 weeks ago
Insight Foto Festival Launches €4,500 Crowdfunding Campaign to Support 2026 Edition
-

 Business1 week ago
Dow Jones’ Record Run Faces Early Signs of Potential Shift
-

 Business2 weeks ago
Jobs Cooling Fast as a Cautious Fed Leaves Markets Without a Safety Net
-

 Fintech4 days ago
AI Agents Transform Payments as Visa, Mastercard, and Qonto Tackle Trust, Liability, and Regulation