Business
SpaceX IPO Sparks Déjà Vu as Market Risks Loom and Gold Bulls Stay Hopeful
The author compares the 2000 AOL Time Warner merger to SpaceX’s planned IPO, warning it may signal a market top. They argue SpaceX is overvalued, driven mainly by Starlink, and predict investors could face losses. Despite short term optimism, they remain cautious while bullish on gold, silver, and mining stocks after a recent correction ends

Today’s IPO for SpaceX, reminds me of when AOL, a little e-mail company, swallowed massive Time Warner, head first and whole back in January 2000. AOL was a tiny internet company, with maybe six million subscribers. Still, they bought a massive media company; Time Warner, at the very top of the 1990s high-tech boom. A quarter century ago, Wall Street loved it. They provided the funding for that ill-considered IPO! Following that mismatched merger, it was all downhill for the stock market, for the next two and a half years.
A quarter of a century later, we today see SpaceX going public. I have this feeling; we’ve been here before.
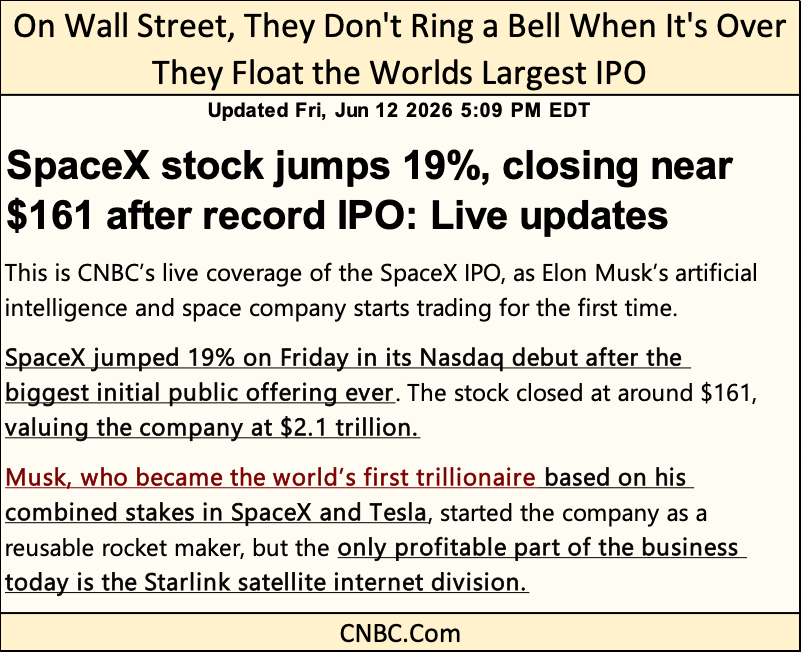
https://www.cnbc.com/2026/06/12/spacex-ipo-spcx-live-updates.html
If you want to own shares of SpaceX, wait a few years, when they are going for maybe 10% of what they’re selling for today. Elon Musk is a smart guy. Why would he be selling his company to the public if it wasn’t a top? Maybe because the only profitable division in SpaceX, is its Starlink internet ISP.
Are Starlink’s profits sufficient to justify SpaceX’s multi-trillion-dollar market cap? The rest of his company, amazing as it is, most likely are only holes in SpaceX’s balance sheet, that drains cash from this multi-trillion-dollar market cap company. Good Grief!
So, in June 2026, Musk is taking the public’s money. Come this October, will the public be taking SpaceX’s pending capital losses? I could be wrong, but I don’t think I am. Historically speaking, that is how these highly promoted, stupendous deals sponsored by Wall Street usually work out; heads they win, tails the public loses.
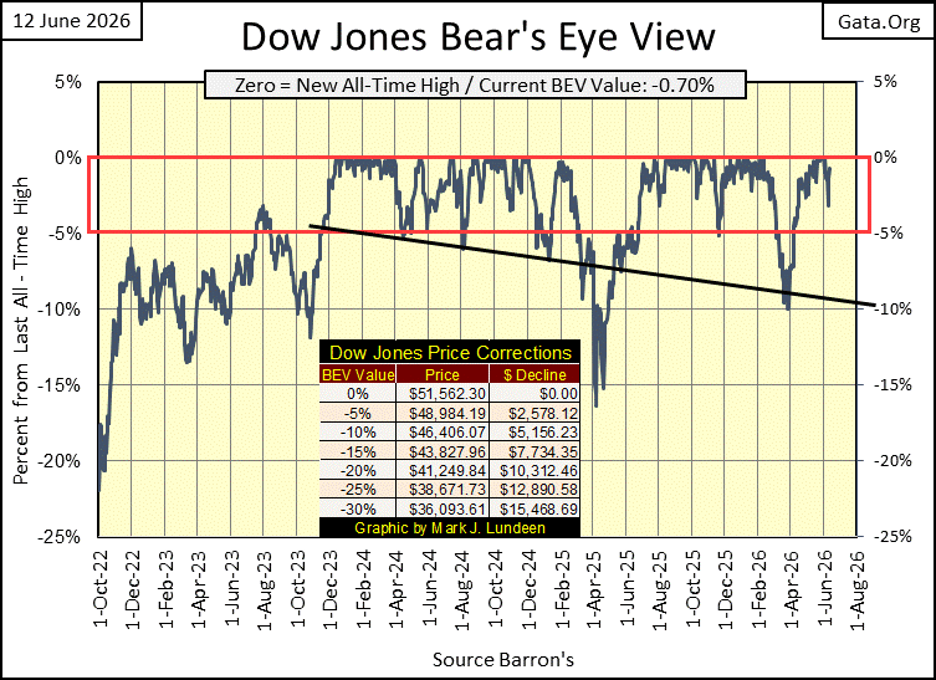
Whatever I think of the SpaceX IPO, the stock market liked it. The Dow Jones was down 3% on Wednesday from its last all-time high, almost saw a BEV Zero in its BEV chart below on Friday’s close. The Dow Jones may see a few more BEV Zeros in the weeks ahead. But that SpaceX IPO doesn’t sit right with me. It gives me the heebie-jeebies. Dow Jones at 55K by Christmas 2026? Maybe, and then maybe not.
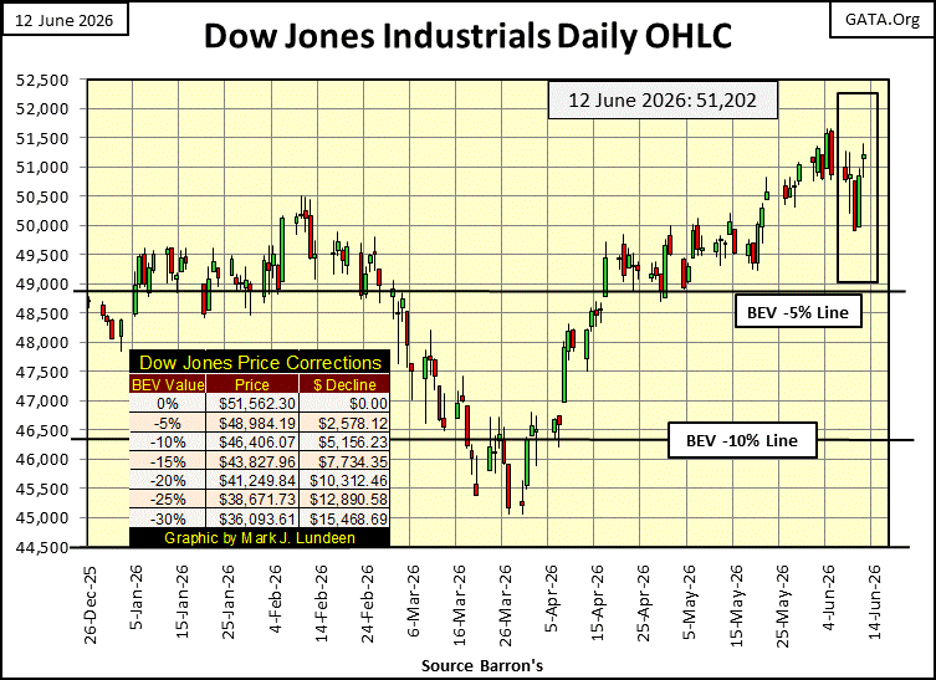
In the chart of the Dow Jones in daily bars below, it looks like it put in a short-term bottom on Wednesday, and a nice recovery by the end of the week.
The XAU closed the week at #20 in the table below. Six months ago, it was closing at #1 on a regular basis. Let’s take a look at the XAU’s BEV chart below. On Wednesday, it almost broke below its BEV -35% line, but closed the week above its BEV -30% line. Is last Wednesday’s low, the low for this correction? Maybe, but only time will tell.
The XAU has been correcting since its last all-time high of February 27th. So, below in its BEV chart, we are looking at a four-month, 35% correction in the XAU. If the market was a democracy, I’d vote the bottom was in. But we still don’t know what Mr Bear thinks of that.
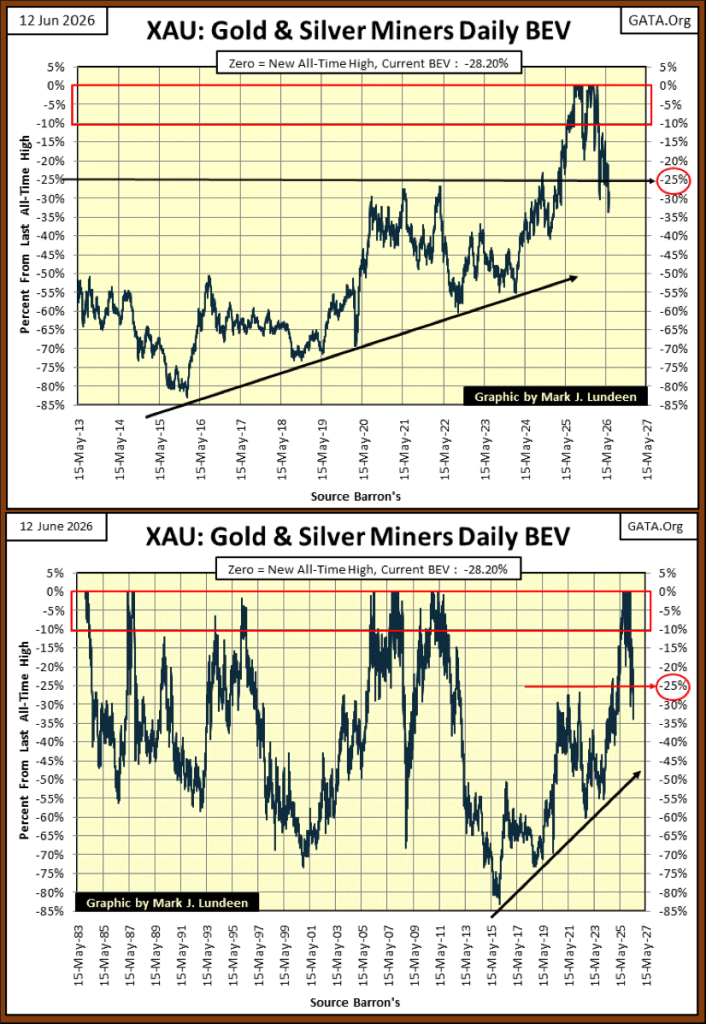
Looking at the XAU in the longer-term BEV chart above, corrections from past all-time highs have been much worse than just a 35% decline in valuation, and can go on for years and decades. But that was then, and this is now. I’m expecting the XAU to climb in the ranking seen in the table below, in the months to come.
Why would that be? Because I’m a bull on gold and silver bullion, and the companies that mine them. I also know that all bull-market advances see correction in their advances. So, I’m thinking the XAU’s current four-month, 35% decline is only a correction in this bull-market advance. A normal correction experienced investors anticipate as normal events in the market.
Maybe there is more correcting to be done, in terms of time and valuation. But for the XAU, as well as for gold and silver, I think the worse is over, and their bull-market advances will resume again, in the months to come.
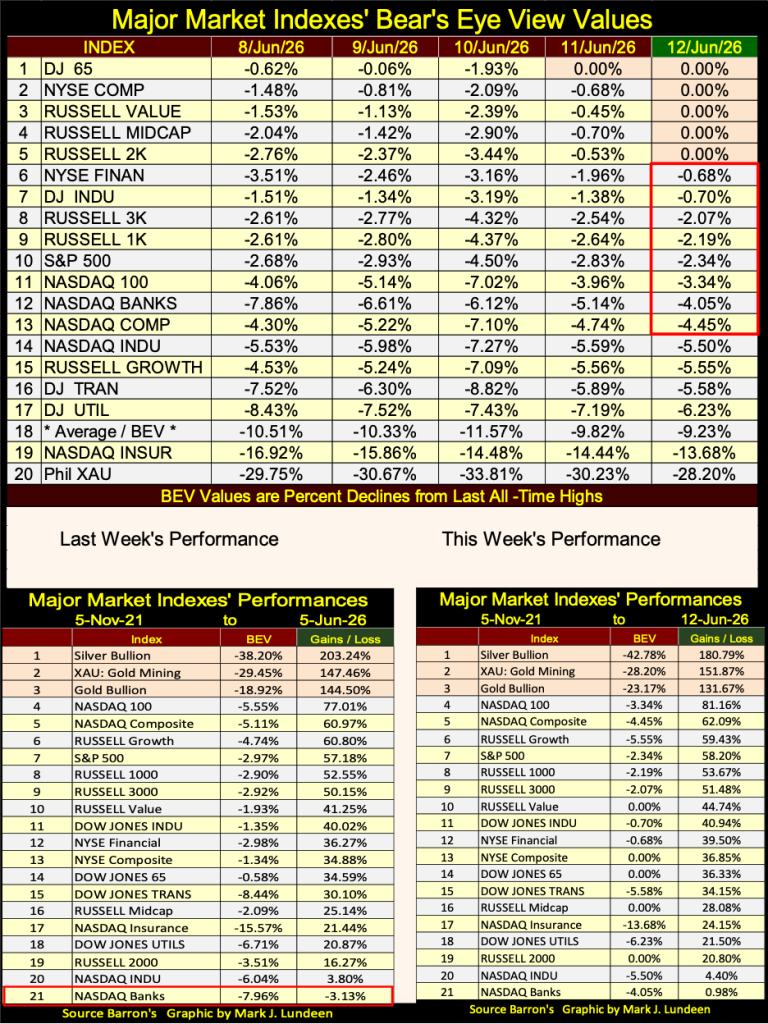
Looking at this week’s performance table above, precious metal assets remain in the top three spots, and still far ahead of anything else, even after their current double-digit percentage corrections.
CNBC is a main-stream, financial media outlet. A media network who knows exactly who butters their bread; those who purchase advertising time on their network, mostly, but not limited to;
• Wall Street,
• Big Pharma.
Look at them for a few hours, and you’ll see what I’m talking about. Nothing wrong about that. I’m making no charges of moral turpitude against any “main-stream financial media outlet.” Still, I should note, if CNBC began commenting on the market, Wall Street, and the FOMC as I do, like me, they would soon be a not-for-profit operation.
Taking that into consideration, I read the bearish CNBC article on gold below with a little skepticism. Did CNBC write any bullish articles on gold and silver bullion, or the precious-metal miners any time from August 2023 to January 2026, thirty months were gold advanced by 122%, silver by 324% and the XAU by 321%?
Maybe they did, but I don’t recall any. Truth be told, I wasn’t really looking. However, with my usual casual scanning of the news feed from CNBC on the precious metals market, it seems unless CNBC have something bad to say about gold and silver, they have nothing to say at all.
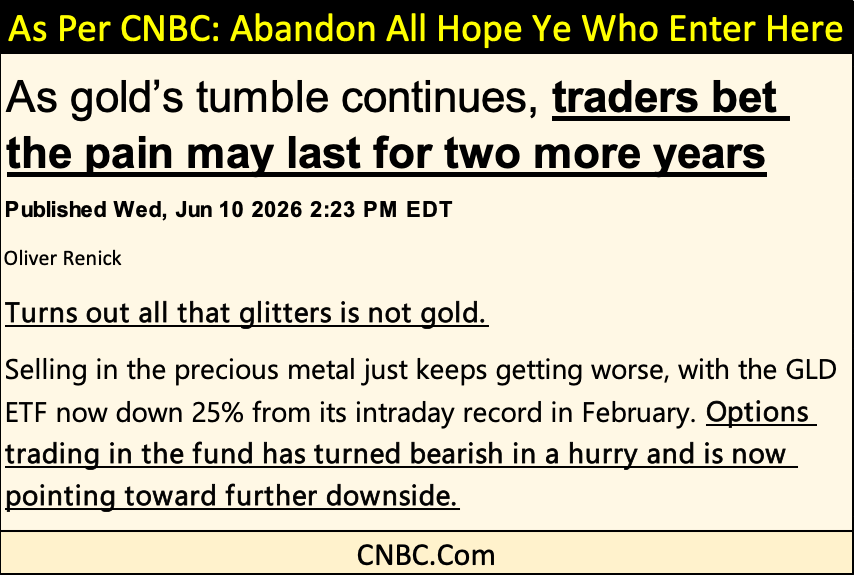
As gold’s tumble continues, traders bet the pain may last for two more years
Below is a video of Wednesday’s (June 10th) morning takedown on the floor at the COMEX’s gold pit. See if you can identify gold cartel’s goons (the shorts driving gold prices lower) from the longs who want the price of gold to go higher. The government’s regulator, responsible for “regulating” trading at the COMEX, is wearing a stripped shirt in this video.

The above graphic was from CNBC. King World News (KWN) below has a different opinion of the future for gold.
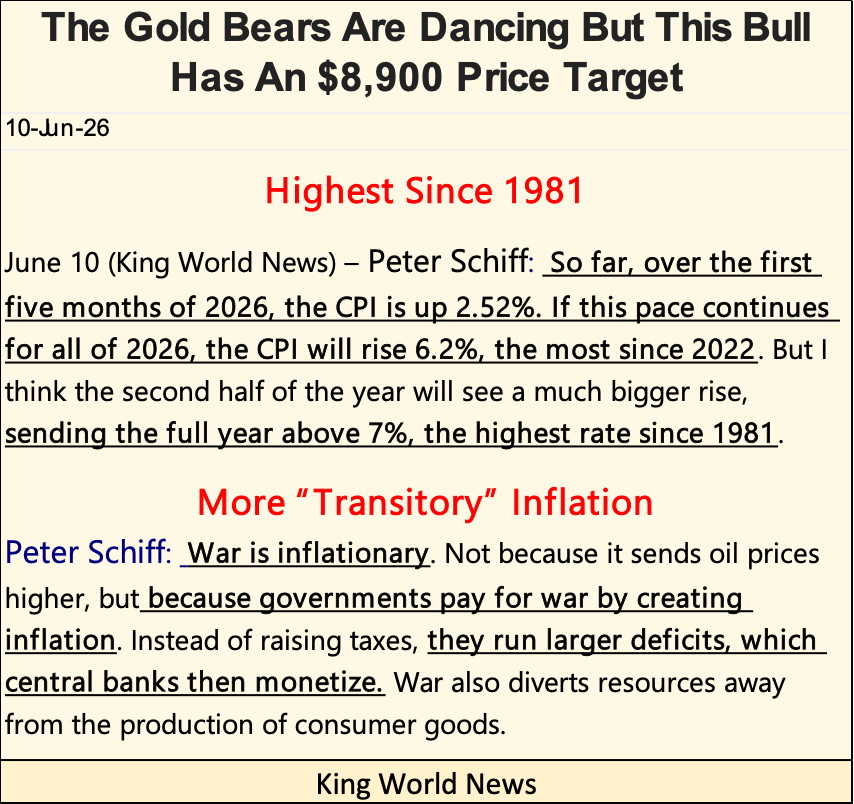
The Gold Bears Are Dancing But This Bull Has An $8,900 Price Target | King World News
Note the structural difference between these two articles on gold;
• CNBC focused primarily on technical work for options trading in the gold ETF market, market commentary by unnamed “market experts,” or “traders” in this article,
• KWN named Peter Schiff (and others) as their source, who justified their expectations for future higher gold prices, with specific reasons.
That doesn’t mean one is right, while the other is wrong. But if one is going to accept the risks any market offers investors, anticipating profits, one should be discerning of what is offered as information concerning that market. King World News has much more to offer precious metal investors.
Everyone is thinking of rising oil prices, or geo-political concerns as reasons to justify their beliefs that gold, silver and the mining shares are going to go up, or down. But why does the price of anything go up or down? In terms of supply and demand;
• falling supply or rising demand = higher prices,
• rising supply or declining demand = lower prices.
Keeping that in mind, let’s look at the COMEX gold inventories in the chart below. Far below, sorry. Understand, the COMEX isn’t the only supply of stored gold bullion in the world.
In the 1990s, central banks were leasing, flooding the gold market with their reserves of monetary gold, independent of what the price of gold was actually trading for. Meaning, the more the price of gold went down in the 1990s, the more these central banks leased their monetary gold to bullion banks, who then sent this gold into the market via what was called “gold loans.” Loans made in gold, and payable in gold.
Major mining companies liked these very low-interest rate loans of physical gold, as future production could pay them back easily. But the bullion banks also made gold loans to hedge funds too, and anyone else with the right connections. Small wonder a bear market in gold that began in January 1980, didn’t bottom until February 2001.
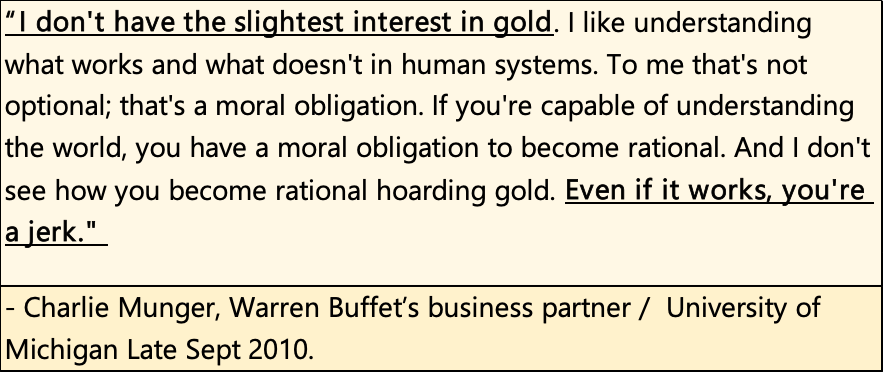
Global central banks leasing their gold, provided them with maybe a 1% annual rate of return on this “dead asset.” Why? Charlie Munger below states the establishment’s view in gold.
But I prefer to listen to Howard Buffett below, the father of Warren Buffett, on the virtues of gold.

I’d like to know how much of this leased gold from the 1990s, has been returned to these same central banks? As when an owner of something leases it to someone else, at some point they do expect its return to close the leasing contract.
I suspect not much, if any of this leased gold from decades ago has been returned to these central banks. Thousands of tons of gold bullion may be missing, and its owners apparently don’t care? What about the gold at Fort Knox? A proper audit of the US Treasury’s gold hasn’t been conducted since the 1950s. What a scandal this could be, should CNBC care to cover this story, which they don’t.
This is probably the reason central banks recently have been huge buyers of gold, to rebuild their reserves of gold bullion they essentially gave a way for free in the 1990s.
Another potential source of gold for the market, could be women in India, who own huge amounts of 24K gold jewelry. As a group, they may own hundreds, maybe thousands of tons of gold. I doubt this gold will ever be available to the global gold market. So, are today’s central banks, and Indian housewives sources for the global gold market? I don’t think so.
I’m not an expert on this subject, but the only large source of gold bullion available to the market I’m aware of, is the gold inventories at the COMEX. Using that data, and keeping it simple, let’s look at the supply of gold available to the gold market.
But first some history on what we are looking at below. Before 31 December 1974, there was no gold trading at the COMEX futures market, or COMEX holding inventories of gold. COMEX gold trading began three years following the US Treasury’s abandoning of the Bretton Wood $35 gold peg in August 1971.
By December 1974, gold had risen from $35 on ounce, to $183.90. A very embarrassing, three year, 425% increase in the price of gold. That was not supposed to have happened. I believe the creation of the COMEX gold futures market, was instituted as a means to check advances in the price of gold, following the US Treasury’s 1971 abandonment of the dollar’s $35 gold peg.
Before the COMEX began trading gold futures contracts in December 1974, if the “policy makers” wanted to depress the price of gold, they had to sell actual gold bullion. The problem with that was, there was only so much gold they could sell, before they ran out of gold.
But why would these so called “policy makers” want to depress, manipulate the price of gold down, far below what a free market would have it at? Because they know trends in the price of gold, is the market’s mechanism for grading their “monetary policy.” And a rising price of gold, is the market giving their “monetary policy” of unlimited monetary inflation, a failing grade.
So too is seeing Elon Musk becoming the world’s first trillionaire this week. Good for Elon, but “monetarily” speaking, there is something so wrong with anyone becoming a trillionaire!
This week I paid for my car insurance, and saw what my insurer wanted for my home insurance this year. As with Musk’s personal net-worth, the price of everything is only going higher, because of the “liquidity” flowing from the FOMC. In our world today, how can anyone be a bear on gold and silver, and companies that mine the old monetary metals?
After the COMEX began trading gold futures contracts in December 1974, when the “policy makers” wanted to depress the price of gold, they could flood the gold market with futures contracts that * PROMISED TO DELIVER GOLD * sometime in the future. Promises of delivery that were never kept, as these contracts were canceled before the delivery date. As the price of gold declined during the 1980 – 2001 bear market, great profits for the short side of these contracts were made.
As the market no longer demanded actual delivery of physical gold, but was satisfied with these insincere promises for future delivery of gold, this system of suppressing gold prices worked wonderfully. Or so until the day came in 1999 when it no longer did. Rising gold prices resulted in a potentially global banking catastrophe.
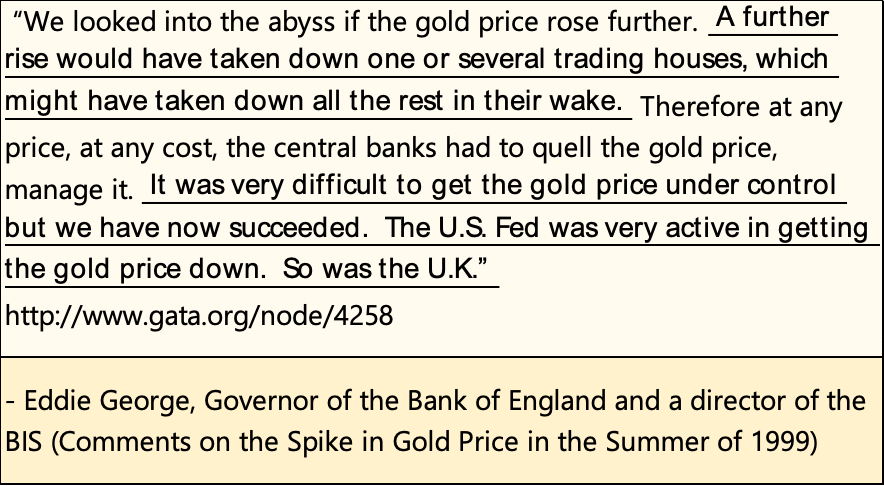
Reading the above quote from three decades ago, is obvious those “trading houses” (banks) were massively short future contracts in gold. Promising to deliver gold they didn’t have, sometime in the future. Rising gold prices meant they could close these gold contracts only at great loss, possibly bankrupting major banks in London and New York. What did the Federal Reserve do? As Eddie George said above; “They were very active in getting the gold price down.”
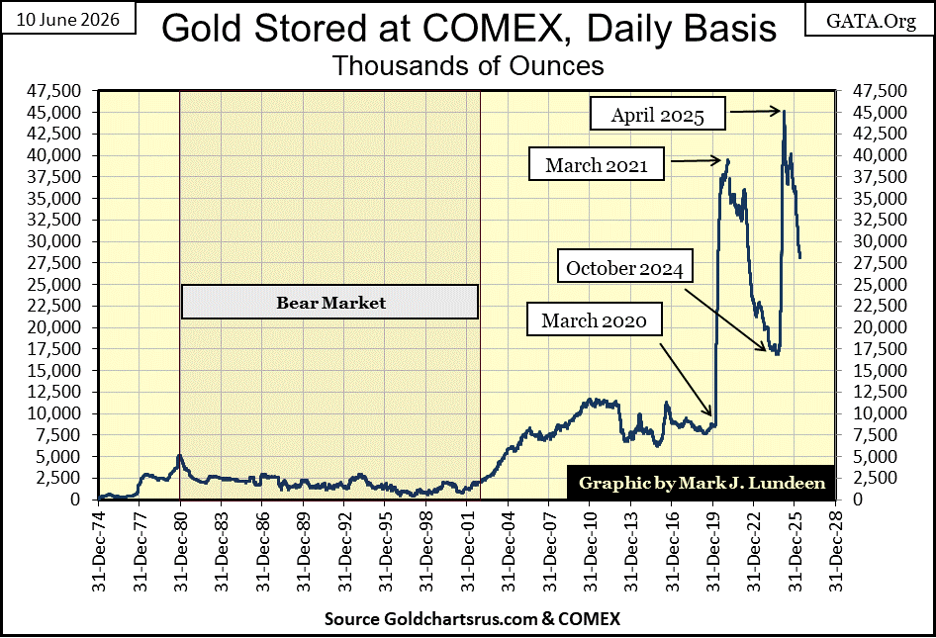
Now, without further ado, we’ve arrived to my chart on the COMEX gold inventories. Since March 2021, inventories at the COMEX have been in decline. There was that massive spike in inventories from October 2002, to April 2025. Martin Armstrong at the time said that was European gold fleeing Europe, for fear of confiscation by the EU. I’ll take his word on that. But since April 2025, COMEX gold inventories have once again begun to decline.
Is the decline of gold inventories at the COMEX limiting the supply of gold in the gold market, that should be bullish if true. As always, time will tell all.
Here is a small item to take note of; it was in March 2020 when inventories of gold began to surge upwards at the COMEX. It was in March 2020 when Wall Street had its Flash Crash, a time when the FOMC for the first time in history, began “monetizing” corporate debt. It was also the time of FOMC Idiot Primate Powell’s Not QE#4, when in a single month, he “injected” two trillion dollars of “liquidity” into the financial system, to “stabilize market valuations.”
Is there a connection between the March 2020 Flash Crash at the NYSE, and the spike in gold inventories at the COMEX? I can’t say one way or the other. But looking at the plot below, its is impossible to say there isn’t a connection.
Let’s now look at gold’s BEV chart below. This week gold broke below its BEV -25% line, as it continues making lower lows in the chart below. I don’t like it, but there it is.
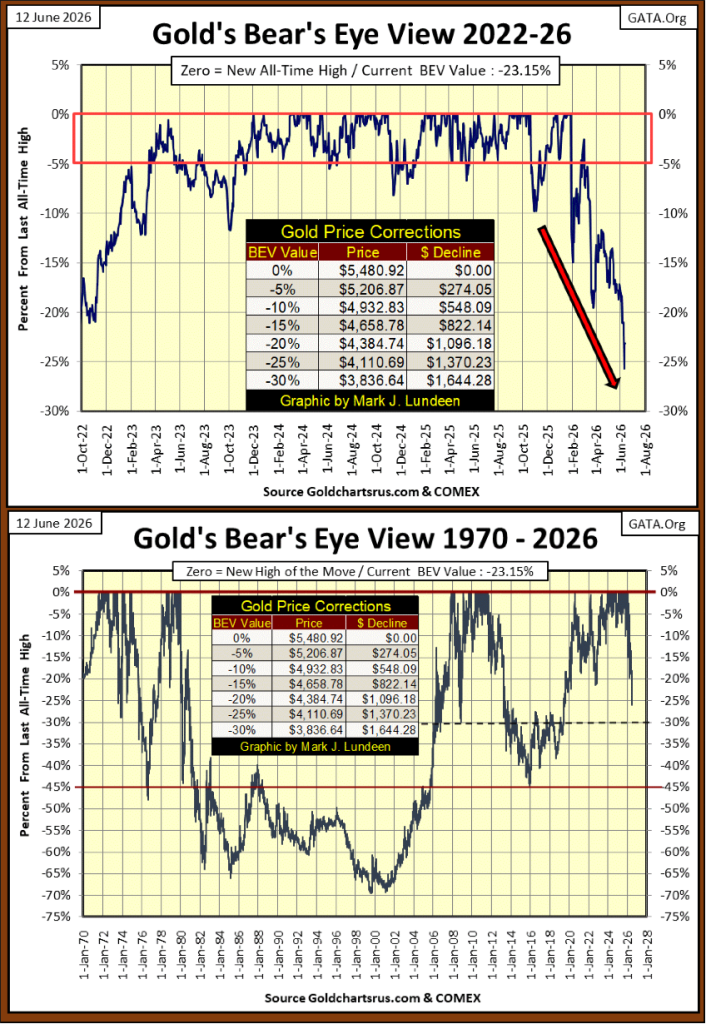
Taking a look at gold’s longer term BEV chart above, since 2006, its BEV -30% line has provided both a level of resistance on market advances, and support on market declines. I’m interested seeing if in our current correction, gold’s BEV -30% line ($3,836) will provide a floor to this decline.
Here is silver’s BEV chart. This week silver broke below its BEV -45% line. That is silver for you, a wild ride during its bull markets.
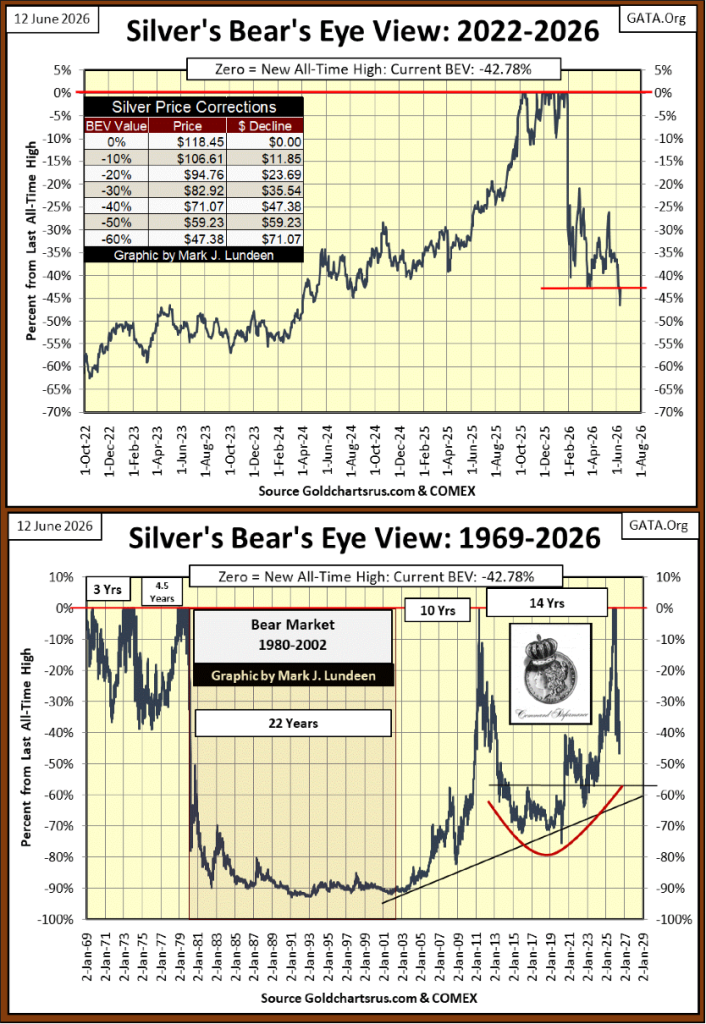
Looking at silver’s long-term BEV chart above, comparing this correction to its past market declines, so far silver really isn’t doing all that bad, if it is possible to say that about a 45% market decline.
What comes to my mind about the current correction in gold, silver and the precious metals mining companies, the bears have been very successful shaking out all of the weak hands in these markets. Meaning, when the bottom finally comes – it will be one hell of a hard bottom, bottoms where the bear’s, try as they might, simply could not get these market valuations down any further. That will provide for one hell of a base for the next phase in this bull market.
Looking at gold’s step sum table below, we’re still seeing daily declines overwhelm daily advances. The week closed with gold’s 15-count at a -1, so maybe a turn in the market is at hand. But, to finally see a bottom in gold’s current correction, I’d like to see the bears do their best to hammer the price of gold down, day after day, yet fail to drive the price of gold down below its BEV -30% line.
Market declines such as this, end in exhaustion by the bears. Doing all they can, day after day, they just can’t drive valuations down any more. Seeing gold’s 15-count decline to a -7, or better yet a -9, would definitely be a bullish, if painful leading indicator of a pending advance.
Will that happen? It would be a technically poetic bottom to this correction. I’ll tell you all about it come August, maybe in July.
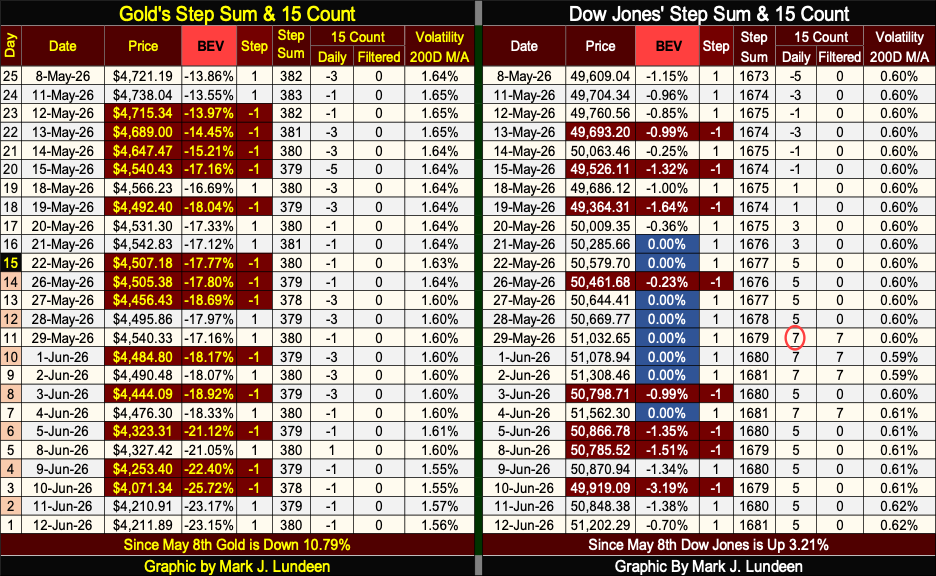
The Dow Jones’ 15-count closed the week at a +5, meaning the stock market continues seeing more daily advances than daily declines. Seeing all of those blue BEV Zeros in May, tells us the stock market is using these daily advances too good effect.
Daily volatility remains low for the Dow Jones, as is typical of bull markets advances. Looking at the Dow Jones daily volatility’s 200D M/A below, we see the big five market declines since 1960, and each one of them happened on rising daily volatility in the Dow Jones.
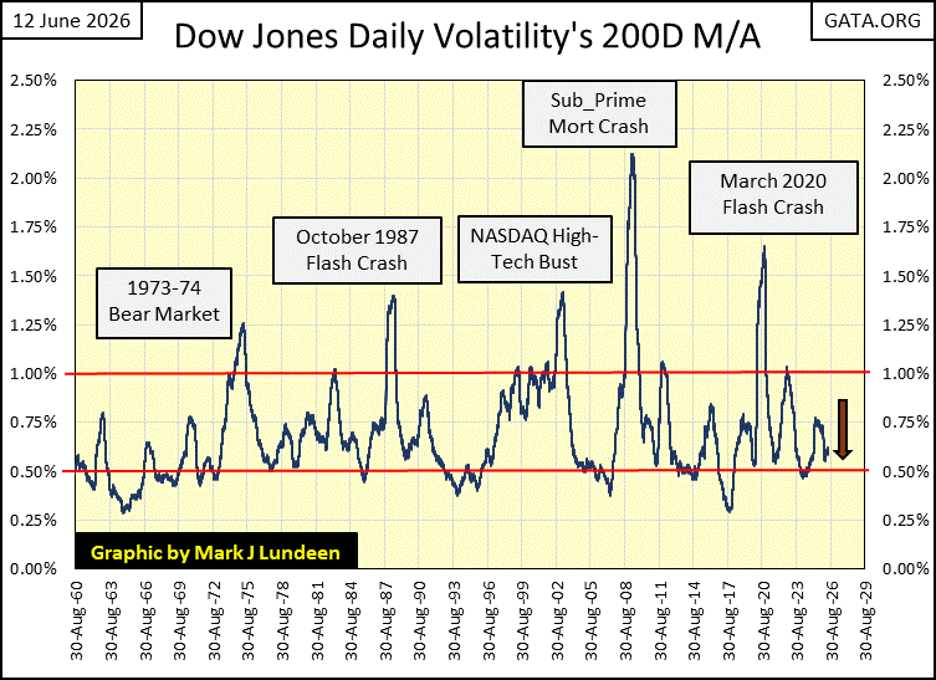
As daily volatility for the Dow Jones currently remains so low, I have to remain bullish on the stock market, until it begins to rise, and the plot above breaks above the 1.00% line.
What could make that happen? Days of extreme volatility for the Dow Jones; days the Dow Jones moves in excess of +/- 2%, from their previous day’s closing price; aka Dow Jones 2% Days. When these extreme days finally come, and they will, they’ll arrive unannounced. We’ll then see how swiftly the plot in the chart above can break above its 1.00% line.
What was the market cap of SpaceX after its IPO was floated this week? $2.1 trillion dollars. It’s giving me the heebie jeebies. After I send out this article, I’m going to find a nice dark, and quite room, somewhere to self-medicate myself with a generous glass of Wild Turkey 101. Maybe a cigar too, to calm my nerves.
__
(Featured image by SpaceX via Unsplash)
DISCLAIMER: This article was written by a third party contributor and does not reflect the opinion of Born2Invest, its management, staff or its associates. Please review our disclaimer for more information.
This article may include forward-looking statements. These forward-looking statements generally are identified by the words “believe,” “project,” “estimate,” “become,” “plan,” “will,” and similar expressions, including with regards to potential earnings in the Empire Flippers affiliate program. These forward-looking statements involve known and unknown risks as well as uncertainties, including those discussed in the following cautionary statements and elsewhere in this article and on this site. Although the Company may believe that its expectations are based on reasonable assumptions, the actual results that the Company may achieve may differ materially from any forward-looking statements, which reflect the opinions of the management of the Company only as of the date hereof. Additionally, please make sure to read these important disclosures.


Blockchain Evolves Toward AI, Finance and Quantum Security
Blockchain is evolving beyond crypto into finance, AI applications, and digital markets, while security and regulation remain challenges. Quantum threats...


The Italian Crowdinvesting Market Faces Sharp Decline in 2026
Italian crowdinvesting market continued to decline in 2026, with fundraising falling 36.8% year-on-year to €164.19 million. Platforms and active campaigns...


Sartorius Stedim Biotech Maintains Growth Momentum in H1 2026
Sartorius Stedim Biotech reported solid H1 2026 results, with revenue reaching €1.527 billion and EBITDA rising to €479 million. Growth...


Bank of Africa Launches BOA MDM Network to Boost Diaspora Investment in Morocco
Bank of Africa launched the BOA MDM Network to channel diaspora remittances into productive investment, aiming to raise their share...


Switzerland’s Medical Cannabis Reform Advances Access, But Barriers Remain
Switzerland’s 2022 medical cannabis reform improved patient access by removing federal approval requirements, but challenges remain. MEDCAN highlights barriers including...
 |
|
 |  |
 |
|
-

 Africa2 weeks ago
Morocco Cuts Card Fees to Spur Digital Payments, but Uncertainty Remains
-
 Biotech1 day ago
Sartorius Stedim Biotech Maintains Growth Momentum in H1 2026
-

 Cannabis1 week ago
Virginia Cannabis Market Could Reshape Regional Competition
-

 Impact Investing4 days ago
Ecobnb Turns Sustainable Tourism Into Measurable Impact