Business
Dow Jones’ Record Run Faces Early Signs of Potential Shift
Since November 2023, the Dow Jones has logged 95 all-time highs, rising 43% from 37,090 to 53,056 over 32 months—a strong run for blue-chip stocks. However, such advances don’t last forever. While no clear warning signs dominate, weakness in NASDAQ indexes and recent declines in SpaceX shares could signal potential emerging bearish trends.


Since the Dow Jones entered scoring position in November 2023, it has generated ninety-five new all-time highs, or daily closes on the 0.00% line in its BEV chart below. The last on Monday, July 6th. All those new all-time highs have pushed the Dow Jones up from 37,090 on 13 December 2023, to 53,056 nine trading-days ago. An advance of 15,966 dollars, or 43% in the past thirty-two months. That isn’t bad for thirty, old fogy, dividend-yielding blue-chip stocks.
I’m pointing this out, as we should keep in mind that nothing goes on forever, including this advance in the stock market. I’m not warning of anything specific I see currently in the stock market. Though I note the big NASDAQ Indexes fell below scoring position, and I heard Elon Musk’s SpaceX shares have declined this week. All that could change by next week, with new all-time highs for a far as the eye can see. Then maybe, these bearish developments will become future trends in the market.
I’m just being a worry-wort on the market because – I don’t know why. As of the close of this week, the Dow Jones remains deep in scoring position; only 1.72% below its last all-time high. So, if you’re enjoying the ride, there is no need to jump out of a perfectly good airplane – just yet.
When that time arrive, and it will, we’ll hear the first alarm, when the Dow Jones in its BEV chart below, declines below its BEV -5% line. Don’t jump just yet. Wait until the Dow Jones deflates below its BEV -10% line, or maybe its BEV -7% level. Call me crazy, but after a three-year advance in the market, investors need an exit plan to lock in their profits. Or ultimately, I fear, Mr Bear will lock in their positions with losses. As exit plans go, what I’ve written above, is a pretty good one.
Oh, one more thing. If daily volatility for the Dow Jones increases to the point when the Dow Jones begins seeing regular, once or twice a week, daily moves in excess of 2% from a previous day’s closing. That would be very, very bad.
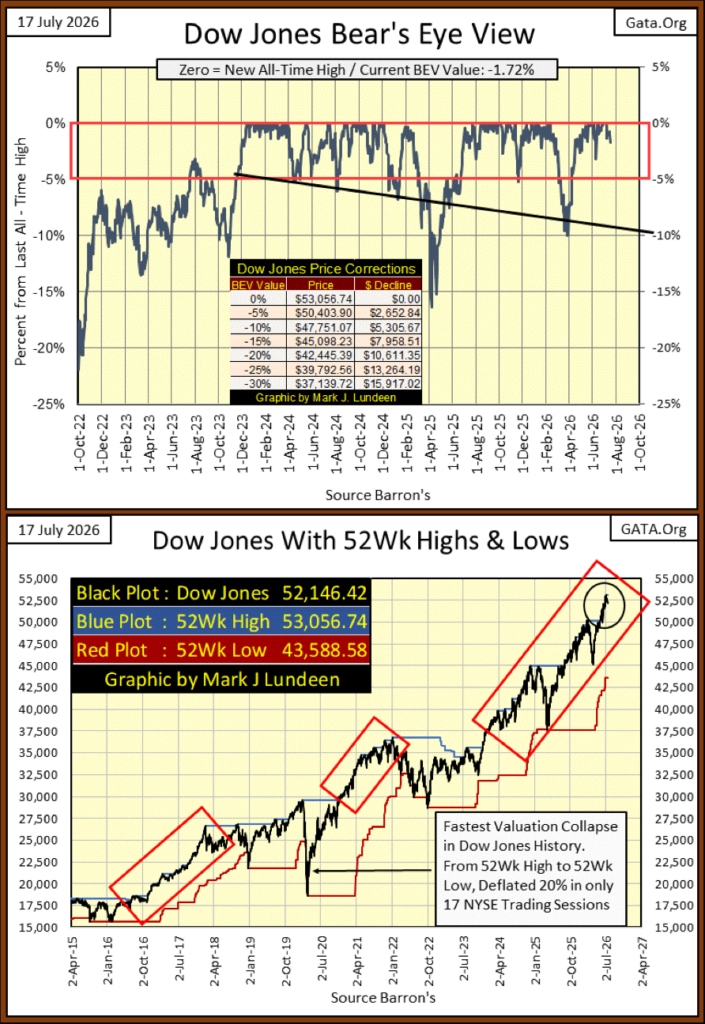
Above is the Dow Jones plotted with its 52Wk High & Low Lines. Within the far-right red rectangle, is the same data seen in the Dow Jones BEV chart above, just in the dollars it was published in.
This is an interesting chart, as it illustrates a repeating pattern the Dow Jones has been in since it entered scoring position in November 2023. For a year, November 2023 to January 2025, the Dow Jones remained in scoring position, generating new all-time highs as time passed by.
Then came the March / April 2025, 15% correction. That done, the Dow Jones once again began advancing, remaining in scoring position until the March / April 2026, 10% correction. Following that, the Dow Jones began the advance we enjoy still today.
So, since November 2023, the Dow Jones has advanced in three phases, separated by two corrections;
- November 2023 to January 2025 (37,500 to 44,401 / gain of 6,901)
- August 2025 to January 2026 (44,401 to 50,000 / gain of 5,599)
- June 2026 to July 2026 (50,000 to 53,056 / gain of 3,056)
The first two phases of advance, were good for around 6,000 on the Dow Jones. Our current advance, since June has made half of its anticipated 6,000 points. Question; will the Dow Jones advance to 56,000, BEFORE it deflates to its BEV -5% line, to maintain this repeating pattern it has been in since November 2023?
I’m game for the Dow Jones at 56,000. And the Dow Jones in its BEV and 52Wk H&L charts above look good, ready to make that happen. But should the Dow Jones break below its BEV -5% line (< 50,400 = falling out of scoring position) before it sees 56,000, that would be a bad omen for the bulls, as that would tell us that something is changing in the market.
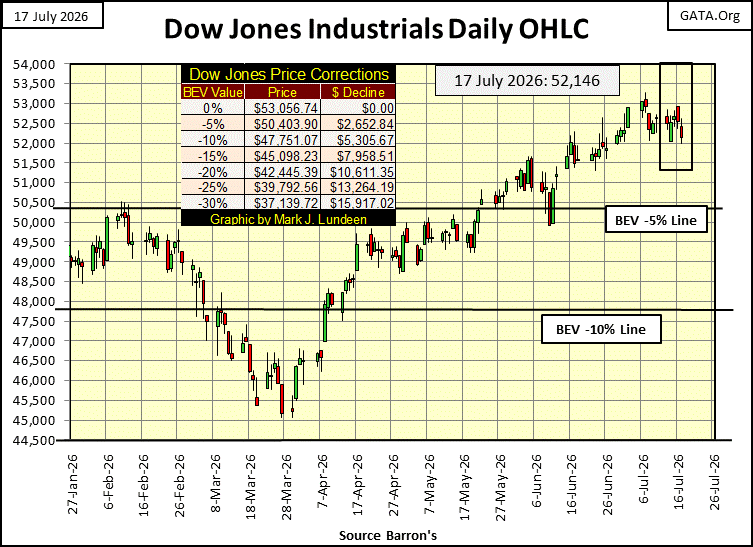
Last week for the Dow Jones in its daily-bar chart below, we saw the Dow Jones take a pause. The same thing happened this week. Why? Because the Dow Jones has been advancing since August 1982, when it last closed below 800. Old geezers running up a hill need a rest now and then. What will it be at next week’s close; another new all-time high, or the Dow Jones drifting ever closer to its BEV -5% line? I’ll tell you all about it next week.
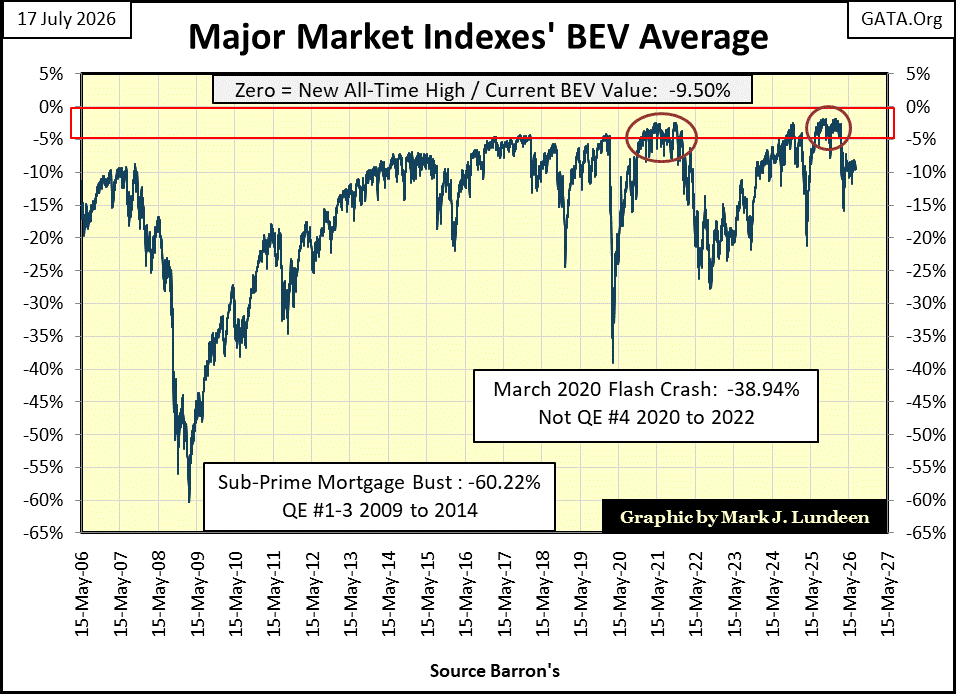
New all-time high production for the major-market indexes seen in the table below (below the chart) is on the decline. There were no new all-time highs at Friday’s close. That and, the average BEV value (#19) for these indexes has almost broken below -10%. Truth be told, we can blame most of that miserable performance of the XAU, which is almost 40% below its last all-time high of last January.
No matter, let’s take a look at this average in the chart below. As this series is an average, it will never see a BEV Zero, unless every in average is a BEV Zero, something I can’ see ever happening. But when this average is above its BEV -5% line, as from May 2025, to February 2026, the stock market is generating solid gains for investors.
During the market correction seen this spring in March / April, the average BEV of the major-market indexes broke below its BEV -15% line, but has rebounded back above its BEV -10% since then. Does this market advance still have it in it, to drive this average back above its BEV -5% line once again? And if not, what is next, a close below its BEV -15% line, for the second time in 2026?
In the table below, listing the Bear Eye’s View (BEV) values for the major-market indexes I follow, this week didn’t see many new BEV Zeros (new all-time highs), but did close the week with thirteen of the indexes in scoring position, within 5% of making a new all-time high. Considering everything, the current market advance remains intact.
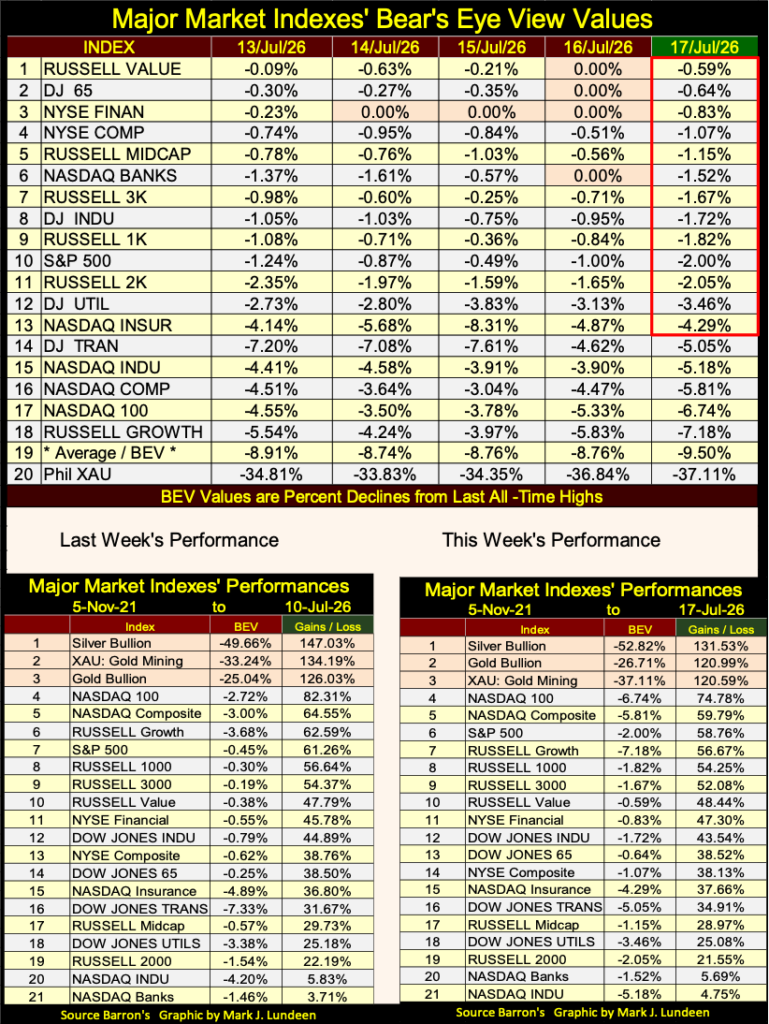
Looking at this week’s performance table above, as they have been for well over a year, precious metal assets remain in the top three spots. But since last January, week after week, their gains have been ground down. Look at silver’s BEV value: -52.82%. Silver has lost over 50% of its gains of last January.
I keep talking about last January when referring the good times with the old monetary metals, and the XAU. So, for this week I thought I’d include the major market BEV values table from last January 23rd, when the XAU was the #1 major-market index, making four new all-time highs that week.
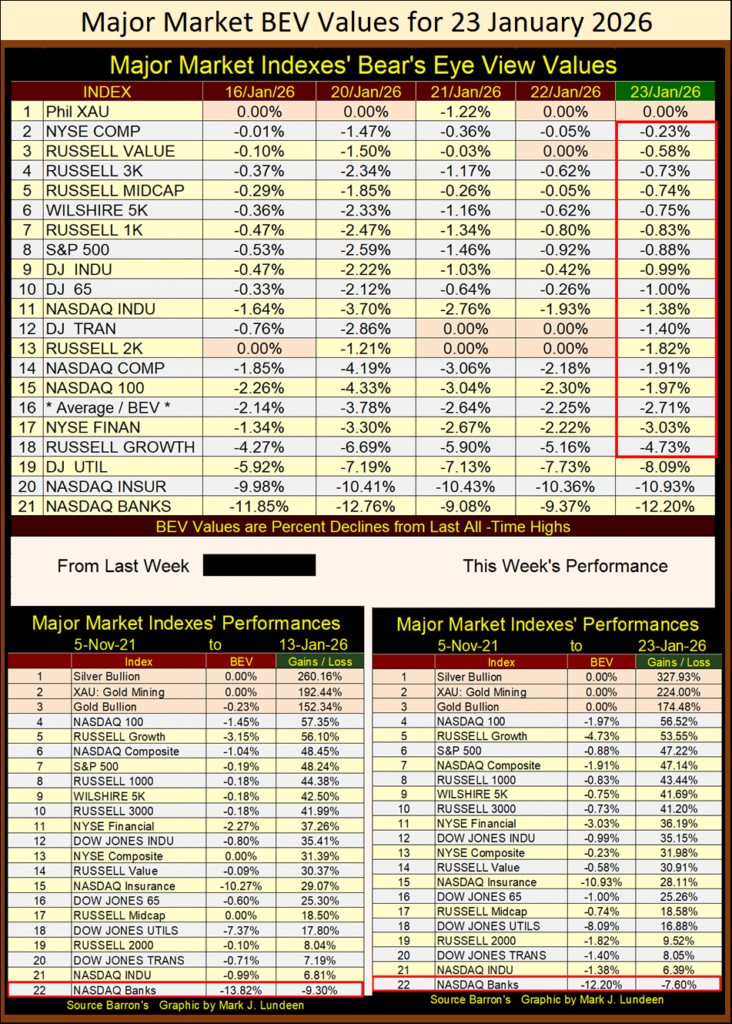
In the performance table for last January 23rd, again precious metal assets were in the top three spots, but look at how much they were leading everything else in the market six months ago, and each closed the week with a BEV of 0.00%, at a new all-time high.
Six months later, all that has changed. However, keep in mind one thing will never change; to make money in the market, one must first buy low, before they can sell high. But human psychology is such, people don’t want to do that. Instead, they covet what is overvalued, and despise true bargains in the market.
I didn’t recommend it last January, when precious metal assets were high. But for anyone who sold them then, to now buy them back when they are down by 30% to over 50% today – that would have been not only a triumph over human psychology, but a very astute move.
Thank God, the Commodity & Futures Trading Commission (CFTC) is investigating something! President Trump’s teleprompter operator was using information intended to be used by Trump in upcoming press conferences, for personal profit ($90,000) from insider information. * WHO DID THIS GUY THINK HE IS, A MEMBER OF CONGRESS?! *
I feel sorry for him, as the CFTC is going to throw the book at him, to make an example for others who would do such a despicable thing for personal gain.

Trump teleprompter operator suspend amid Kalshi bets probe
I have my doubts whether the CFTC could find anything as despicable to investigate in the silver market. Though over the years, there have been plenty of things to “flag” their attention of blatant manipulation inside the COMEX silver pits, had they cared to look for them.
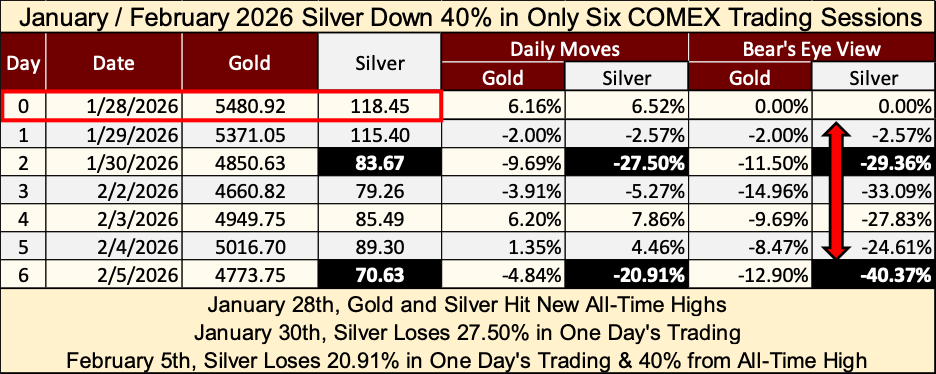
The latest occurred just this year, on January 28th, when the price of silver collapsed by 27.5% at the close of that day’s trading. Also, the price of silver was down by 40% from an all-time high, in only six trading sessions at the COMEX. The table below gives all the grizzly details; silver from a BEV Zero on January 28th, to a BEV of -40.37% on February 5th, just six days later.
Geeze Louise, how does something like that happen? Don’t ask the CFTC, as they don’t give a hoot about something like that.
To see the true scale of this one-day collapse in the price of silver, below is a chart plotting every daily move in the silver market of 5%, or more, since January 1969. The single day decline seen on January 28th 2026, is only exceeded by the daily declines seen in 1980. When the CFTC allowed the COMEX to change the trading rules, where only sell orders were accepted at the COMEX.
That’s right, in early 1980, silver-futures traders were prohibited from buying silver contracts, but selling was officially encouraged by the silver market’s “regulators.” On March 27th 1980, silver saw a one-day decline of 31.65%.
The message was sent, and received by the longs in the silver market; going long in the silver market is more pain than gain. And so it was until 2002, when a new generation of traders saw silver once again entered into a bull market. Will January 28th, 2026’s, one day loss of 27.50%, signal another forty-two-year bear market in silver?
The goons running wild in the silver pits would love that. I expect, this time will prove to be very different.
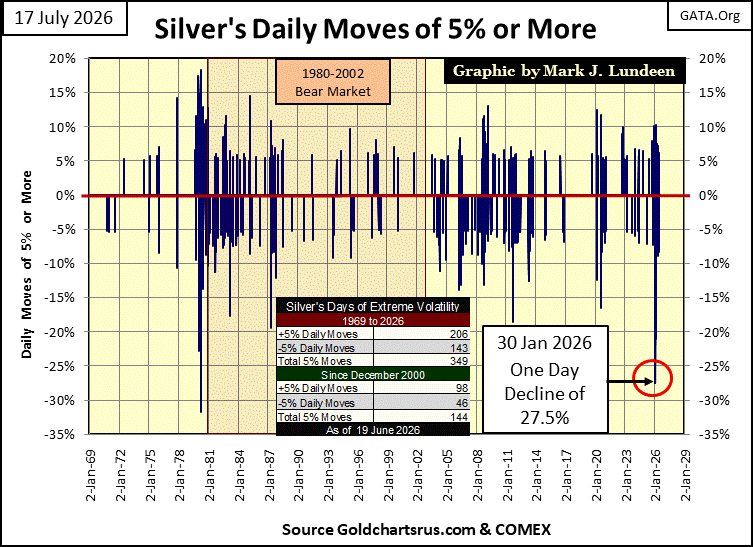
The above graphics are damning, that something isn’t right with the administration of trading silver at the COMEX. Not that the CFTC will see it that way. Especially so, now that they have something more important to investigate; the White House teleprompter’s using insider information for personal profit.
Here is a chart of silver in dollars going back to 1969. Nothing odd to see below. Except maybe, how for decades, silver couldn’t break above $50 an ounce. And when it finally did, it shot up to $118 an ounce just four months later, from October 2025 to January 2026. And now in July 2026, silver has given up over half of those gains.
All and all, this is one wild chart! But the one thing I’m keeping my eyes on is this; for many decades, $50 silver was a very hard ceiling for the silver market. Now in 2026, will $50 silver now become a very hard floor?
I’m hopeful it will. Consider silver has fallen by 53% since January. BUT 40% of that 53% happened in the first six days of this decline. So, most of these past six months were to get silver to decline an additional 13%? That seems to be the case. Do the bears have what it takes to drive the price of silver below $50 an ounce? We will soon find that out.
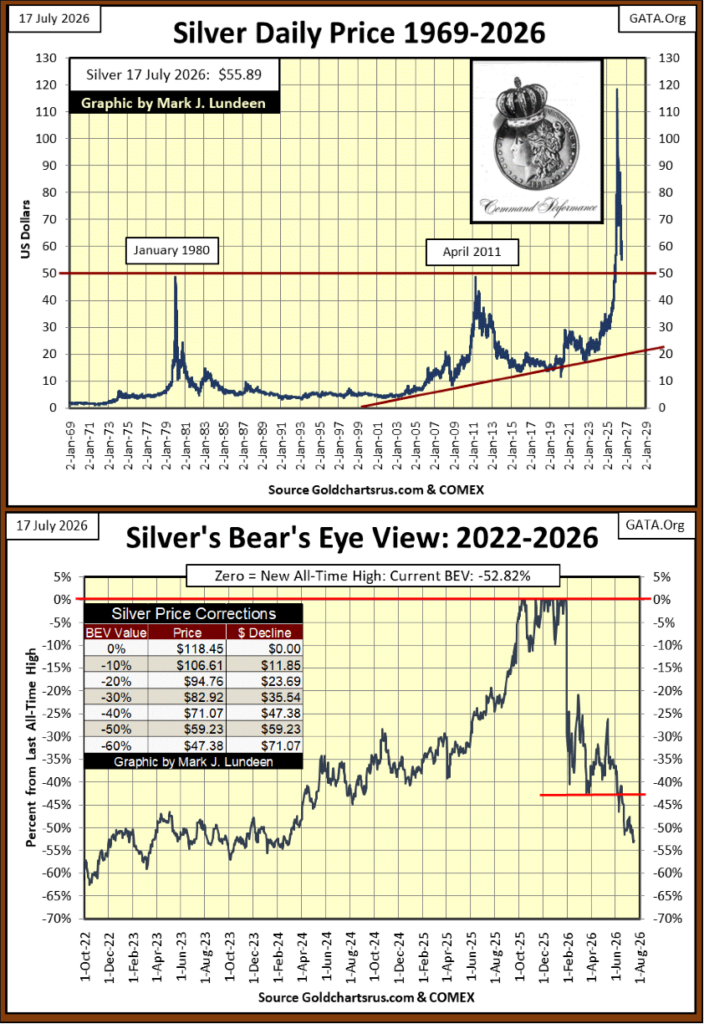
Above is silver’s BEV chart. Like a bull market, bear markets too are a game of diminishing returns. For the bears, the first declines are always the easiest. But the deeper the decline goes, the more work must be done to generate additional losses. How much more can the goons at the COMEX silver market, drive down the price of silver? After crossing silver’s BEV -50% line, the bear’s end point must be rapidly approaching.
After this bear market in silver bottoms sometime in the weeks / months to come, the following bull market recovery in silver might be historic. Do yourself a favor, and overcome our accursed “human psychology,” and buy some silver at today’s prices, and you too may someday become an astute investor!
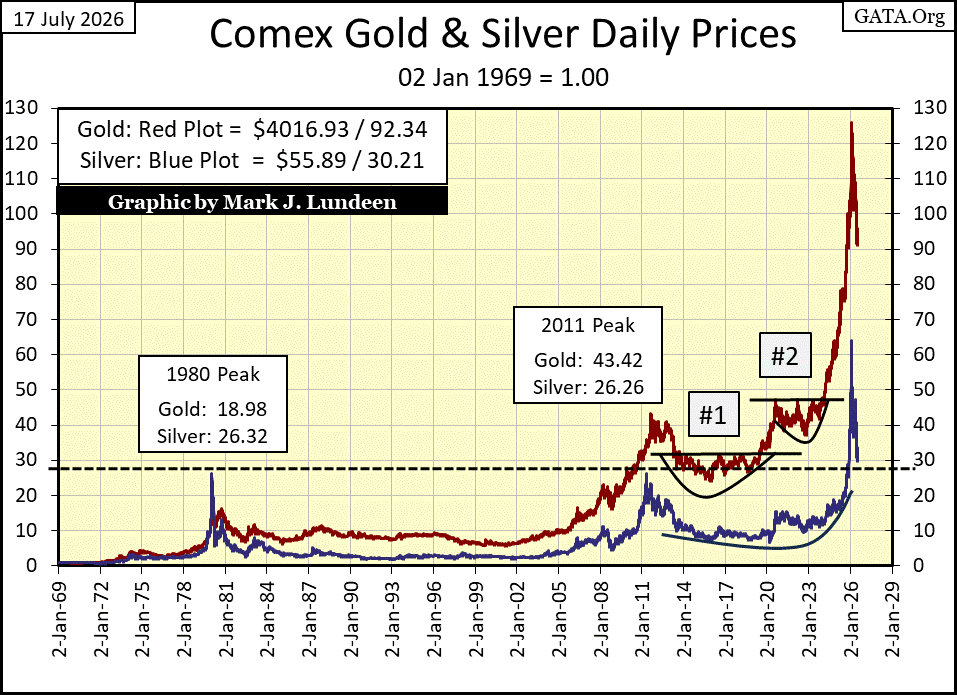
Here’s a chart plotting gold and silver indexed to 1.00 = January 1969. The past year for gold and silver have been historic, both the upward spike, and collapse in valuation. Time will tell what comes of it, but I remain bullish on the old monetary metals.
Next is gold’s BEV chart, which remains short-term bearish. Since January, gold has broken below its BEV lines, one by one; first the BEV -10% line, down past its BEV -25% line, like a hot knife threw butter. No pause, no uncertainty, gold just went down, passed these potential lines-of-support, breaching each one in turn. Until it approached its BEV -30% line, where to my eyes, for the first time in months, gold is now considering what to do next.
Break below gold’s BEV -30% line? The bears would love to do that next. But never forget, there are bulls out there too. Maybe with gold now down by 25% from last January’s all-time high, the bulls’ opinions on the market are becoming more important, and they would certainly prefer seeing gold next close above its BEV -20% line.
This is certainly a very interesting battle between the bulls and the bears, that we’ll follow very closely in the weeks to come.
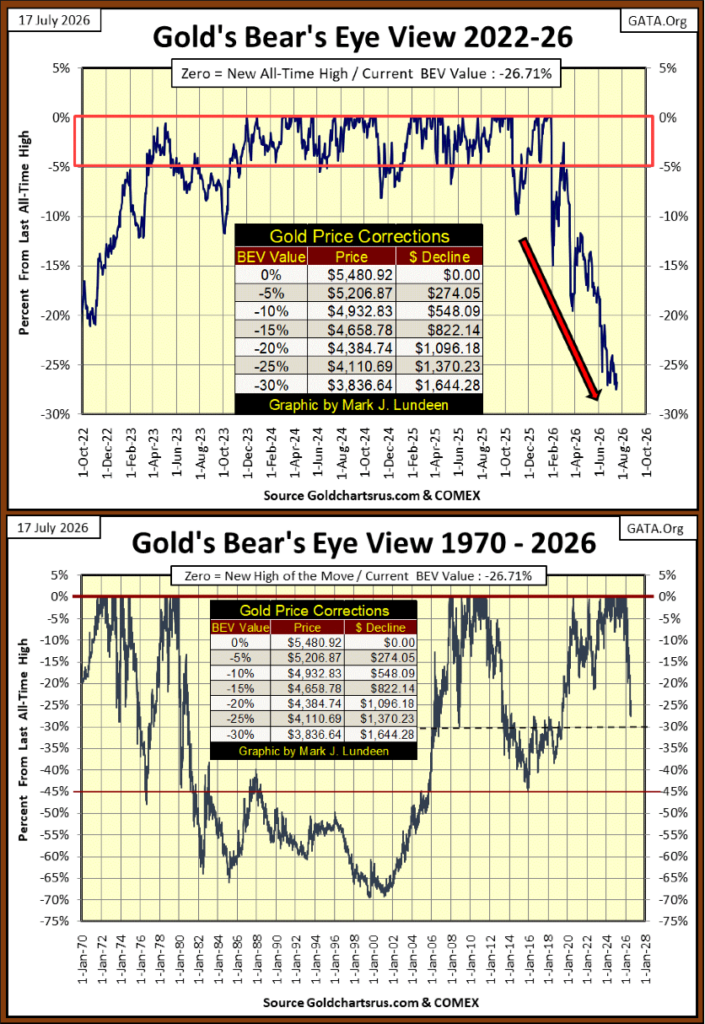
Above is a longer-term Bear’s Eye View of gold going back to 1970. As far as corrections in a bull market goes, gold’s current correction, has so far been very much contained. If the bulls can prevent gold from breaking below its BEV -30% line in the weeks to come, gold, silver and their mining companies may have a very Merry Christmas in 2026.
This week, gold in its step sum table below saw a new low for the move on Thursday, July 16th. Breaking below its previous low of the move on June 24th, by twenty dollars. Nothing Earth shattering, as we note gold has yet to close below its BEV -30% level. In mid-July 2026, that is the line on the map, this war between the bulls and the bears in gold are now fighting over; gold’s BEV -30% line, or $3,836 in dollar terms.
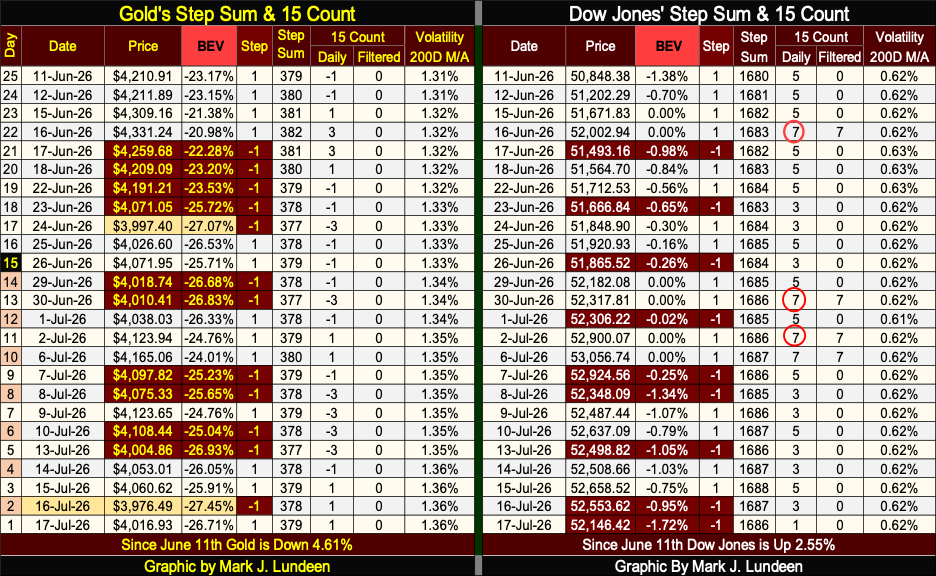
On the Dow Jones side of the table, the Dow Jones is beginning to see an increase in the number of days closing down. Since the last time it has seen a 15-count of +7, which is an over-bought market, the volume of daily declines has increased. In the weeks to come, will the Dow Jones 15-count become negative, and if so, will it eventually see a 15-count of -7, making the Dow Jones an over-sold market?
That is how these things usually go, and it’s only a matter of time before it does. What impact on the Dow Jones’ valuation will a negative 15-count result in is another thing. Should the Dow Jones begin seeing more daily declines, than daily advances, may not even drag it below its BEV -5% line, and then it might.
The big number to now watch in the Dow Jones step sum table above is; its daily volatility’s 200D M/A, which currently closed the week with a very bullish 0.62%.
Since the Dow Jones was first published in February 1885, no bull market at the NYSE, has long survived, after seeing the Dow Jones daily volatility’s 200D M/A rise up to its 1.00% line, and then sustained that increase in daily volatility. In the chart below, there are five historic bear markets to prove that point.
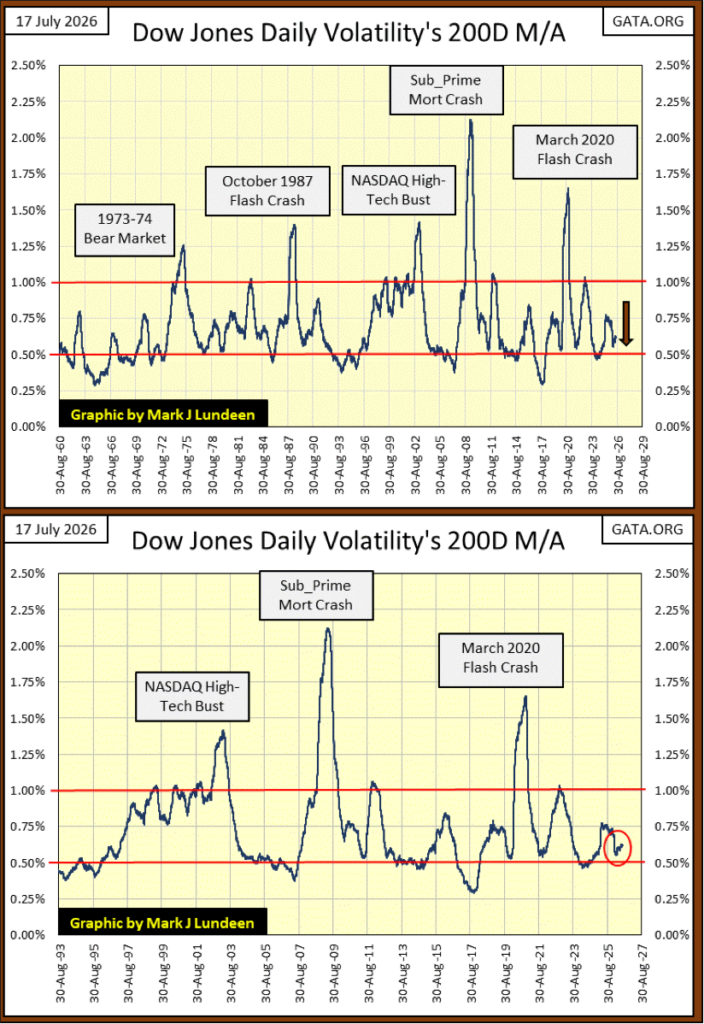
Question; is Dow Jones daily volatility once again on the rise? Look at the chart above, and what do you see in the red circle? Since early March, when this metric of daily volatility bottomed at a 0.56%, it has been rising, closing this week with a 0.62%.
Not much of a rise – but it’s there. How long before the stock market must once again endure the dreaded Dow Jones days of extreme volatility, Dow Jones 2% days? We will discover that together, in the weeks and months to come. This autumn may prove to be a very interesting time in the market.
__
(Featured image by Meriç Dağlı via Unsplash)
DISCLAIMER: This article was written by a third party contributor and does not reflect the opinion of Born2Invest, its management, staff or its associates. Please review our disclaimer for more information.
This article may include forward-looking statements. These forward-looking statements generally are identified by the words “believe,” “project,” “estimate,” “become,” “plan,” “will,” and similar expressions, including with regards to potential earnings in the Empire Flippers affiliate program. These forward-looking statements involve known and unknown risks as well as uncertainties, including those discussed in the following cautionary statements and elsewhere in this article and on this site. Although the Company may believe that its expectations are based on reasonable assumptions, the actual results that the Company may achieve may differ materially from any forward-looking statements, which reflect the opinions of the management of the Company only as of the date hereof. Additionally, please make sure to read these important disclosures.














FinTech Matures as AI and Infrastructure Drive the Next Growth Phase
Fintech markets are entering a mature phase, shifting from rapid growth to consolidation, specialization, and sustainable business models. Zurich and...


Bitcoin, and Ethereum Rise, While Cardano Enters Transition
Bitcoin and Ethereum posted modest weekend gains, supported by ETF inflows. A new proposal may protect Bitcoin from quantum threats....


Dow Jones’ Record Run Faces Early Signs of Potential Shift
Since November 2023, the Dow Jones has logged 95 all-time highs, rising 43% from 37,090 to 53,056 over 32 months—a...


Oil Surge, Weak Stocks, and a Potential Turn for Gold
Oil surged sharply, a trend supporting waste management and energy infrastructure firms like Secure Waste Infrastructure Corp., which reported higher...


Avant Devices Moves Toward Electric Wheelchair Kit Production with New Funding Drive
Murcia-based Avant Devices is seeking €260,000 in crowdfunding to launch mass production of its electric wheelchair conversion kit. The funds...
 |
|
 |  |
 |
|
-

 Crypto2 weeks ago
Crypto Markets Shaken by Geopolitics and Industry Tensions
-
 Fintech13 hours ago
FinTech Matures as AI and Infrastructure Drive the Next Growth Phase
-

 Markets1 week ago
Dow Jones Pauses Near Record Highs as Precious Metals Lead
-

 Africa2 weeks ago
Fes-Meknes Sees Strong Recovery in Cereal Production Thanks to Increased Rainfall