Business
Dow Jones Holds Strong, Signaling Potential for New Highs
Since July 6, the Dow Jones has stayed above its BEV -5% line, signaling bullish momentum and likely new highs. Despite a recent 2% drop, similar past volatility preceded gains. Unless such swings increase, outlook remains positive. Near record levels, gains could push higher, though caution is urged as long-term risks and profit preservation matter.


We’ve not seen a new all-time high (BEV Zero) for the Dow Jones, in its Bear Eye View chart below, since July 6th. However, the Dow Jones has daily closed inside of scoring position, above its BEV -5% line.
Okay, so what?
It’s a big “what.” Because as long as the Dow Jones remains in scoring position, we should anticipate additional new all-time highs for the Dow Jones. As the Dow Jones is my proxy for the broad-stock market, I’m anticipating this market advance for the rest of the stock market, also remains intact.
It’s just a fact of over a century of market history; no stock market bull, or bear market has happened, without the Dow Jones participating. The Dow Jones is an excellent barometer of the stock market. What about the S&P 500? That will do too. But the Dow Jones goes back to the 1880s, which means the Dow Jones is uniquely, historically significant. Nothing else like it in the world.
On Wednesday this week, the Dow Jones also saw a day of extreme volatility, a Dow Jones 2% day, where it closed down by 2.19%, from Tuesday’s close.
I’m not going to go ape over this one Dow Jones’ 2% day. In late March / early April, the Dow Jones saw two 2% days during its 10% correction, seen below. Also seen below, the Dow Jones following its 10% correction, was soon generating new all-time highs, BEV Zeros.
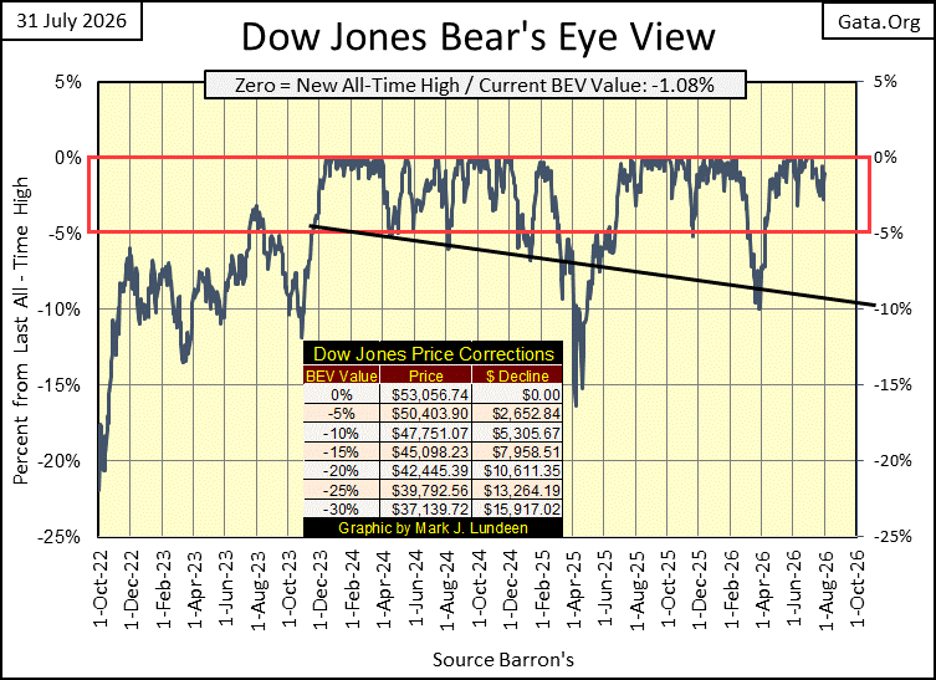
Even so, should the Dow Jones in the weeks and months to come, continue generating days of extreme volatility, Dow Jones 2% days, that would be a very bearish development for the stock market. But I don’t see them yet, so I remain short-term bullish in the stock market.
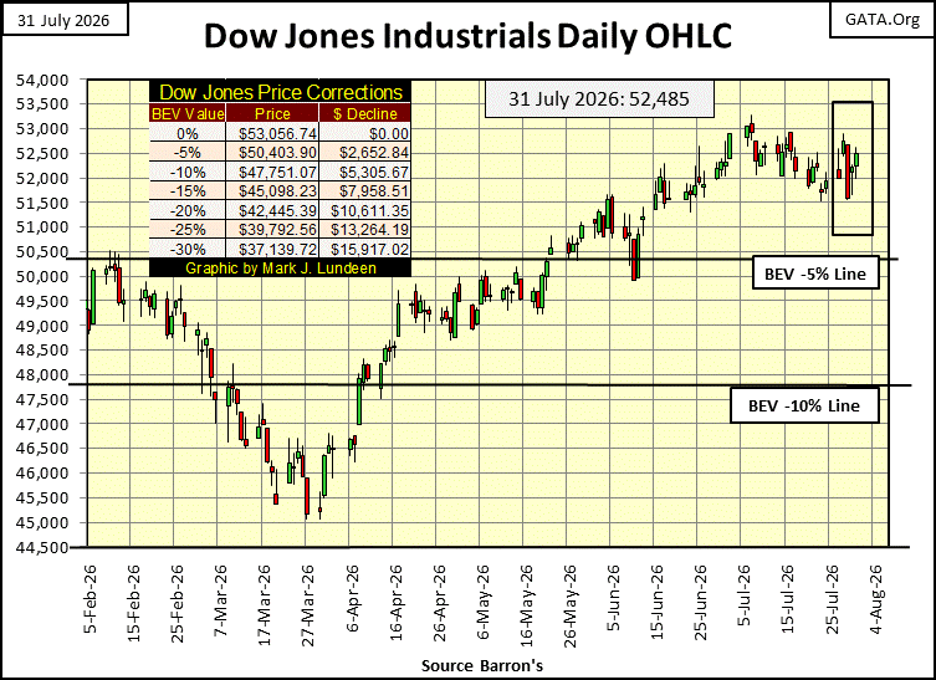
Next is the Dow Jones plotted in daily bars. The Dow Jones’ 2% day is easily seen in this chart, the large Red Bar for Wednesday. On Thursday and Friday, the Dow Jones recovered, but not back to is highs on Tuesday.
No matter. At this week’s close, the Dow Jones was only 571 points from its last all-time high, seen on July 6th. If the bulls really wanted it, driving the Dow Jones up by 572 points (1.09%) in a single day would be easy – if they wanted it.
Do the bulls really want it? I expect we’ll soon find out. I’m still game for the Dow Jones closing above 55,000, even 60,000, not that I would expose any of my money on the chance of that happening.
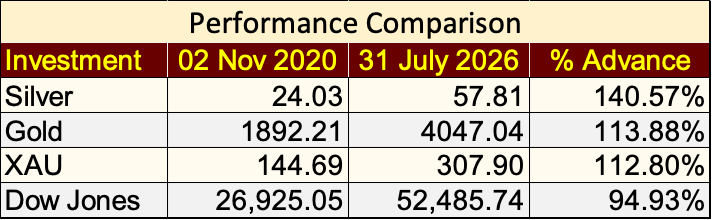
At some point, investors have to walk away from the table, or risk losing all of their capital gains, and then some. I walked away from the stock market, before the Dow Jones approached 30,000 in 2020. It was a good move. Even after the corrections seen by gold, silver and the XAU so far in 2026, since November 2020, they’ve still outperformed the Dow Jones.
As it is now, the stock market is pure theatre to me. I cheer when it goes up, and shed crocodile tears when it’s down, as I have no risk in this stock market, other than gold and silver miners.
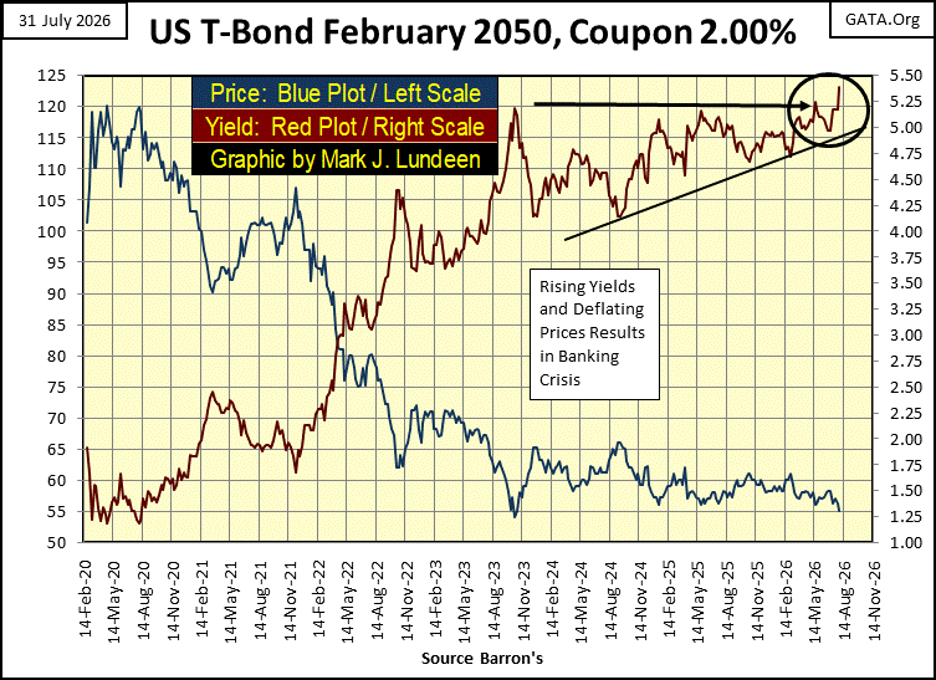
One pending problem I see coming down the road, is bond yields are rising. The data plotted below is weekly closing data. This T-bond has finally done something it first attempted to do three years ago; have its yield close above 5.25%, at this week’s close: 5.39%. Remember; rising bond yields = declining bond prices.
No one talks about it, but T-bonds, as well as the corporate bond markets, have been in a bear market since August 2020. So far, the stock-market bulls, now running wild and free at the NYSE, could care less. But should this T-bond’s yield rise up above 6%, only 61 basis points from this week’s close, they might think differently about rising bond yields.
Are T-bond yields going to continue rising? I think the smart money is assuming they will. For one thing, T-bonds are becoming less desirable around the world, as seen in the table below, latest data May 2026.
Look at the Percent From (Max Val) column, listing the percent reduction from these countries’ maximum holdings of T-bonds. China (#1) has sold off 49.93% of its one-time, $1.316 trillion dollar position in T-debt. The Federal Reserve itself has sold off 24.28%, of its one-time $8.498 trillion dollar position in T-debt.
This data from the US Treasury Department tells us, as of May, only Ireland, Israel, and the United Kingdom (#20-22) currently have record holdings of Treasury debt. Every other country has been selling their holdings of Treasury debt, including the Federal Reserve. Selling trillions of dollars of T-bonds, to who?
Don’t ask me, as I’m not a “market expert.” I’m only a retired US Navy Chief Electrician, someone who somehow took up compiling market data as a hobby, and writes a weekly article on what I find of interest, to me, in the financial system.
What I would find really interesting would be, a line item below, that picked up, what everyone else is getting rid of – T-bonds. So, whoever, or whatever is buying what is being sold below, US Treasury Debt by the hundreds of billions, isn’t included in this table. Odd, very odd.
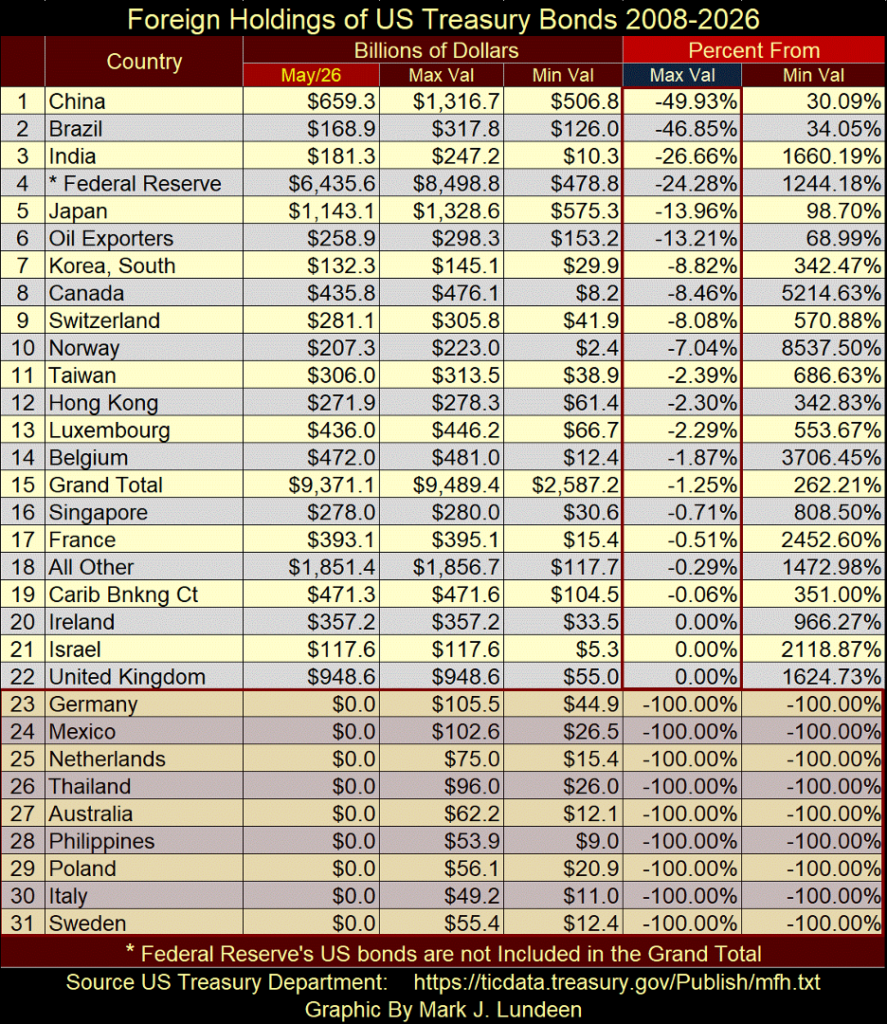
Above, from #23 to #31, are line items the US Treasury no longer documents their T-bond positions. Did they sell all of their T-bonds? Maybe, but I doubt that.
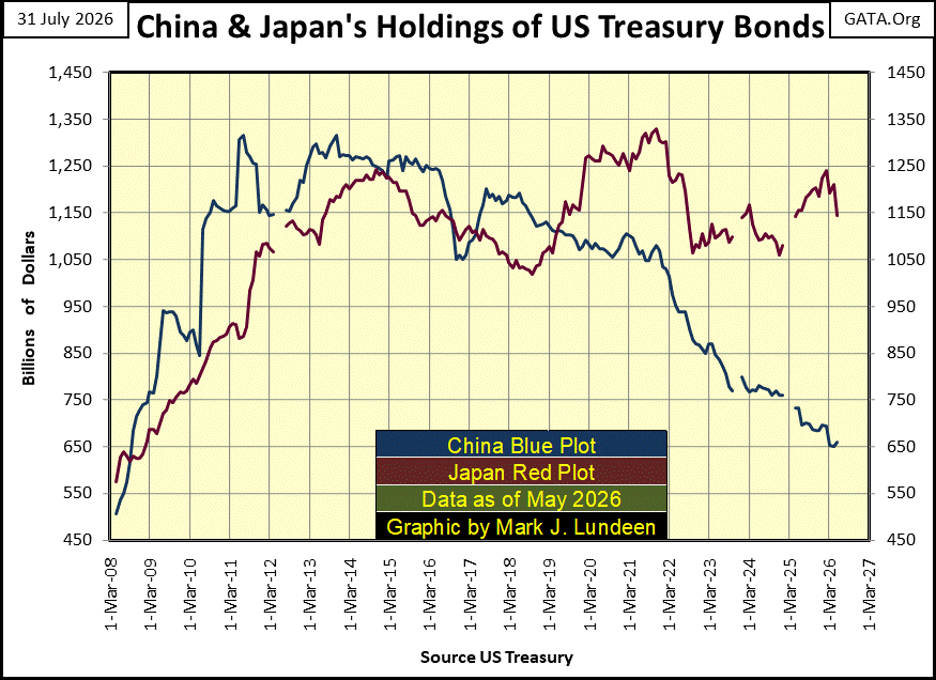
The table above is nice to see the big-picture of who is holding Uncle Sam’s IOUs. But a chart plotting the monthly changes in T-bond holdings, for China (Blue Plot) and Japan (Red Plot) below is good to see too.
I began this data series in May 2008, just as the sub-prime mortgage debacle began picking up steam. It was in March 2008, that the big Wall Street bank; Bear Stearns died, gagging on its own inventory of toxic sub-prime mortgages. It was also in May 2008, that China and Japan began massive purchases of T-bonds, for the next few years. Most likely, in coordination with the idiots at the FOMC, with their QE 1-3, to “stabilize global market valuations.”
Looking at China below, it appears they are no longer interested in “stabilizing global market valuations.” From what I hear, from sources I find reliable, well King World News and Gold Eagle if you must know, China is selling T-bonds, and buying gold, by the ton. And every ton of gold China, and other central banks buy, is one ton not available to retail investors wanting to buy gold by the ounce.
Gold, silver too, available for retail sale, have never been so sparsely available for the general population. Any pickup in retail demand, will have a dramatic effect on the price of gold and silver.
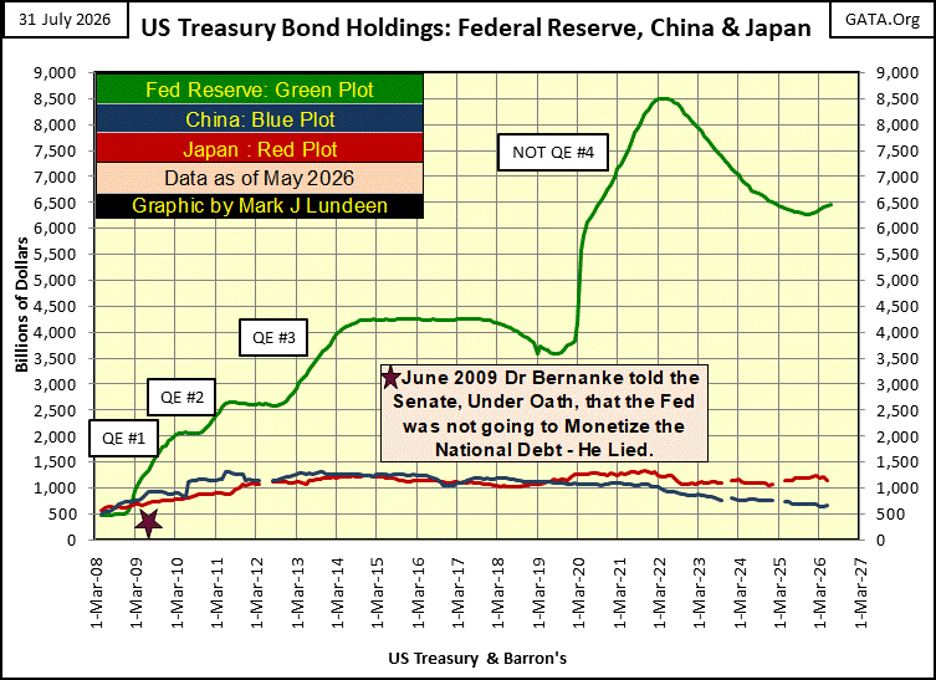
The next chart plots the T-bond holdings of the Federal Reserve, along with the data seen above for China and Japan.
The first data point in my Excel file for this data is May 2008. When the total holdings of Treasury Debt for China and Japan, were larger than the T-bond position held by the Federal Reserve;
• Japan / 575.3 billion,
• China / 506.8 billion,
• FOMC / 478.8 billion.
But May 2008 was before the global financial system needed its market valuations “stabilized,” due to the sub-prime mortgage debacle. As seen below, no one, and I mean no one, can “stabilize market valuations” like the idiots at the FOMC! When they begin “injecting liquidity” into the financial system, with their QEs, I have to stand back, and look in wonder at what they do.
Considering the data seen above, I believe bond yields in the next few years will continue trending higher. That is not good for the stock market, as seen in its major-market indexes seen below. Truth be told, so far rising bond yields of these past six years, haven’t been bad for these stock indexes seen below.
This week, table below, we saw some new all-time highs (BEV Zeros) on Monday and Tuesday. On Friday’s close, thirteen indexes closed the week in scoring position. All and all, the current stock market advance seems intact. That is how it will be, until these indexes deflate to BEV values below -5% & -10%.
It would be reassuring to see the big NASDAQ indexes BEVs; its Composite & 100 indexes, once again rise to something above -5%; back into scoring position. The NASDAQ 100 Index (#16) closed Wednesday with a BEV of -11.31%. That isn’t a good thing to see; that the NASDAQ 100 can’t get above its BEV -5% line, but can break below its BEV -10% line.
And the NASDAQ 100 is an important index. Maybe the most important index seen in the table below. Below is a link listing the companies in the NASDAQ 100. The top one hundred companies listed on the NASDAQ, have a combined market cap of $39.8 trillion dollars. Should the NASDAQ 100 index below close below its BEV -25% line, a 25% reduction from its last all-time high, is a loss of market cap of about ten trillion dollars. That would hurt many people.
https://stockanalysis.com/list/nasdaq-100-stocks
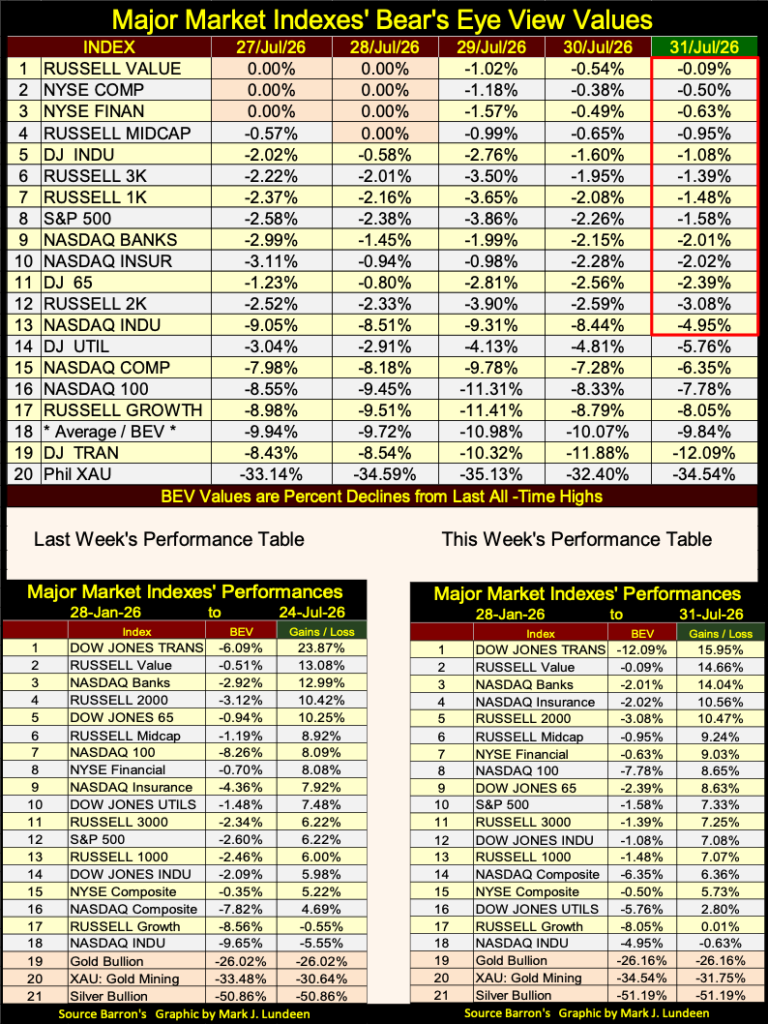
The big loser for the week was the Dow Jones Transports, #1 in the performance table above. It went from a BEV of -6.09% from last week, to -12.09% at this week’s close. I wonder what that was about?
Some of the idiots at the FOMC want to raise their Fed Funds Rate, to “fight inflation,” as per the CNBC.Com article below.
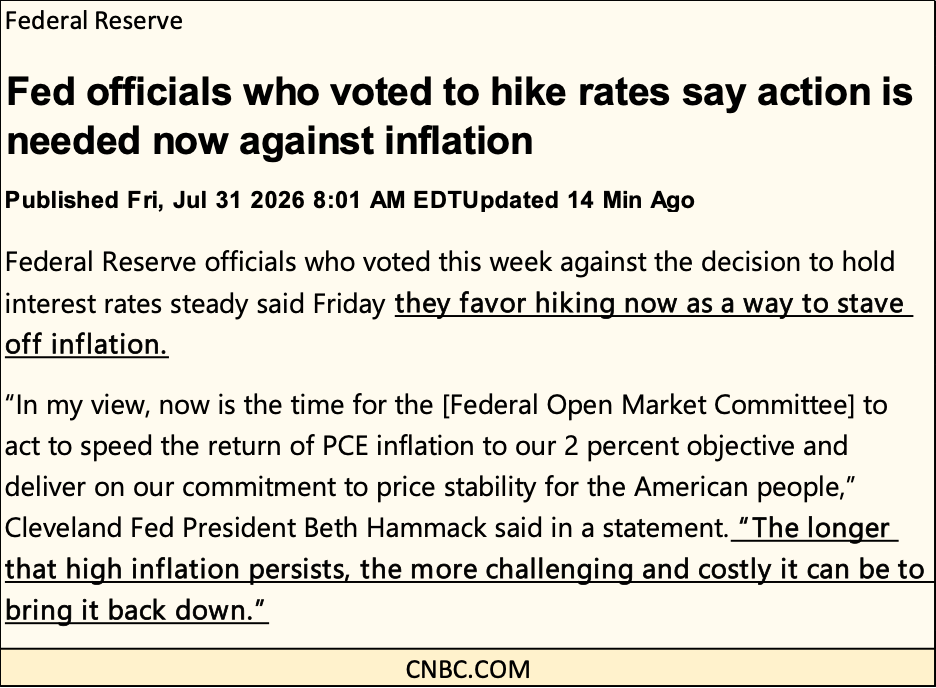
Fed officials who voted to hike rates say action is needed now against inflation
Ever wondered why raising interest rates quells “inflation?”
Actual monetary inflation; the “liquidity” flowing from the FOMC is an economic stimulant. These dollars-of-inflation create demand for good & services in the economy, without actually increasing the supply of anything, other than a debt burden that must be carried by the economy. When demand increases, without a corresponding increase in supply, prices rise, which * THEY * confuse their inflation, with rising prices.
To stop this “inflation,” * THEY * need to quell demand in the economy. By raising interest rates, the FOMC creates an economic recession, which results in rising unemployment. The unemployed, lose their ability to buy things for sale in the economy, thus lowering demand, and “inflation” in the economy. It’s so simple, even an idiot could do this!
I call them idiots, in a good-natured way. But these “idiots at the FOMC” are actually very brilliant people, much smarter than me. I’ll tell you the truth, it would never occur to me to control “inflation,” by driving people living from paycheck to paycheck, into the unemployment line. But then, I’m not a “policy maker.”
So, what have these idiots, these “policy makers” been doing for the past 90 years? The details are seen in the table below. So far in 2026, they have “monetized” six times the entire US national debt of 1981. That is how idiots make “monetary policy.” Did you hear Elon Musk is now a trillionaire? Exactly how that happened, can be seen below.
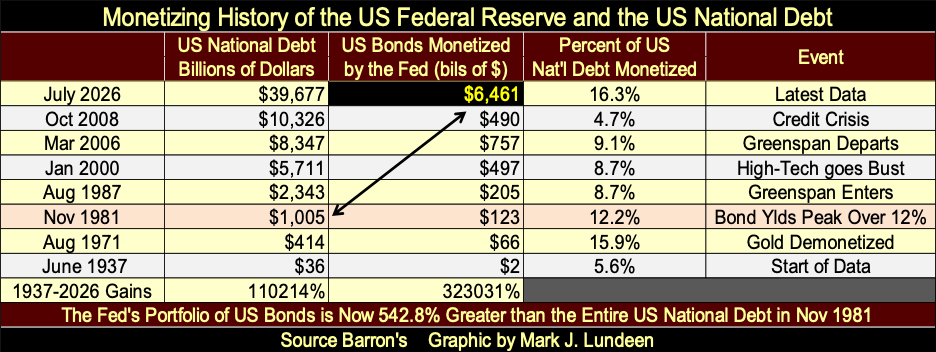
What is seen above is not sustainable, and must be a major reason why so many countries are now selling their T-bonds. Rising bond yields in the coming years? If you understand what is seen in the tables and charts above, bond yields will have to rise, as bond prices continue deflating. That will be good for the old monetary metals, and the mining companies that bring new supply of gold and silver to market.
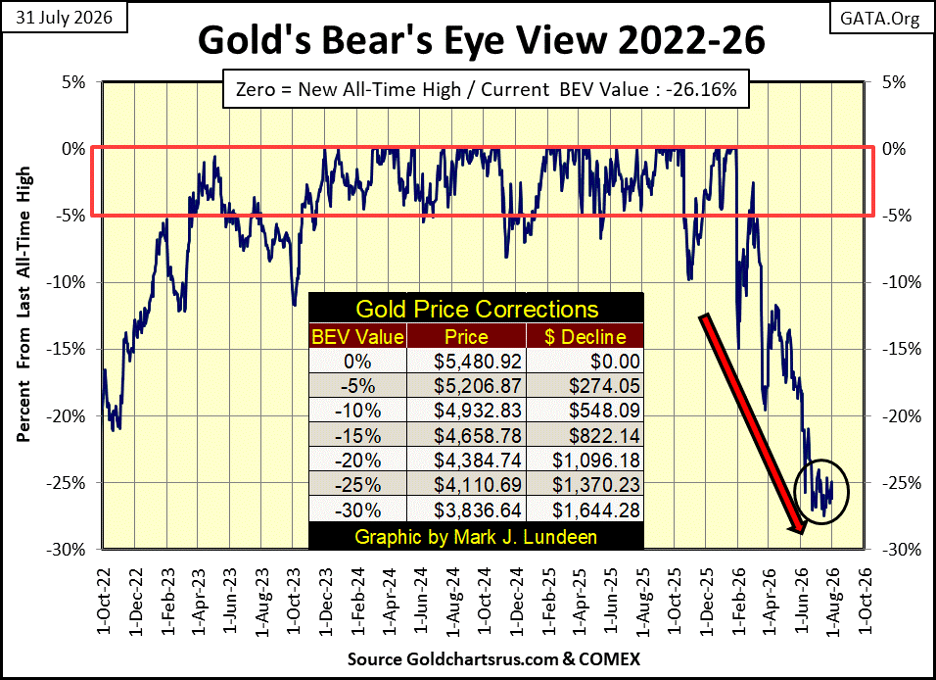
It’s time to look at gold’s BEV chart below. On June 10th, gold broke below its BEV -25% line. Since then, it has been happy trading inside the black circle, not making an effort to break below to its BEV -30% line, or above its BEV -20% line.
This situation won’t last forever. We may not be at gold’s ultimate lows for this correction, but I believe we are very close to it. Can gold break below its BEV -30% line? As seen in the table on the chart, that would be a close below $3836. With gold closing this week at $4,047, that seems unlikely, but not impossible.
I think the next big thing for gold in its BEV chart below, is for it to close above its BEV -20% line, $4,384, an advance of 8.3% from this week’s close. Gold may see some excitement following a close above $4,384.
At some point in the coming bull market in gold and silver, the advances in the old monetary metals will become explosive. When the precious metals market realizes the mismatch between the volume of dollars available to buy gold and silver, and the actual supply of gold and silver available for those dollars to purchase.
As seen above, where the world is currently disgorging itself of US Treasury debt, the day is coming when global desire for something rare and precious will become overwhelming. What the dollar price of gold and silver will be then is unknowable. Before that happens, investors need to buy some gold and silver.
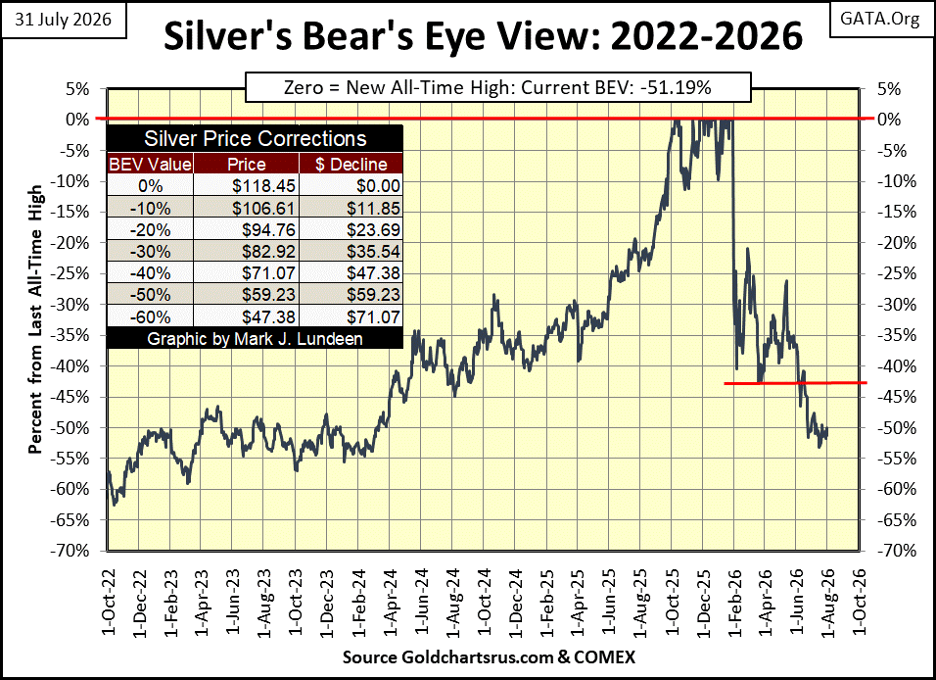
Here is silver’s BEV chart. Geeze Louise, silver closed the week with a BEV of -51.19%, or half the price at its last all-time high in January. Keep in mind, 40% of this 51.19% decline, happened only six days following silver’s last all-time high. So, it took an additional six months for silver’s BEV to decline to -51.19%.
This just doesn’t pass the smell test.
Okay, so what about it? Like gold, I believe silver is near its lows of this correction. What’s the next big move in silver? Will silver next close below its BEV -55% line, or above its BEV -45% line? I’m thinking silver will next close above its BEV -45% line. Exactly when, I can’t say, as I don’t know.
For gold in its step sum table below, finally, gold is beginning to see more daily advances than daily declines. Its 15-count closed the week with a +3. That is good, one daily decline along with two daily advances. A running daily 15-count of +5 would be better. What about a 15-count of +7? Now you’re getting greedy. Anyway, a 15-count of +7 is an overbought market, and markets don’t like being overbought.
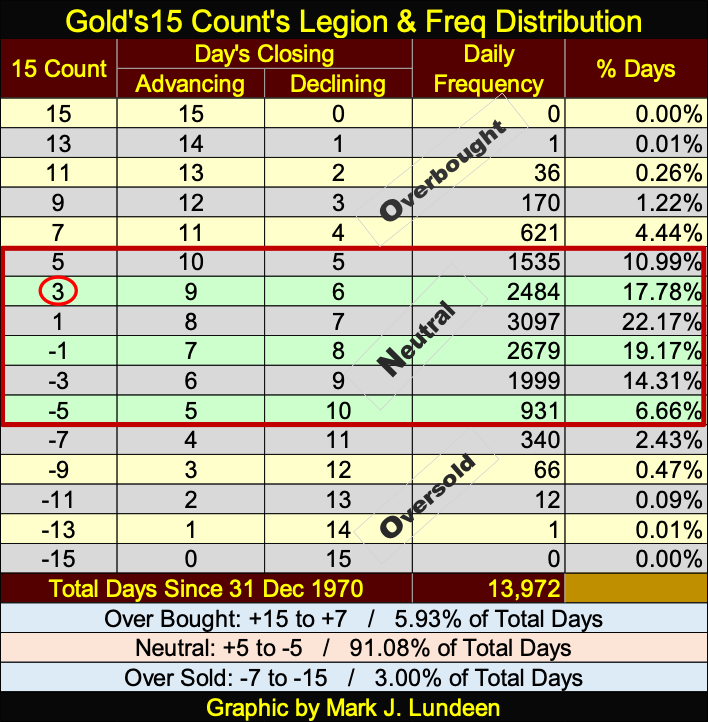
Anyway, things are looking up for gold in its step sum table below. All we need now, is for the price of gold to begin trending back up towards a new all-time high.
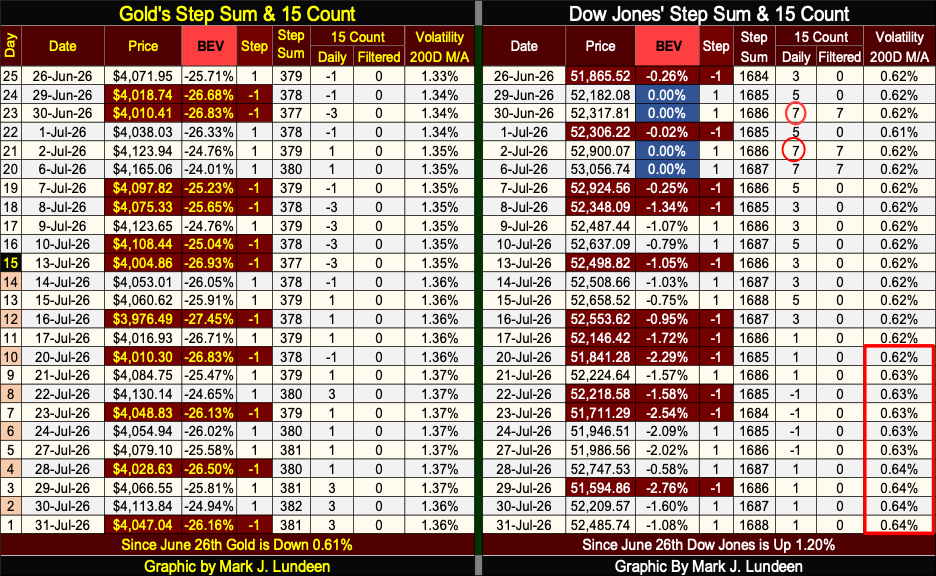
The Dow Jones in its step sum table continues looking positive. Daily declines are increasing, as seen in the Dow Jones 15-count. But those daily declines haven’t deflated the Dow Jones valuation in any meaningful way. Not when it closed the week with a BEV of -1.08%.
One thing I note above, Dow Jones daily volatility’s 200D M/A is beginning to trend upwards, closing the week with a 0.64%. This is nothing to panic about. However, should the Dow Jones begin to see a big increase in the frequency of its dreaded 2% days, as always happens in a bear market, this metric of daily volatility can rocket to, and then above 1.00%, amazing fast.
But that isn’t happening at this week’s close. So, I’m still game for the Dow Jones at 60,000 by Christmas, or sheading my crocodile tears by October, whatever the unknown future may bring my way.
Since the 1990s, when the Clinton Mis-Administration was playing “Hide the Salami” in the Oval Office with interns, the Islamic Revolutionary Guard Corps (IRGC) has been purchasing centrifuges for uranium enrichment. Who would sell the IRGC these centrifuges? It was an evil thing to do, and obviously, someone did it. Exactly who did this is another thing, we’ll not learn by watching the fake news media.
Every president for decades has drawn the line in the sand for Iran; No Nukes! But it was all talk, no action. Iran knew exactly who they were dealing with, until they had to deal with President Trump. After decades of tough talk coming from Washington, finally someone is in the White House willing to do something about a Nuclear Iran.
I’m glad we finally have a president who is willing to do what is right – stop the IRGC’s nuclear ambitions, no matter the cost.
People are complaining about rising energy prices. Here is something to consider; it takes only one nuke, detonated fifty miles above America’s East Coast, creating a massive electromagnetic pulse (EMP) to blow up the East Coast’s electrical grid, sending much of the United States and Canada back to the stone age. Possibly from Miami Florida, to Toronto, Ontario in Canada.
That could be a blow the United States might never recover from. God Bless Donald Trump; the American President who really does looks out for America.
__
(Featured image by Dimitri Karastelev via Unsplash)
DISCLAIMER: This article was written by a third party contributor and does not reflect the opinion of Born2Invest, its management, staff or its associates. Please review our disclaimer for more information.
This article may include forward-looking statements. These forward-looking statements generally are identified by the words “believe,” “project,” “estimate,” “become,” “plan,” “will,” and similar expressions, including with regards to potential earnings in the Empire Flippers affiliate program. These forward-looking statements involve known and unknown risks as well as uncertainties, including those discussed in the following cautionary statements and elsewhere in this article and on this site. Although the Company may believe that its expectations are based on reasonable assumptions, the actual results that the Company may achieve may differ materially from any forward-looking statements, which reflect the opinions of the management of the Company only as of the date hereof. Additionally, please make sure to read these important disclosures.














Dow Jones Holds Strong, Signaling Potential for New Highs
Since July 6, the Dow Jones has stayed above its BEV -5% line, signaling bullish momentum and likely new highs....


Morocco’s Budget Execution June 2026: Deficit Narrows to 20.2 MMDH
Morocco’s Finance Law execution at end-June 2026 shows a reduced budget deficit of 20.2 billion dirhams, down from 24.9 billion...


Tilray Brands Hits Multi-Year Lows as Cannabis Investors Await Regulatory Clarity
Tilray Brands shares have fallen 57% this year amid cannabis sector weakness and uncertainty over US regulatory reform. While potential...


Ethereum Between ETF Inflows, Price Risks and a Strong July
Ethereum faces mixed signals as ETF inflows and a strong July performance support recovery, while technical resistance and downside risks...


Mercedes-Benz Accelerates EV Decarbonization With Recycled Aluminum
Mercedes-Benz expands its partnership with Hydro to accelerate supply chain decarbonization. Future electric vehicles will use Hydro CIRCAL aluminum containing...
 |
|
 |  |
 |
|
-

 Africa2 weeks ago
PAASIFEJ: Results-Based Financing Driving Inclusive and Sustainable Rural Growth in Morocco
-
 Cannabis3 days ago
Tilray Brands Hits Multi-Year Lows as Cannabis Investors Await Regulatory Clarity
-

 Fintech1 week ago
Blockchain Evolves Toward AI, Finance and Quantum Security
-

 Impact Investing5 days ago
TotalEnergies Challenges Landmark Climate Ruling and Disputes Customer Liability for Emissions