Business
What is driving the real estate bubble now?
Since the housing market has a minimum purchasing power, properties are left to inventory leading to a larger real estate bubble.

This latest real estate bubble looks just like the last one. It has surged about the same—this time peaking a little higher—and has run for about as long.
But what’s driving this bubble is totally different than what drove the last one.
The first bubble was thanks to Baby Boomers flooding the market as they surged through their peak home-buying years in unprecedented numbers. They were helped along with the most liberal lending standards in history. Remember the days of subprime, variable rates, and NINJA loans?
It was quite simply a case of excess demand outstripping even strong, rising supply. Both drove prices to extremes that few can afford.
Eventually, defaults on those insane loans overwhelmed the market, sending the whole house of cards tumbling.
This time around, the situation is the opposite.
Supply (rather than demand) is driving this bubble. Baby boomers have long since passed their peak home-buying cycle and millennials don’t have the job and income growth the boomers had. Besides, they’re more gun-shy after witnessing the largest real estate losses in more than a century, when housing collapsed between 2006 and 2012. Oh, and they’re facing tighter lending standards and the burden of student loans.
You would never suspect we are in a bubble looking at this chart.
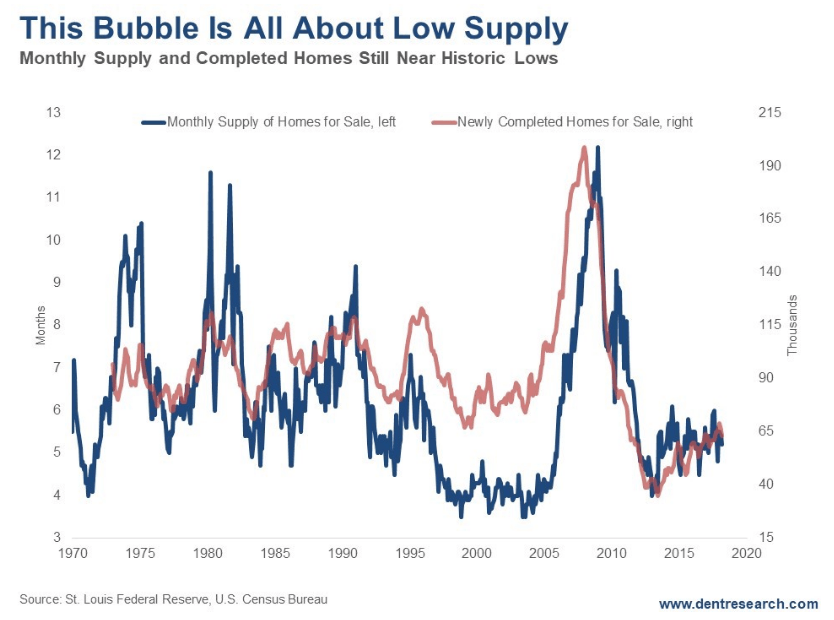
Back in 2008, both new-home completions and months-supply-in-inventory were at all-time highs, and demand still outstripped supply.
Builders were solidly behind that bubble, but on a lag, even after sales peaked in late 2005 and prices started to fall after early 2006.
New homes completed peaked at 199,000 a month in June 2008. Inventory peaked at just over 14-month’s supply just before that.
When the bubble finally burst, new homes fell to 35,000 in 2013 and inventory fell to just under four months’ worth. That was an 82.4 percent fall in home completions and a 73 percent fall in months’ supply—the highest on record.
Home prices dropped on average 34 percent while houses in the bubbliest areas lost more than 50 percent of their value. The Great Depression only saw 26 percent declines on average.
But, like I said: this time it’s not demand driving the bubble, but supply.
Homeowners aren’t selling. Baby Boomers are holding onto the homes they bought into the last cycle as people do until they retire or die.
And buyers are cash-strapped.
Even near the top of this bubble, inventory is around five months and new homes completed are only 65,000 a month—not that far from the record lows.
That is what’s driving higher prices!
And it’s the worst on the low-end of the market. The supply of homes under $100,000 is 21 percent lower than a year ago. For homes under $250,000, it’s 8 percent lower.
The median new-home price now averages $326,888 compared to the overall median home-price of $250,400 for existing houses. That means more people are having to pay more than they can afford, especially those who can least afford to do so!
The trends are clearly showing, this time, that high-end real estate is starting to collapse first: from Manhattan to Toronto to London to Singapore. That may be the catalyst for the property burst I’m forecasting.
The rich will be hit the worst in the end, the poor will be the first to default!
This is the second and final real estate bubble we’ll see for some time. And it’s very likely to end up with losses closer to 50 percent on average.
This is definitely NOT the time to buy. Rather, it’s an excellent time to sell and then rent until the worst of this collapse is over! Especially on the high-end.
—
DISCLAIMER: This article expresses my own ideas and opinions. Any information I have shared are from sources that I believe to be reliable and accurate. I did not receive any financial compensation for writing this post, nor do I own any shares in any company I’ve mentioned. I encourage any reader to do their own diligent research first before making any investment decisions.


Bitcoin Stalls Near $60K as Strategy Moves, ETFs Outflow, and EU MiCA Rules Take Effect
Bitcoin hovers near $60,000 with ETF outflows, while Strategy boosts reserves, sells BTC, and raises dividends to reassure investors. Ethereum...


Cannabis Dominates Global Drug Use: Trends, Risks, and Shifting Markets
Cannabis remains the world’s most widely used illicit drug, with 256 million users in 2024, surpassing all others combined. Growth...


Italy Approves First Hydrogen-Powered Train for National Rail Network
ANSFISA has approved Italy’s first hydrogen-powered train, the Alstom HMU214, for use on the Brescia–Iseo–Edolo line. Capable of 140 km/h,...


Cotton Market Weakness Persists Despite Brief Rebound
Cotton prices fell to new lows last week before a modest rebound. USDA data shows crop conditions remain worse than...


Eli Lilly Hits $1 Trillion Valuation Amid Strong Bullish Momentum
Eli Lilly stock hit a record high, surpassing $1 trillion market value after strong product demand. Shares surged over 7%,...
 |
|
 |  |
 |
|
-

 Impact Investing2 weeks ago
SBTi Net-Zero Standard 2.0 Enhances Corporate Climate Action
-

 Crypto5 days ago
Bitcoin and Ethereum Slide as Market Pressure Builds Amid Strategy Concerns and Layer 2 Disruptions
-

 Business2 weeks ago
Fed Policy Shift Raises Concerns Over Debt and Inflation Risks
-
 Crypto20 hours ago
Bitcoin Stalls Near $60K as Strategy Moves, ETFs Outflow, and EU MiCA Rules Take Effect
You must be logged in to post a comment Login