Featured
The debt is ticking in the background like a bomb ready to explode
If someone in 2019 had said 2020 will be like this, they’d have thought you were delusional, super pessimistic, or a perma bear. Instead, here we are. But there is one thing that has shone. Gold. When in times of trouble, deflationary or inflationary conditions, geopolitical uncertainty, domestic political uncertainty, or currency devaluation gold holds its value.
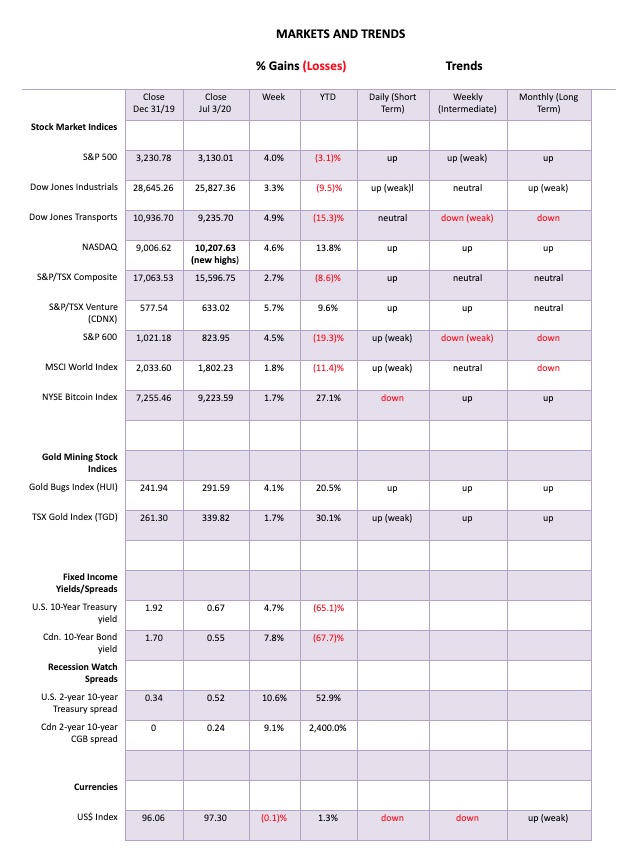
It has been quite a half-year. One for the books. We have had a pandemic, a depression, and protests/riots on the streets or, as we say, 1918, 1929, and 1968 all rolled into one. And the year is only half over. After recording one of the swiftest declines ever seen in March, the second quarter brought us the best Dow Jones Industrials (DJI) quarter since 1987. For the NASDAQ, it was the best quarter since 1999. The DJI gained 17.8% in Q2 2020 vs. a gain of 21.6% in Q1 1987. The TSX Composite gained almost 16% in the quarter, the best performance in over a decade. But to keep things in perspective, the DJI is still down 10.6% on the year to June 30 and the TSX down 9.1%.
As to the pandemic, well, there are now over 11 million cases and over 500,000 deaths. At current rates we could have upwards of 45 million cases and 1.3 million deaths by year end. While there have been positive signs with many places seeing a decrease in the number of cases (EU, Canada, North Eastern U.S.), there have also been sharp rises in the Southern U.S., South Asia, and Latin America. Overall, the numbers have gone up, not down. But that could change if the numbers started to dramatically rise in major population centers like China, India and Africa.
Few have got things under control as they did in Taiwan and South Korea. Taiwan, a country of almost 24 million people, on an island, and one of the most densely populated countries in the world has had fewer than 500 cases and only 7 deaths. That has been thanks to laws, policies, and institutions that were put in place years ago. They were empowered to act quickly in the event of a pandemic with contact tracing, masks, temperature taking, quarantines, and travel bans. Plus, this is an island used to adversity because of its proximity to China and the lingering effects of a long civil war (1927–1950) whereby China still claims Taiwan as a part of China and vice-versa.
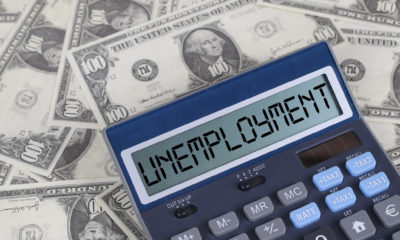
And now comes the threat of another pandemic or at least a mutation of the current pandemic? Another pathogen with the potential to turn into a pandemic is waiting in the wings according to researchers. Dr. Anthony Fauci, the U.S.’s top infectious disease expert, has warned that the U.S. could see 100,000 cases in a day if they don’t change their behaviour. This past week they saw over 50,000 new cases in almost every day. That works out to about 35 new cases every minute. Dr. Fauci has been largely sidelined by the Trump administration in their desire to open up. Except that states that did open up in May are now being forced to shut down again because of a huge jump in the number of cases. As a response, protests and lawsuits have sprung up, challenging the government’s orders. In an economy already reeling from the first shutdown and an estimated 45 million unemployed, a second shutdown could prove deadly. Pick your poison: dead economy or just dead.
Already they are declaring that not only is the recession over but the depression is over too. Is it really? During March and April non-farm payrolls as reported by the Bureau of Labour Statistics (BLS) saw 22.16 million workers lose their jobs. Cumulative initial claims since the start of the COVID-19 in March now total 48.7 million with another 1,427 thousand added this past week. That was above the expected 1,355 thousand. Continuing claims still totaled 19,290 thousand, up from the previous week’s 19,231 thousand. Over the past two months, nonfarm payrolls have jumped 7,500,000, recouping one-third of the March and April job losses. The V recovery people are cheering that the recession is over. The unemployment rate (U3) has fallen to 11.1%, down from the April peak of 14.7%. Both the June nonfarm payrolls and the unemployment rate came in lower than expected.
It is probably easy for us to say—hold on a sec. Even using the BLS’s numbers the official unemployment rate is still higher than it was at the worst of the 2007–2009 Great Recession or any other recorded recession since the Great Depression. The BLS also freely admits to misclassification errors whereby they count people as employed who say they are currently employed but who are actually not working as they are awaiting an expected call back to their old job. But what if it doesn’t happen? If they were classified as unemployed instead, the U3 rate would have been 12.1%, not 11.1%.
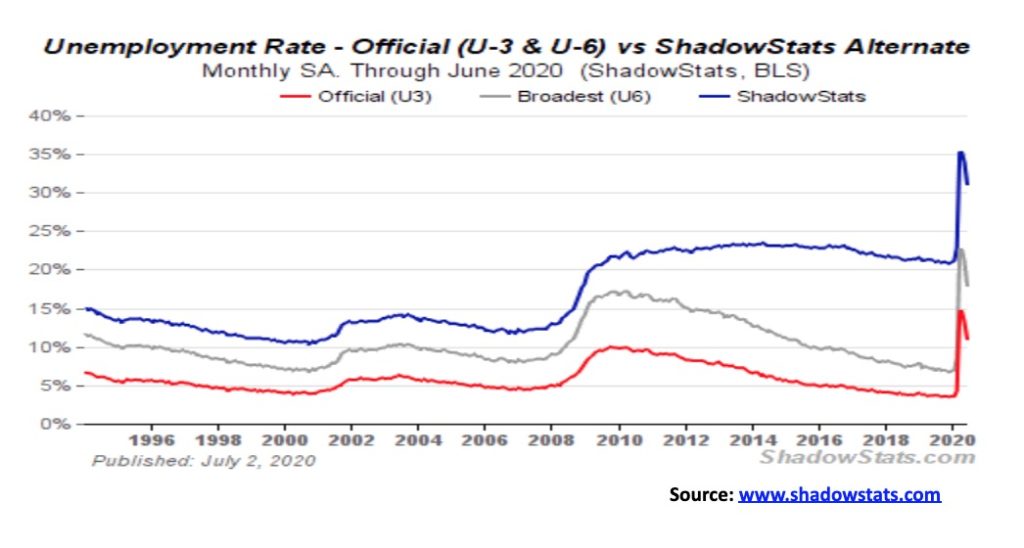
However, that is still a lot better than the 19.7% rate reported with misclassifications for the April report. The U6 unemployment which is the BLS’s highest unemployment category was reported as 18.0% down from 21.2%. U6 unemployment is U3 plus short-term discouraged workers and involuntary part-time workers. The Shadow Stats unemployment rate which is U6 unemployment plus discouraged workers classified as not in the labour force and defined away in 1994 fell to 31.2% from 34.0%.
The unemployment rate was falling because people were called back to work as stores and restaurants and bars opened. Of the total, 2.1 million workers were in the leisure and hospitality industry. Some factories also came back online. There are other faults in the report. The survey only covered up to about the middle of June. So, it has not taken into consideration the surge in COVID-19 cases since then (U.S. recorded over 50,000 cases on July 1, 2020 and over 57,000 cases on July 2, followed by another 55,000 on July 3) nor has it taken into consideration that after opening up, Texas and Florida (to name two states) were ordered to shut down once again. If correct, we’d expect a surge in initial claims next week and the July employment report (due out August 7, 2020) could once again show a surge in job losses.
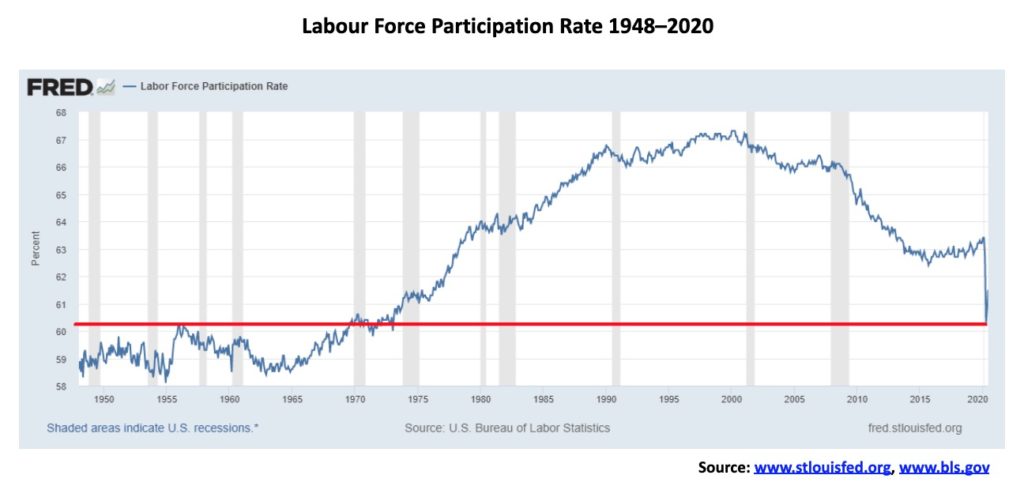
Some other areas have to be seen as problematic as well. One is the labour force participation rate. That did rise slightly in June to 61.5%, up from 60.8%. That is well down from the 63.3% reported in January 2020 and nowhere near the all-time high of 67.3% reported in January 2000. Higher labour force participation rates translate into higher unemployment, all other things being equal. The current labour force participation rate is back at levels last seen in the early 1970s before a surge of women came into the labour force. The current labour force participation rate for women is 56.1%, a level last seen in the mid-1980s. For men, the rate is 67.2% which puts it just up from the all-time low of 66.1% seen in April. The rate for men has been falling steadily since 1950. In January 1948 the rate was 86.7%. For the record, Canada’s labour force participation rate is 61.4%, down from its pre-COVID-19 level of 65.5%. Canada reports its June employment numbers next Friday July 10, 2020. The bottom line is, fewer are participating in the economy. That translates into a lower unemployment rate. So, what happened to the rest?
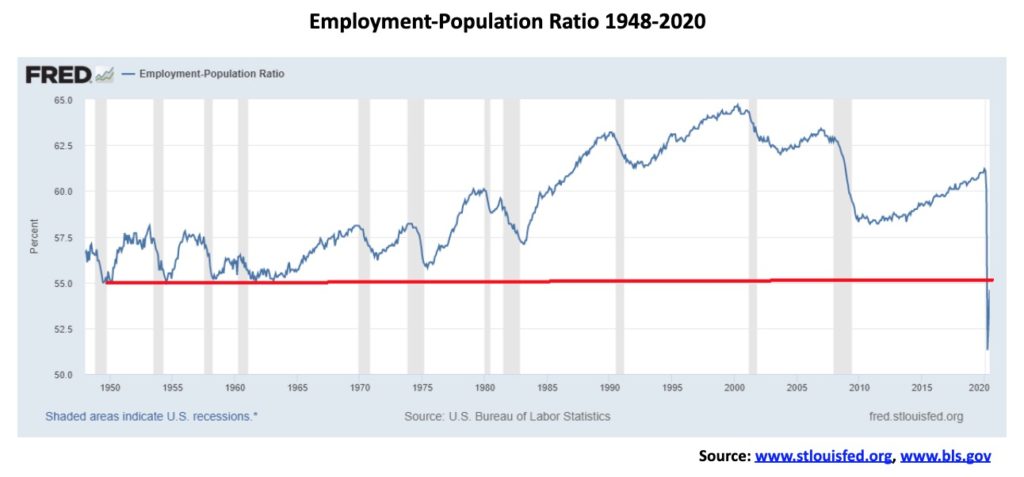
Another number that is concerning is the employment-population ratio. This is a measurement of the number of people actually working vs. the total working age population. This ratio was reported as 54.6% in June, up from May’s 52.8% and up from the record low seen in April at 51.3%. What that says is that over 45% of the working age population is not working. It has never been this low, not even during the 1950s and 1960s, again before women entered the labour force in large numbers into the 1970s and 1980s. The peak was 64.7% seen in April 2000. It has been a long decline. In January 2020 the ratio was 61.2%. It has been estimated the U.S. would have to create upwards of 30 million jobs to bring it back to that level. So, what is everyone doing? Not all are in school full time, nor are they full-time caregivers.
There are 102.3 million reported as not in labour force. Back in January 2020 that number was 94.9 million. There are 54.9 million retirees and 9.9 million on disability and presumably not working nor looking for work. As well, full-time students and those acting as family caregivers would not be counted as a part of the labour force. Still, there are reported to be at least 5.7 million who would like to work but are discouraged or have been out of work for over a year and therefore not counted any longer. The result of all of this is that they report 21.5 million as unemployed, but the actual unemployed is more like 33.3 million and the reality is could even be higher. Interesting that 36 million people (11% of the population including children) are considered to be living in poverty while 28.3 million have no medical insurance and 35.9 million are on food stamps. That’s almost double the number of millionaires in the U.S. No wonder they have a Gini coefficient of 50%, as disparity of wealth and income in the U.S. fits more with Latin American countries and a number of African countries. Canada’s Gini coefficient was 32.4% in 2019. The U.S.’s Gini coefficient is the highest of all the OECD countries.
The protests, riots, and unrest currently seen in the U.S. are possibly without precedence. And the U.S. has a long history of violent civil strife. The trigger was the alleged assault causing death/murder of George Floyd. But the tensions were already there with a deeply polarized population, the massive rise in unemployment due to the COVID-19, the huge wealth and income inequality, and failure to adequately deal with pervasive racism and police brutality. The polarization covers numerous issues including politics, LGBQT rights, racism, abortion, gun rights, war, women’s rights, religion, globalization, and more. Protests and riots vary but have flared to date in some 400 U.S. cities and all 50 U.S. states. As well, protests have flared in a number of other countries. Protests, riots, looting, vandalism, and deaths have occurred. Accusations have been leveled at both alt-left groups such as Antifa and alt-right groups such as various white nationalist groups, and heavily armed militia members. The picture of riot-clad police vs. protestors has become a staple in American cities along with clashes between both alt-left and alt-right groups. Some are describing it as a new U.S. civil war. The grievances of a long-ago American Civil War (1860–1865) have, it seems, never gone away.
With an election coming on November 3, 2020 there is a real danger that the violence could get worse. Many political pundits are already noting that the election could end in law suits and violence with both sides claiming victory. There is little in the way of middle ground and neutrality is appearing to be less and less of an option. A contested election decision accompanied by violence could tear the U.S. apart and could trigger a real civil war. So far, the protests and the violence on the streets don’t appear to be impacting the stock market. But that could change. The risk is there.
And then there is the debt. Yes, the government debt both in the U.S. and in Canada and elsewhere is exploding as a result of the COVID-19. But with central bank purchases, they are effectively monetizing the debt. The real danger is the corporate bond market, household debt, and thousands of small businesses closing their doors or going bankrupt because of the shutdowns. Yes, the U.S. corporate bond market raised over $1 trillion in the first half of the year, but a lot of that is premised on the Fed continuing to make bond purchases and a continuance of exceptionally record low interest rates. Given the largest category of corporate debt is BBB-rated (upwards of 60%) which is the lowest investment grade, many are being downgraded to junk. Who will buy their debt? Many companies are becoming zombie companies, meaning they are really bankrupt but because of QE and other government lifelines they are being kept artificially alive.
U.S. nonfinancial corporate debt (Q1 total – $10.5 trillion, but add in the debt of small/medium sized business, family businesses, and others and the total is almost $16.0 trillion or a debt to GDP ratio of 74%) has exploded over the past few years. It is up $4.4 trillion since a trough was seen in Q4 2010. It has grown from 38% of GDP to over 55% of GDP during that period. But that debt is only a part of it. Add in financial debt plus other business debt and the total comes to $29.7 trillion for a debt to GDP ratio of 148%. U.S. government debt to GDP is 132% and household debt to GDP is 102%.
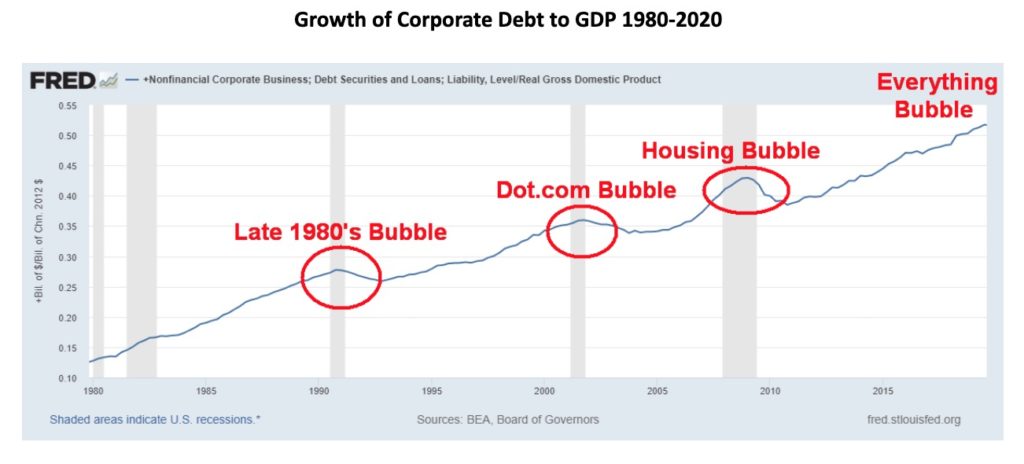
Canada is doing no better. And the debt bomb is becoming noticed by the mainstream press witness an article in the Toronto Star business section on Saturday, July 4, 2020, titled There’s a corporate debt bomb ticking under possible recovery – https://www.thestar.com/business/2020/07/04/how-canadas-corporate-debt-bomb-is-undermining-the-recovery-from-covid-19.html. Canada’s corporations have $2.7 trillion of debt or 118% of GDP, up from 85% in 2008. That rate is actually higher than the U.S. without counting the U.S.’s financial corporation debt. It is the third-highest debt to GDP ratio of the G20 countries exceeded only by China and France. And 11th highest in the world. The article notes the bankrupt Cirque de Soleil with $900 million in debt and Bombardier with $9 billion in debt. There are cries to bail out Cirque de Soleil and Bombardier is already what we would call a zombie company existing purely because of the government support. Economists may be worried about the growing government debt burdens but they are really worried about the huge corporate debt burdens.
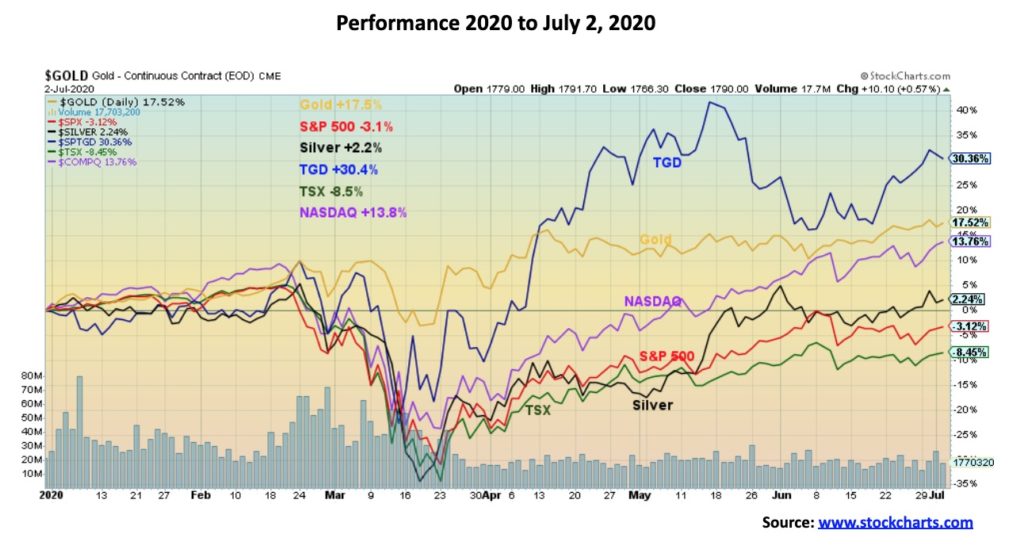
But one thing has stood out against the pandemic, the depression, the protests, and the debt. Gold has been the best-performing asset in 2020. To July 2, 2020 gold is up 17.5%. The S&P 500 is down 3.1% and the TSX Composite is down 8.5%. Gold stocks, as measured by the TSX Gold Index (TGD), have gained 30.4%. Only the NASDAQ, dominated by the FAANGs and Microsoft, can claim a victory as it is up 13.8% and continues to surge to new all-time highs seemingly impervious to what is going on around them.
There are now signs that the stock markets may have topped. No other index to date has joined the NASDAQ in making new all-time highs. It is a major divergence as the markets should confirm each other. But it until they break down complete with the non confirmations, there is hope held out that the other indices could follow to new all-time highs. Our breakdown points for the S&P 500 remain at 3,000 and 2,900. Only new highs could change that scenario.
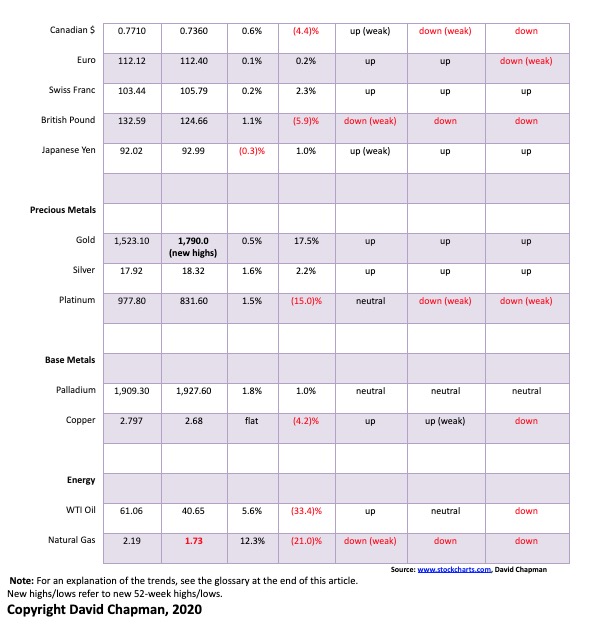
As for gold, it is now threatening to break above $1,800. But it is facing a tough fight as there are many interests that would prefer gold to remain under $1,800. While gold has printed fresh 52-week highs it has, so far, failed to fully break above $1,800. However, we note that every time it is pushed back, buying comes in that takes it back up. The suggestion is that it will eventually bust through $1,800 and target up to $1,950. But maybe the real sign of a breakthrough is the junior gold mining market where the TSX Venture Exchange (CDNX) has soared almost 90% from its March lows. We have noted many doubles already in junior gold mining stocks. This is a small market that, once the speculators decide they have to get in it, could cause the CDNX and many gold miners to double again. The last time there was a bit of rush in the junior gold miners was 2016 and before that the 2009–2011 bull market. So, its return is healthy sign. But a reminder that the markets can be volatile and an unexpected correction can set in at any time especially if the market becomes too frothy.
From a market watcher viewpoint, it has already been a fascinating year, one for the history books. And the year is only half over and the pandemic, the depression, and the protests are all sure to continue. And dare we mention once again—is the Fed taking away the punch bowl? This past week Fed assets fell another $73 billion. Since peaking on June 10, 2020 Fed assets are down $160 billion. Interesting. The stock market topped June 8. The big gap down occurred on June 11. Since then only the NASDAQ has made new all-time highs. None of the other indices have been able to successfully fill the gap left on June 11. A reckoning is coming.
—
(Featured image by Markus Spiske via Pexels)
DISCLAIMER: This article was written by a third party contributor and does not reflect the opinion of Born2Invest, its management, staff or its associates. Please review our disclaimer for more information.
This article may include forward-looking statements. These forward-looking statements generally are identified by the words “believe,” “project,” “estimate,” “become,” “plan,” “will,” and similar expressions. These forward-looking statements involve known and unknown risks as well as uncertainties, including those discussed in the following cautionary statements and elsewhere in this article and on this site. Although the Company may believe that its expectations are based on reasonable assumptions, the actual results that the Company may achieve may differ materially from any forward-looking statements, which reflect the opinions of the management of the Company only as of the date hereof. Additionally, please make sure to read these important disclosures.


Terre et Lac Launches Crowdfunding for a Photovoltaic Power Plant
Terre et Lac, a Lyon-based company, launches a crowdfunding campaign for a solar plant in Voreppe. Residents of Isère and...


Qonto, Ledger, and Younited Credit, Leading Trio of the French Fintech Ecosystem
Qonto emerges as the top fintech in the latest rankings after its successful Series D funding. The 2024 Fintech 100...


Cannabis Clubs: Germany Introduces Strict Regulations
Germany introduces new regulations aimed at tightening control over cannabis clubs, following recent reforms. The Cannabis Act (CanG) allows limited...


Merck Invests Over 300 Million Euros in a New Research Center in Germany
Merck invests over 300 million euros in a new biotech research center in Germany, part of a larger 1.5 billion...


E-commerce: Sustainability Becomes a Key Purchasing Criterion in Large Emerging Countries
The report found that 31% of consumers evaluate sustainable packaging options when shopping online, while 30% consider sustainable shipping options...
 |
|
 |  |
 |
|
-

 Biotech1 week ago
AI Will Revolutionize Mental Health, Generating 2.5 Billion in Spain
-
 Cannabis4 hours ago
Cannabis Clubs: Germany Introduces Strict Regulations
-

 Crowdfunding2 weeks ago
Opstart Buys Majority Stake in BackToWork
-

 Business7 days ago
TopRanked.io Weekly Affiliate Digest: What’s Hot in Affiliate Marketing [LVBET Partners]