Featured
Deciphering the simple moving average
Understanding how to decipher the simple moving average is now easier with these handy tips.

The first indicator most traders are introduced to is usually the Simple Moving Average (SMA), and it’s often quickly left in the background as they move on to more sophisticated indicators. But don’t let the simple part of the name fool you: there is quite a lot more to the SMA when you look under the hood.
Also, we should remember that most other indicators, such as RSI, MACD, and Ichimoku rely on forms of SMA to work. Do having a good foundation in the SMA is also necessary to take a deeper look at other indicators later.
A quick recap
The basic function of the SMA is to average the open and close over a set number of trading periods. Simple, hence the name.
For example, if you have a three SMA, it means that it averages the open and close over the previous three periods, and then gives you a point. This is why the SMA is always offset to the right; if you scroll all the way back to the beginning of the chart, you will find that the first candlesticks don’t have an average on them.

© OrbexFX
This has the practical effect of cutting out the outliers in the data set and smoothing out the “noise” of the market. The original purpose and its primary function is to help find out what the trend is. It cuts through the extra data to find the average and show the general direction of the market. That’s why you need several data points to get a useful reading out of the SMA.
Compare, for example, these two charts:
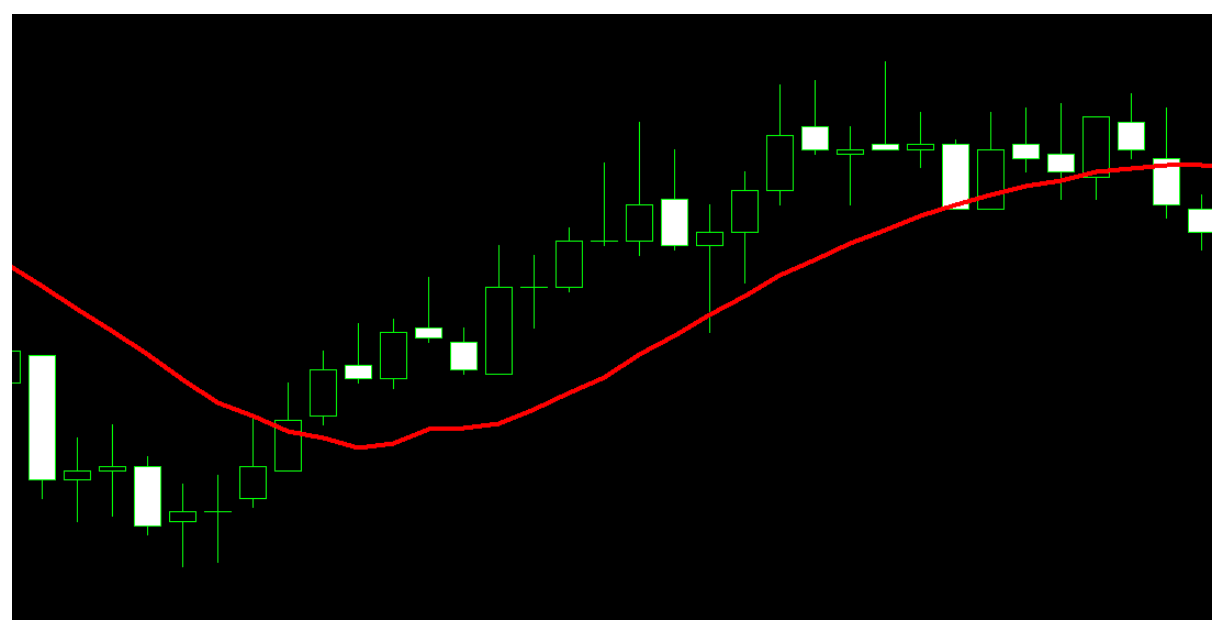
A) With a 3 SMA:
© OrbexFX
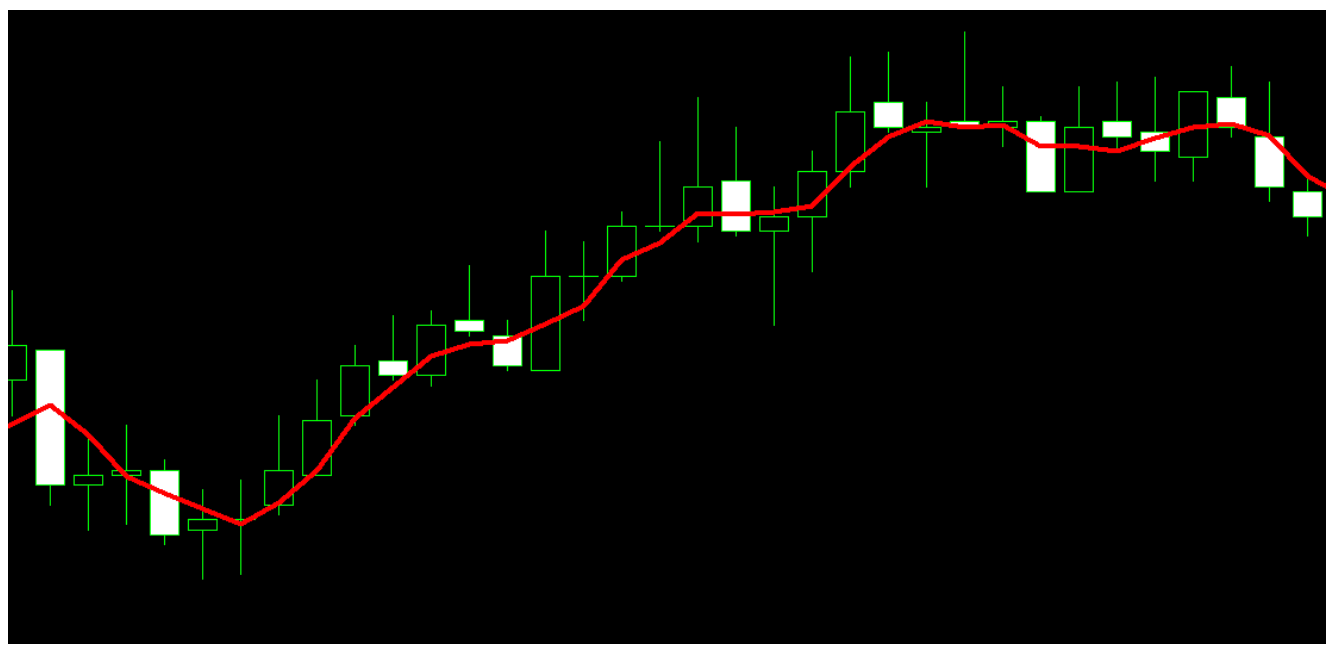
B) With a 14 SMA:
© OrbexFX
The charts cover the same data, but the second one includes more periods, and this makes the SMA “smoother” and reflective of the overall trend. In the first one, the SMA really isn’t giving us any data that we can’t see by just squinting at the chart.
Look for what’s in plain sight!
But you’ll also notice that the chart in B) shows the SMA offset to the right; that is, the SMA doesn’t turn around until after the candlesticks have changed:
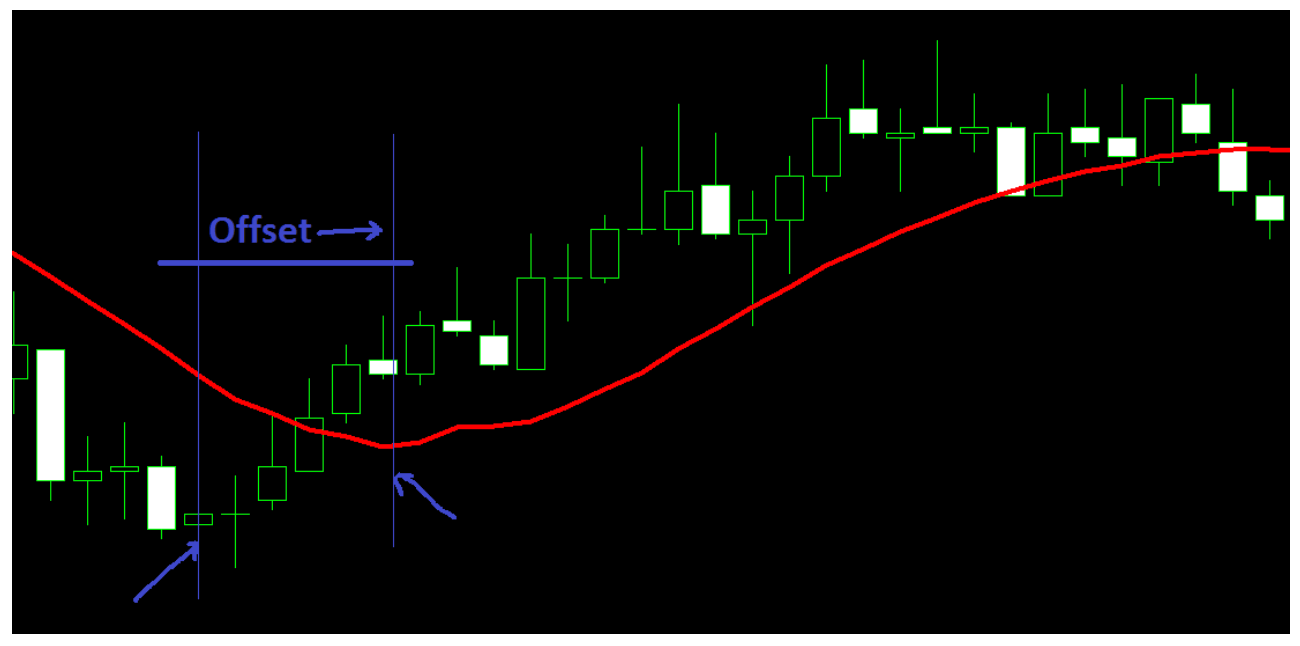
© OrbexFX
This one of the features of the SMA; and happens because each data point represents the average from the previous 14 candlesticks – consequently, it takes several candlesticks to go in the opposite direction in order to force the SMA to turn around – making the change in direction of the SMA more robust.
In that same example, the candlesticks change direction several times, sometimes even alternating. But when the SMA finally turns, the market continues to trend for several candlesticks in a row.
The bigger the SMA number, the more candlesticks – or periods – the market must go through before it breaks the trend. This is understood as the higher the SMA number, the stronger the trend it is indicating.
This is why the 200 SMA in major markets is considered an important indicator of the market’s trend and will often be reported in the mainstream media. If the market crosses the daily 200 SMA, that means the trend that has been measured for the last 200 days is faltering.
Notice something else about the chart we’re analyzing:

© OrbexFX
The circle shows where the market crosses over the SMA, and this happens before the SMA changes direction.
Because of how the math of the SMA is structured, it’s necessary for the market to cross the SMA before it turns around. Of course, this doesn’t mean that if the market closes on the other side, it will continue – but it is necessary for the market to cross the average trend line before the trend line will change direction.
This is the feature of the SMA that is exploited by a lot of other more sophisticated indicators to generate buy and sell signals.
But will get into that in the coming posts, stay tuned!
(Featured image by DepositPhotos)
—
DISCLAIMER: This article expresses my own ideas and opinions. Any information I have shared are from sources that I believe to be reliable and accurate. I did not receive any financial compensation for writing this post, nor do I own any shares in any company I’ve mentioned. I encourage any reader to do their own diligent research first before making any investment decisions.


The TopRanked.io Guide to 2026’s Biggest and Best Affiliate Opportunities
Want to earn affiliate commissions on literal billions of dollars worth of revenue? Then this week, we've got something special...


Eni Advances Energy Transition with Major Investment and Emissions Cuts
Eni showcased its “Just Transition” report in Rome, highlighting stakeholder collaboration and progress toward decarbonization goals. The company invested over...


The German Fintech Market Shows Resilience and Strong Investment Growth in 2026
Germany’s fintech sector remained resilient in 2026 despite economic crisis and rising insolvencies. Investments reached €14.2 billion, showing strong investor...


Cannabis Legalization in Germany: A Mixed Interim Assessment
Germany’s cannabis legalization has reduced criminal cases and eased pressure on the justice system, while the black market is slowly...


Sustainable Restoration of the Haus Hövener Garden in Brilon
The Brilon Construction Workers Association is restoring the Haus Hövener garden into a cultural community space, funded through a €10,000...
 |
|
 |  |
 |
|
-

 Crowdfunding2 weeks ago
Spain’s Crowdfunding Sector Surges as Real Estate and SME Financing Expand
-

 Cannabis5 days ago
Argentina Legalizes Cannabis Seed Sales Under New Regulatory Framework
-

 Fintech2 weeks ago
Zulu Powers Instant Corporate Payments Launch in Colombia
-

 Business7 days ago
Dow Jones Rally Faces Uncertainty Amid NASDAQ Reversal
You must be logged in to post a comment Login